-- Posted Monday, 22 June 2009 | | Source: GoldSeek.com
The time has come, the walrus said,
To talk of many things.
Of ships, of shoes, of sealing wax,
And whether gold has wings.
..apologies to Lewis Carroll
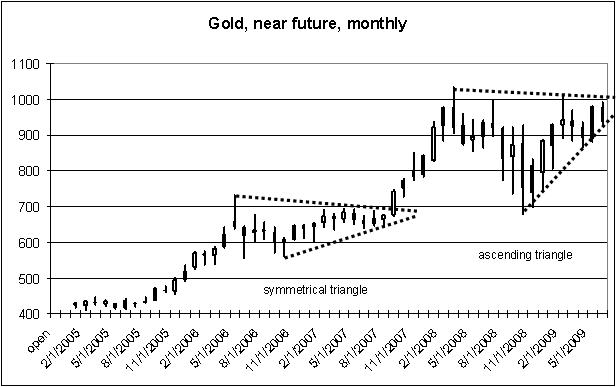
Recently we studied the symmetrical triangle and the ascending triangle and drew some interesting conclusions as to the price of gold. The decline of the past few weeks has been even more interesting and in no way refutes the conclusions we drew at that time.
But first, now would be a good time to remember some lessons from the 1970s. In todays markets, one must always keep in mind that we are in the second upswing of the commodity pendulum. This is the dominant economic pattern of our age. The traders who understand it and keep it foremost in their minds have a big advantage
The commodity pendulum is a giant swing in commodity prices which began in 1963. It is caused by the fact that commodity prices take a long time to respond to changes in the money supply. As we all know, consumer prices respond to an increase in the money supply in 1-2 years. However, commodity prices do not respond to an increase in the money supply for a much longer time (estimated at 1-2 decades). When the Government/banking system first started to create money, in 1963, consumer prices went up, but commodity prices remained flat for 8 years. During this time, of course, real commodity prices declined, and the result was that by 1971 commodities were undervalued very undervalued.
To give a clue, the real price of wheat in 1971 was 35¢ per bushel. What is the significance of that? Well, I have seen wheat charts going back into the early 19th century. In a typical boom, the price of wheat would get up to $1.50/$2.50. In a typical depression, it would get down to 50¢ per bushel. It is amazing how often that 50¢ figure appears as a low for wheat. It appears before the Civil War. It appears again in the Silver Campaign depression of 1896. And it appears one last time in the Great depression in 1932.
So when wheat hit 35¢ in 1971, this was the biggest news in commodity trading for almost 2 centuries. It told us that commodities were historically undervalued and were due for an astounding rise. An astounding rise was what we had. The CRB index rose from 96.4 in October 1971 to 337.6 in November 1980. The rise in commodities fed through into consumer prices. Not only did they rise with the money supply, they rose ahead of the money supply, and the newspapers screamed double digit inflation.
This, by the way, is the reason that the modern Commodity Research Bureau made a real bonehead play when they tried to rename the CRB index (calling it the Continuous Commodity Index) and replace it with what they called the RJ-CRB index. The RJ-CRB was constructed by people who were long on titles and short on brains. They created an index which is almost 50% crude oil. They knew too much mathematics and not enough economics. Damn, if you want a chart of crude oil, then you can look at crude oil. What is needed for commodity traders is an index which sums up what commodities as a whole are doing in the same way that the DJI sums up what stocks as a whole are doing. For this reason, I pay no attention to the modern RJ-CRB index and refuse to go along with the renaming of the CRB index (which they are now calling CCI). All it does is confuse people and make it harder to see the relationships in the markets, and the whole idea of constructing an index in the first place is to make it easier to see the relationships in the markets.
And the number one relationship for commodity traders is to understand that we are in the second upswing in the commodity pendulum. In 1999-2001, commodities got even more undervalued than they were in 1971. Wheat, in real terms, was down to 15¢/bu. All you have to do is know these two numbers: 50¢ before the Civil War; 15¢ in 1999. This tells you that the current undervaluation of commodity prices is enormous. (Remember that even the 50¢ figure was low in the 19th century, and if a trader of that age bought wheat every time it hit 50¢, he made a very pretty penny (actually a lot of very pretty pennies).
So here we are, in the modern age, and because of colossal blunders by our Government and intellectual establishment we have the greatest disequilibrium and the greatest undervaluation of commodities in history. Since this is the greatest cause, what we can expect are the greatest effects.
And the most important thing to learn from the commodity pendulum is that the current period is a repeat of the 1970s. Do you want to know what is going to happen in the markets tomorrow, next year and over the next five years? Look at the 1970s!
Fortunately, I am an old SOB and remember the 1970s well. One of the events which is burned into my mind was a gold conference I attended late in 1972. The price of gold was a little above $60/ounce, and it has been stuck there for the better part of 6 months.
At that time, the consensus prediction among gold bugs was that gold, which had been $35/oz. in 1970, would rise to $70/oz. This was considered a bold, even outrageous, forecast by the rest of the economic community. Indeed, the head of the House Banking Committee was forecasting $6-$8 per ounce gold. And he had the best economic advisors of the day.
What struck me at this conference was one speaker, a dedicated gold bug, who had gotten so discouraged by the 6-month pause that he publicly gave up his $70 objective and announced that he now believed that gold would never hit $70. Sad it was.
Of course, with the benefit of hindsight we can see how ridiculous this was. Gold did hit $70, and it kept going up. It hit $196 at the end of 1974, made a pull back and then put on an amazing move to $875 on Jan. 21, 1980. (Some writers refer to the 1980 top as $850. That was the price set in London. Later that day the near future hit $875 in the commodity market here in the U.S.)
This was my first lesson in economic myopia near sightedness. There is a very strong tendency for traders to pay too much attention to the short term and not enough attention to the long term, to get caught up in the moment and give it undue importance.
And that is the mistake that so many gold bugs are making today. They are caught up in the present moment, when $1000/oz. for gold seems reasonable, even high. A gold price in the low $60s seemed reasonable (and $70 seemed out of reach) in late 1972, but we now know that it was on its way to $875. In late 1972, gold had barely gotten started. Now let us look at the weekly basis chart:
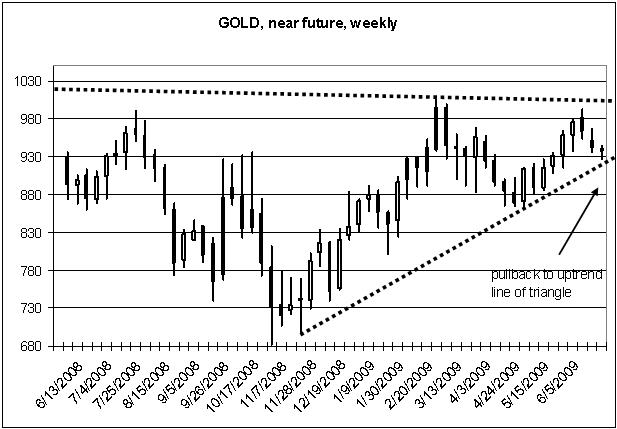
Since I last ran these charts, gold has made a small pull back. It is now resting on the uptrend line of the ascending triangle. This in itself is bullish as ascending triangles have a tendency to break out to the upside. (Of course, the real signal is not given until the actual breakout.)