-- Posted Monday, 16 January 2012 | | Disqus
By Justin Smyth
Sector rotation has been the name of the game to start 2012 for the stock market. The lagging sectors from 2011, including the financials, homebuilders, industrials, and materials, have been the leading sectors to start the year. This is exactly what the market needed to start establishing a more healthy structure. The market did not have a chance of making a legitimate move to the upside in 2012 without seeing money rotate out of defensive sectors that led during 2011. The following are some of the bullish signs the market has been displaying since putting in an important low in early October last year:
Rotation Out of Defensive Sectors
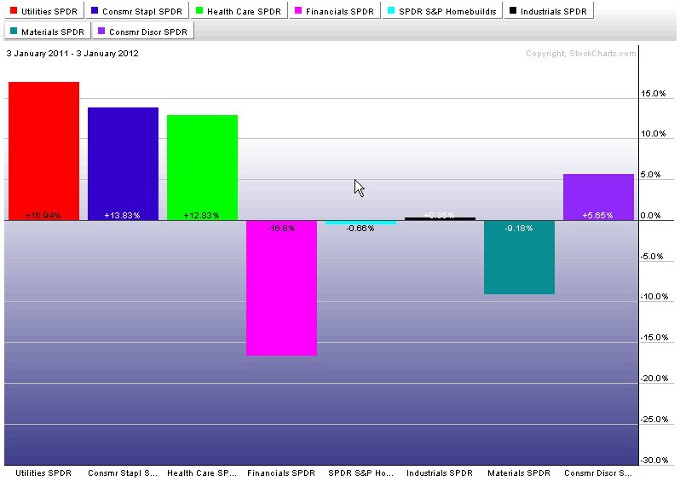
The rotation out of utilities, consumer staples, and health care and into more growth oriented sectors can be seen on the next two charts. In 2011 double-digit returns were achieved in the three defensive sectors while other sectors struggled.

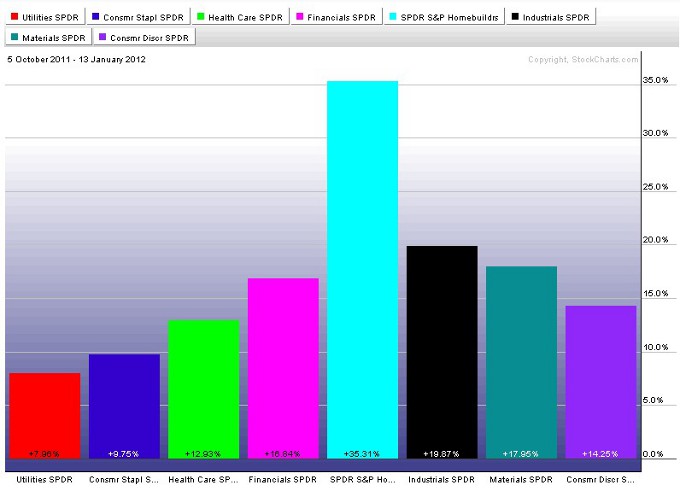
Since the early October bottom money has piled into more offensive sectors at a faster pace than the defensive sectors. This can be seen on the next chart showing performance since early October of 2011.

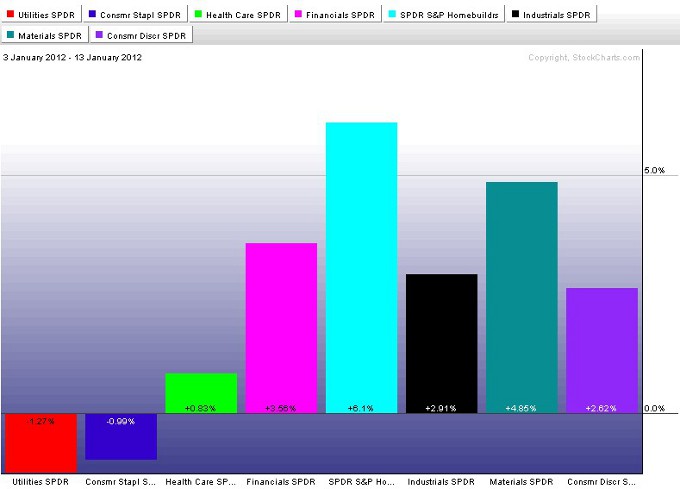
Part of the performance of the offensive sectors out of the October low was due to them being oversold and ripe for a bounce. But theyve continued to outperform the defensive sectors to start 2012. The next chart shows just the performance since the start of the year. Utilities and consumer staples are actually down, while homebuilders, materials, and financials are leading the way.

Fewer Downtrends in World Markets
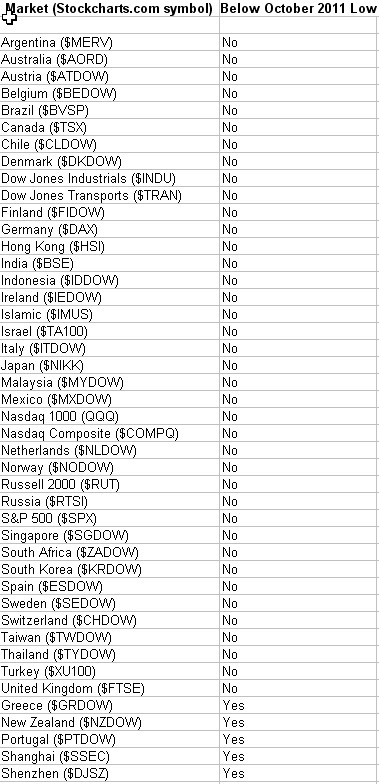
The early October low continues to be a major low across world markets. The longer this low holds in place, the more likely the Stage 4 downtrend that attempted to start last year will have terminated at that low. The next table shows a list of world markets and their relationship to their October low. As can be seen from the table the majority of world markets are still holding strong above their October lows.

Some world markets are a lot closer to their October lows than others. Due to the fact that U.S. markets have performed so well against world markets over the last year, I think that if the bear market were to resume, it would more than likely originate from foreign markets. Some foreign markets that are reaching inflection points on their charts include Australia, Brazil, India, Japan and China. The direction that these markets move should provide clues as to the future direction of other markets across the world, including U.S. markets.
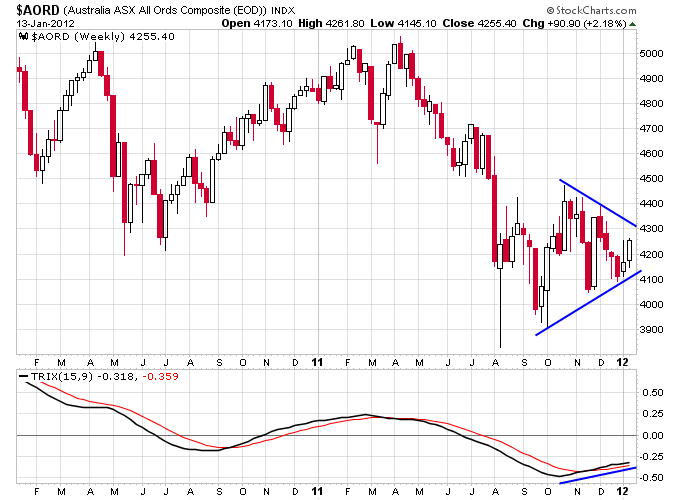
The chart of the Australian market is tracing a symmetric triangle with momentum still to the upside since October.

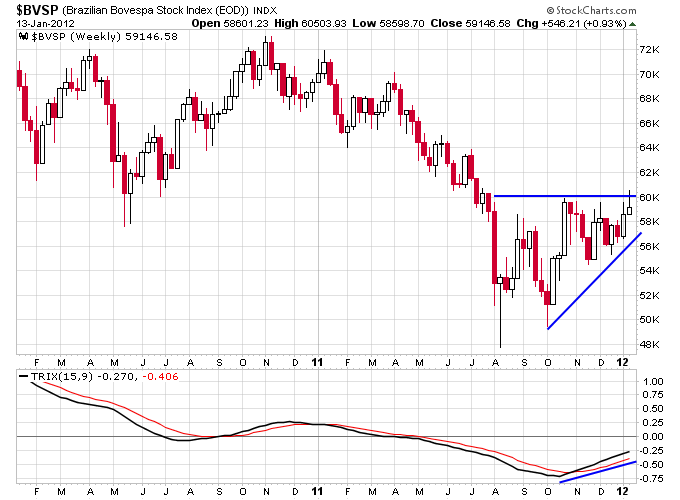
Brazil seems to have formed a significant double bottom in August and October of last year, and is now in an ascending triangle with momentum to the upside.

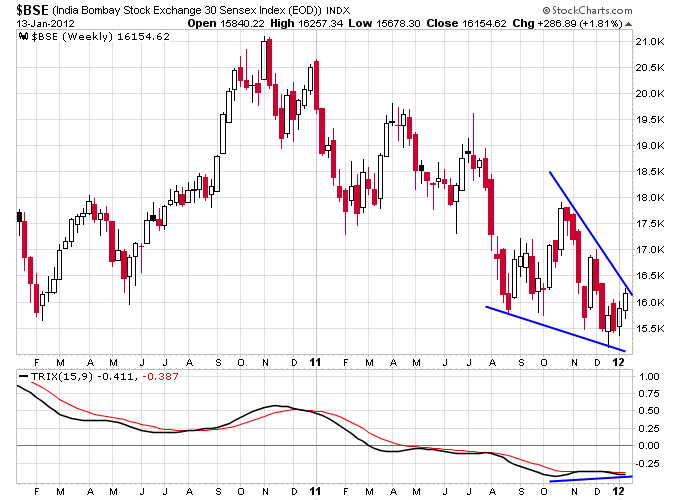
India looked like it was starting to breakdown further at the end of last year, but has rallied during the first two weeks of the year. The chart now looks like a falling wedge with a positive divergence in momentum. This is typically a bullish chart pattern.

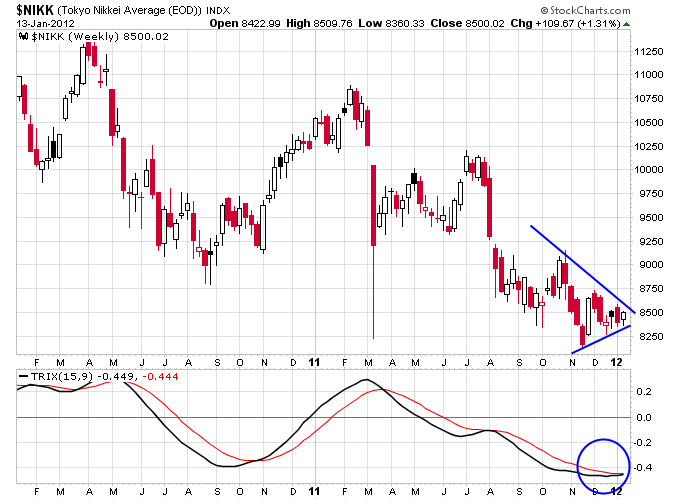
The Japanese Nikkei is coiled into a triangle with momentum ever so slightly trying to cross to the upside.

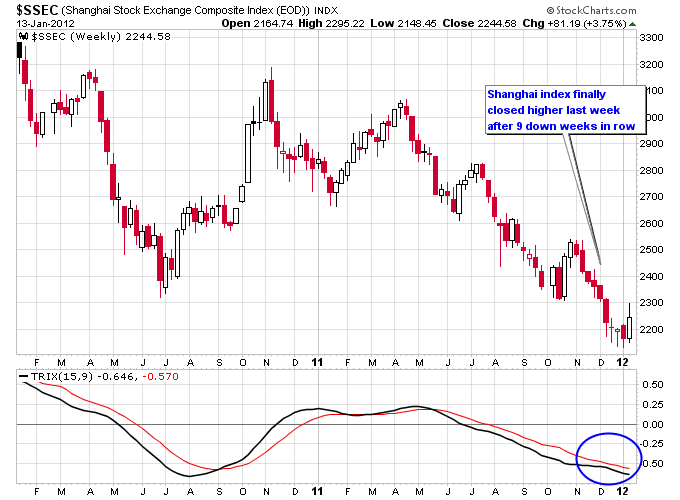
The Chinese market has been one of the worst performers over the last year, and ended 2011 with an astonishing 9 down weeks in a row. Momentum is still clearly to the downside but a significant new low in price hasnt been seen for almost a month now.

Renewed Speculation in Small Cap Stocks
Another bullish sign is more speculation in small cap stocks. When money piles into large cap and defensive names it tends to flow away from higher risk small cap stocks, and it also means money is more adverse to speculation in general. This creates more of a market of stocks, and not a stock market, where it is imperative to pick the right stocks in order to be successful. This is exactly what happened in 2011. But when speculation returns, theres more opportunities to find rising stocks since more money is entering the market.
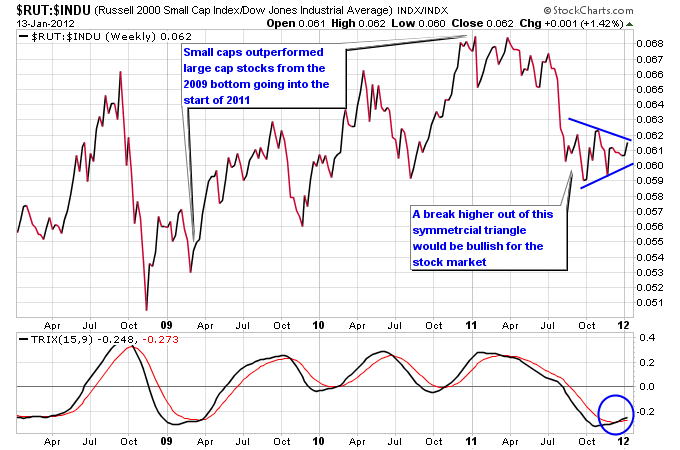
The next chart shows the ratio of the Russell 2000 to the Dow Jones Industrial Average. Notice that from 2009 until early 2011 small cap stocks outperformed large cap Dow stocks. Then the ratio made no further progress to the upside in early 2011 and started trending lower. This was a warning sign of money getting more defensive. Since the October bottom the ratio has slowly moved higher with positive momentum, and has traced a symmetric triangle on the chart.

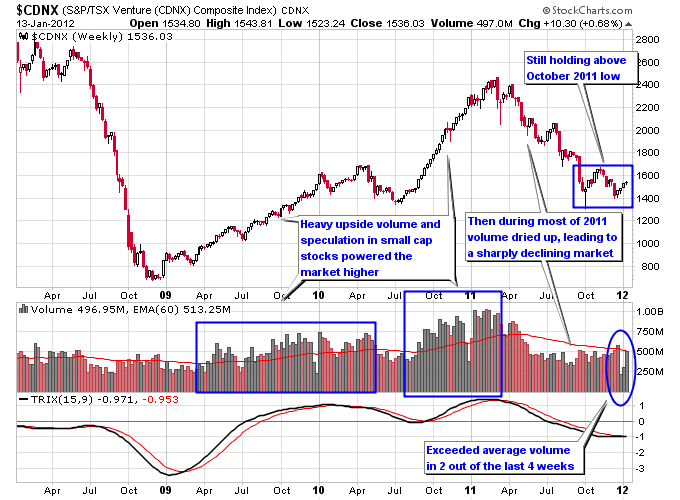
Fluctuations in volume on the small cap Canadian Venture exchange is another sign as to the amount of speculation going on in the market. On the next chart you can see that in 2009 and 2010 there was heavy speculation and upside volume in the Canadian Venture exchange leading to the market trending strongly higher. In 2011 that buying pressure dried up, and the poor performance of the small caps in Canada mirrored the poor performance of small caps in the U.S. Recently there has finally been some higher than average weekly volume on the upside though which is what the bulls want to see for the trend to change direction back higher.

There are other signs bulls would like to see for this market to continue acting healthy. Leading stocks need to continuing moving higher, an expansion in new highs and contraction in new lows, and formation of leadership sectors that help drive the market higher. This could also turn out to be another phony rally if the conditions laid out above dont work out. A quote from the great book How To Make Money In Stocks by William J. ONeil kind of sums up the current situation:
The key to staying on top of the stock market is not predicting or knowing what the market is going to do. Its knowing and understanding what the market has actually done in the past few weeks and what it is currently doing now.
With the headline threats of the European financial mess, calls for a recession in different parts of the world and political turmoil, its hard to believe the market could continue to act well. But underneath the covers thats what some of the signs are so far in 2012.
Follow me on Twitter: @nextbigtrade
The original article and much more can be found at: http://www.nextbigtrade.com
-- Posted Monday, 16 January 2012 | Digg This Article | Source: GoldSeek.com


