-- Posted Monday, 27 August 2012 | | Disqus
By Justin Smyth
Things are finally looking up for gold stocks. In fact its likely a new major rally has begun. The reason is that major corrections in secular bull markets produce the best buying opportunities. They are the biggest dips for those looking to buy the dip. And gold is most certainly in a secular bull market, even if it hasnt gone mainstream quite yet.
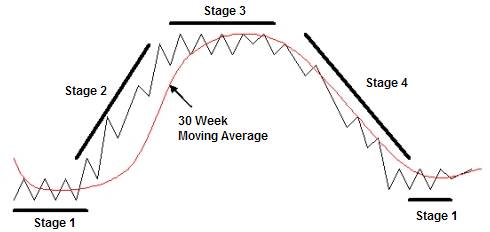
One way of viewing the turnaround underway in the gold sector is analyzing the sector using Stage Analysis (which was created by Stan Weinstein and discussed in the book Secrets For Profiting In Bull and Bear Markets). Stage Analysis breaks down the trend into 4 simple types: uptrend, downtrend, topping, or bottoming. By analyzing a wide array of gold stocks using Stage Analysis, and comparing the current analysis to past analysis, its possible to see whether the current picture for the gold sector is improving or weakening.

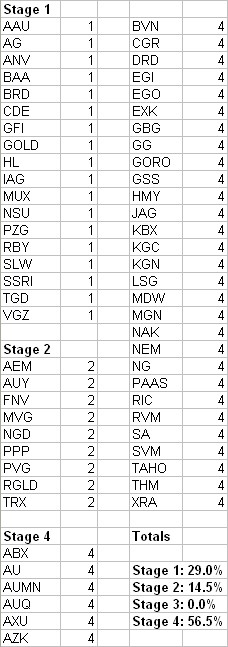
For the analysis shown below, 62 U.S.-listed gold mining stocks were sampled, ranging from major gold producers to gold miners still in the exploration and development stage. A moving average crossover system was used to generate the stage of each stock, to make the system mechanical. The percentage of stocks in Stage 1, Stage 2, Stage 3, and Stage 4 is also shown. Here is the Stage Analysis of the gold sector generated from the system as of last week (the week of 8/20/2012):

Heres how you breakdown the analysis. If, for example, a large percentage of stocks is in Stage 4, that means the gold sector is experiencing a strong downtrend. But at some point that downtrend will end, and you would start to see gold stocks move into a Stage 1 bottoming phase. Thus the percentage of stocks in Stage 4 would decrease as less gold stocks go down, and the percentage of stocks in Stage 1 would increase as more gold stocks start to bottom out. Then if a new rally in gold stocks was going to begin, more and more gold stocks would move into a Stage 2 uptrend, and the percentage of stocks in Stage 2 would increase.
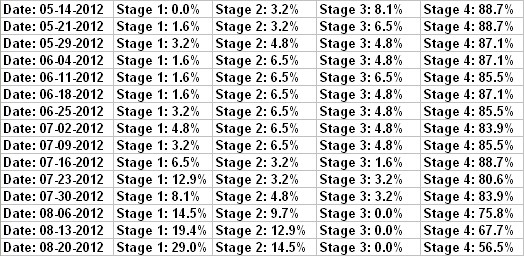
Not coincidentally, the example I discussed above is exactly what has happened for the gold sector since the middle of May. For the weeks of 05/14 and 05/21, 88.7% of the gold stocks analyzed were in a Stage 4 downtrend. It literally couldnt get any worse for gold stocks at that point. Ever since May the gold sector has steadily improved, but things have dramatically improved over the last 3 weeks in particular. Gold stocks now have the largest number of stocks that are bottoming out (Stage 1) and advancing in an uptrend (Stage 2) since mid-May. Besides the period leading up to the March downturn, this is the healthiest the gold sector has been all year.

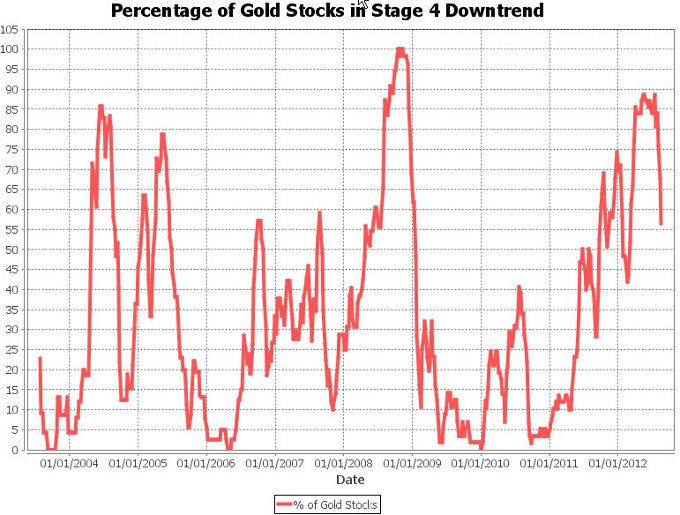
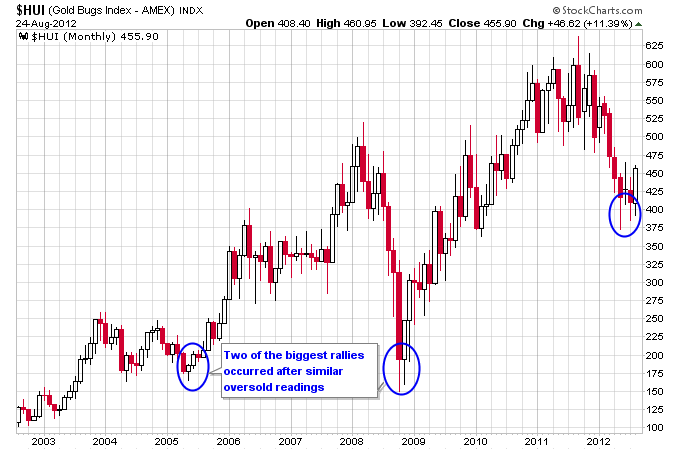
Next lets look at a graph that shows the percentage of gold stocks in Stage 4 over the long term. This graph basically shows how unhealthy the gold sector is at any given point in time, based on the number of gold stocks that are currently trending lower. This latest correction produced the second unhealthiest readings since 2004 for the gold sector, as shown by the graph. Only in 2008 was the gold sector in worse shape, when readings of 100% of gold stocks in a Stage 4 downtrend were briefly hit.

Now if you compare the graph above with a chart of the HUI Gold Bugs Index, you can see that the major rallies that were launched in 2005 and 2008 line right up with the periods where gold stocks looked their worst above. So in reality these proved to be big buying opportunities as the secular bull market in gold progressed.

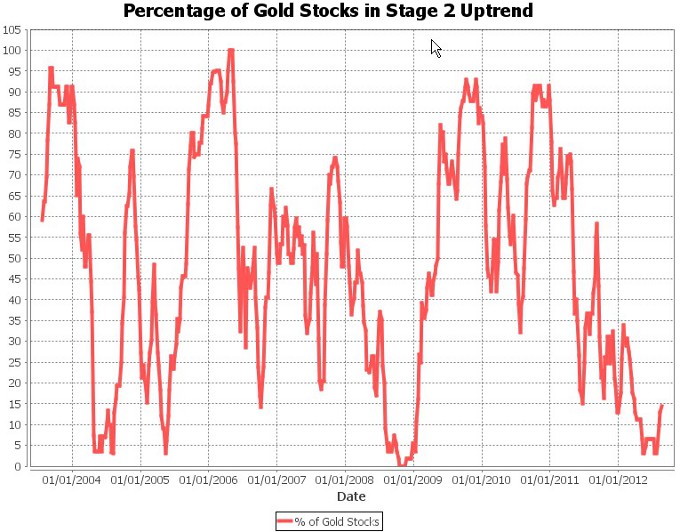
If we look at a long term graph of the percentage of stocks in a Stage 2 uptrend, we can see that were still just coming off of the bottom of this major correction.

If gold stocks continue to base over the next few weeks, and we continue to see more gold stocks transition from Stage 4 downtrends to Stage 1 bases, it should set the stage for a new powerful Stage 2 rally in the gold sector.
Justin Smyth
Connect with me on Twitter: @nextbigtrade
The original article and much more can be found at: http://www.nextbigtrade.com
The views and opinions expressed are for informational purposes only, and should not be considered as investment advice. Please see the disclaimer.
-- Posted Monday, 27 August 2012 | Digg This Article | Source: GoldSeek.com


