-- Posted Monday, 20 May 2013 | | Disqus
Imagination was given to man to compensate him for what heis not, and a sense of humor was provided to console him for what he is.
Oscar Wilde
This week the IMF released a studyevaluating QE and it comes at a time when the Federal Reserve is consideringwhether and how to exit. Without a doubt it will add to the debate around thestill-controversial practice. The IMF found the bond-buying efforts of the Fed,the Bank of England, the European Central Bank and the Bank of Japan were ableto restore the functioning of financial markets and provide accommodation withinterest rates at near zero levels. The IMF also found that asset pricesbenefited globally, though capital flows increased to emerging markets. Whileadditional unconventional measures may be appropriate in some circumstances,there may be diminishing returns, and benefits will need to be balanced againstpotential costs, the IMF study said.
Some of the risks include greaterrisk-taking behavior that may undermine stability, delayed reforms andpotentially volatile capital flows. The IMF, like the Fed, also is worried aboutthe impact on financial markets once central banks begin to sell assets.The IMF also sees the possibility of political inference should profits dropor diminish altogether during the tightening cycle. The IMF study comes as Fedofficials debate the current $85 billion per month asset purchase program.
In the US the drumbeat to reduce the rate ofbond purchases by the Federal Reserve grew louder Thursday, with a dovish voicejoining the group. JohnWilliams, the San Francisco Fed president, indicated the $85 billion per monthof bond purchases can be reduced soon, and that the whole program may be haltedthis year. Hepointed out the pace of job growth has picked up since the program was launchedin September, with an average pace of job growth of 200,000 over the last sixmonths.Assuming my economic forecast holdstrue and various labor-market indicators continue to register appreciableimprovement in coming months, we could reduce somewhat the pace of oursecurities purchases, perhaps as early as this summer. Then, if all goes ashoped, we could end the purchase program sometime late this year, saidWilliams in a speech in Portland, Ore.
WhileWilliams doesnt have a vote this year on the Federal Open Market Committee, hejoins other Federal Reserve officials this week calling for a slowdown in theprogram. But unlike Richard Fisher of the Dallas Fed and Charles Plosser of thePhiladelphia Fed, Williams is decidedly in the so-called dovish camp. Williams made clear that even if thebond purchases slow down, they could be ramped backed up if the economyflounders. He went on to say that even when the Fed halts bond purchases it will still havetrillions of dollars of Treasury and mortgage-backed securities (around $3.4trillion to be precise) on its balance sheet, Williams pointed out.
Its believed that Williamss voicecarries weight, as he is close in intellectual framework to Chairman BenBernanke and Vice Chairman Janet Yellen. Its also worth noting that Williamsgave little space to discussing inflation, and certainly did not express anysense of alarm about the recent decline in the inflation measures. Finally,this isnt the first time Williams has mentioned the prospect of the Fedwinding down bond purchases, but his comments were more explicit than before.In February, he had said bond purchases would be needed well into the secondhalf of the year which implies the purchases would be halted by the end ofthe year. Now hes implying that they could begin the winding down process now.
So whatexactly is the Fed trying to do? On Thursday I saw that the Empire State manufacturing surveyfell into negative territory in May for the first time since January, thisaccording to the New York Fed. The general conditions index fell to a negative1.4 in May from positive 3.1 in April. The new-orders index also fell intonegative territory, falling to negative 1.2 from positive 2.2 in April, as didthe average employee work week, which fell to negative 1.1 from 5.7 in April.Then in a separate report the U.S.wholesale prices sank in April for the second straight month as the cost ofgasoline and vegetables fell sharply. The producer-price index declinedby a seasonally adjusted 0.7% to mark the biggest drop in more than threeyears, the Labor Department said Wednesday. Waning price pressures inApril lowered the increase in wholesale costs over the past 12 months to 0.6%from 1.1% and thats the lowest level since last summer.
So why does the Fed want to cut back when theeconomy is slowing? Perhaps its having a crisis of conscience as it comes tothe realization that QE is in fact a failed policy? The Fed has blown itsbalance sheet up from US $600 billion to US $3.4 trillion and it seems that thelawof diminishing returns is setting in. My concern runs even deeper as Ifear the law of negative returns may be setting in!That could also explain why the Fed is now engaging in the blame game, sayingthat a lack of fiscal policy on the part of the Congress limits the effect ofthe Feds monetary policy.
Lately theres bee a lot of talk that Fed policyis responsible for reviving the housing market. On Thursday it was announcedthat privately owned housingstarts in April were at a seasonally adjusted annual rate of 853,000. Thisis 16.5 percent below the revised March estimate of 1,021,000, and was quietlyswept under the rug by the press. Here you can see the recentrecovery and the dip at the end:
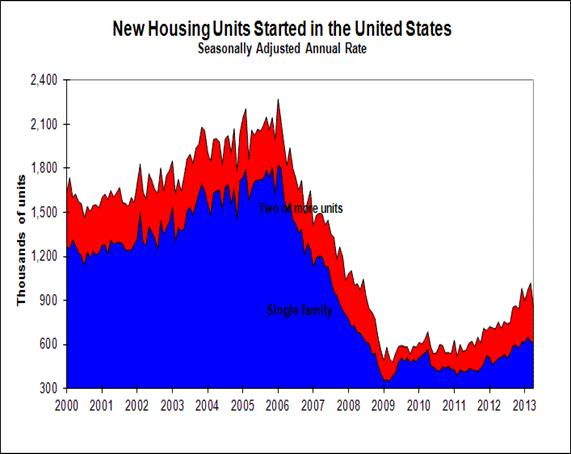
For those investors out there pinning their hopeson a housing revival, there is problem. These charts of the housing starts area laggingindicator while the following chart of the price of lumber is a forward-lookingindicator. If you look closely at this chart, youll see that the priceturned up two months before housing started to improve, and youll see that itturned down almost three months ago:
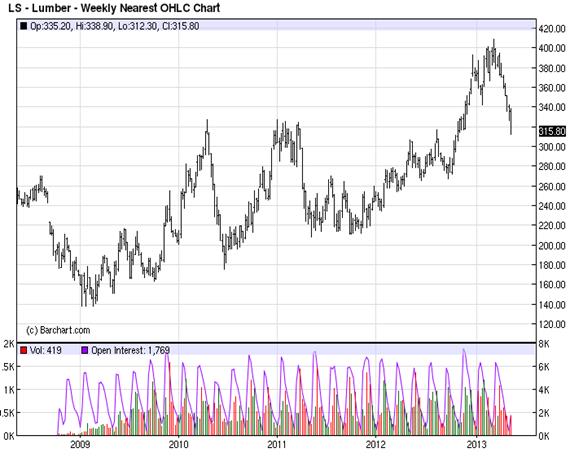
Lumber is a primary ingredient in US housing andthe sudden decline in price is more than a coincidence, its a warning.
There are other signs of change in the wind. TheUS dollar has been on the rise for several months as you can see here:
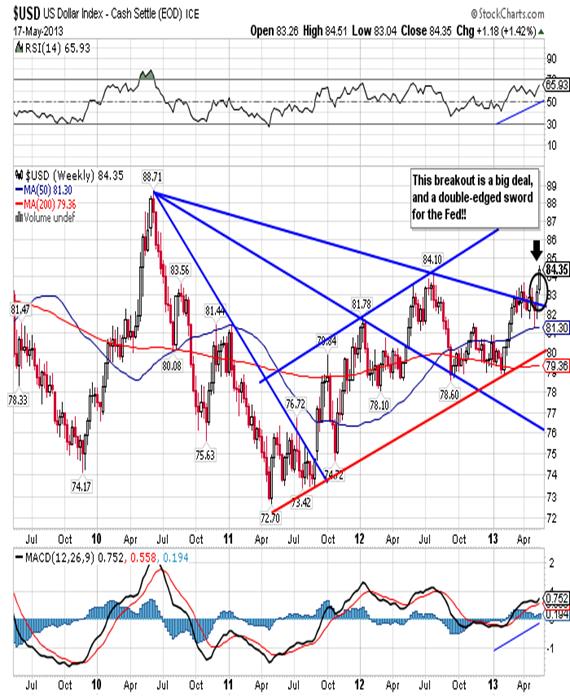
The US dollar is on the rise for a number ofreasons. The Japanese, UK and Europeans are on a printing binge and the Chinesearent all that far behind. Europe now has six straight quarters of negativegrowth while China will be lucky to have 3% growth this year. Indias economyhas stalled and Brazil isnt any better so old habits, like a move intodollars, are hard to break. Perhaps more importantly the dollar smells and endto QE!
Another sign that were about to see a change instrategy is the continued decline in bond prices. As youll see here, bondprices have been declining for ten months:
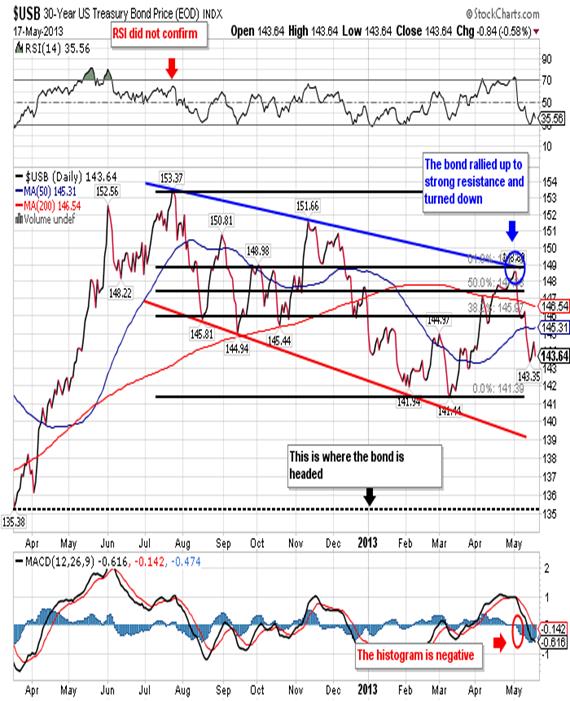
Of course lower bond prices mean higher interestrates and that will also affect the housing market. Aside from that it means the costof servicing US debt rises with the interest rate. If you look closelyat the chart youll see a series of lower highs with price currently below boththe 50-dma as well as the 200-dma, and the 50-dma has crossed under the200-dma.
Anothersign of problems in bond paradise involves the down turn in the very interestsensitive Utility Average Index:
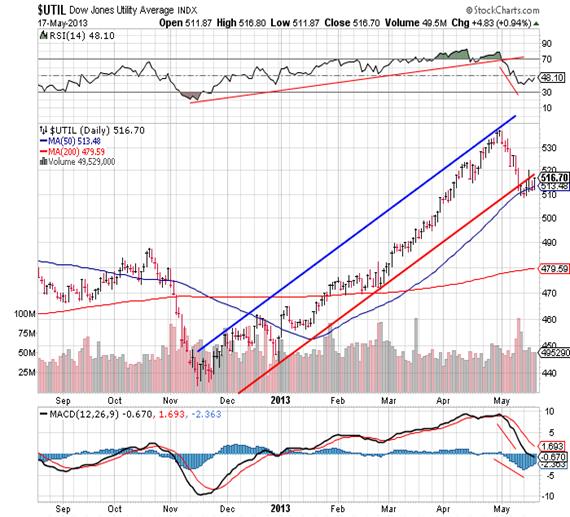
Quiteoften a down turn in bonds will be preceded by a top and decline in the UtilityIndex. Here we see not only a decline but also a break below the bottom band ofthe trend line and a test of the 50-dma.Since bond prices have now begun a new leg down, I wouldnt be surprised to seethe Utility Index break below the 50-dma early this week.
Right nowits hard enough to place bonds, and in spite of the Fed purchasing close to70% of all emissions, we see bond prices falling and interest rates rising.Some months ago I concluded that thebond market is to be sold short and any attempt to exit QE will turn a declineinto a crash. Nothing has changed as the Fed painted itself into a corner byestablishing itself as the buyer of last resort, and now the Fed will go to itsgrave as the buyer of last resort. This Friday the June bond futures contractwas down another 1.15 at 143.31, a new closing low for this move down. Peopledont get that bond prices can fall even though the Fed continues to buy.Simply put they fall because supply overwhelms demand and that is a situationthat will only worsen over time. Thats why I sell the bonds short for myclients. Its simply one of the bestinvestments they can make in 2013!
As far as bubbles are concerned if the Fed doesnthave housing, all thats left is the Dow. So far the Dow has not disappointedas it cranks out one new all-time closing high after the other. On Friday theDow closed out the week up 121 points at 15,344, the seventh new all-time closinghigh out of the last eleven sessions:
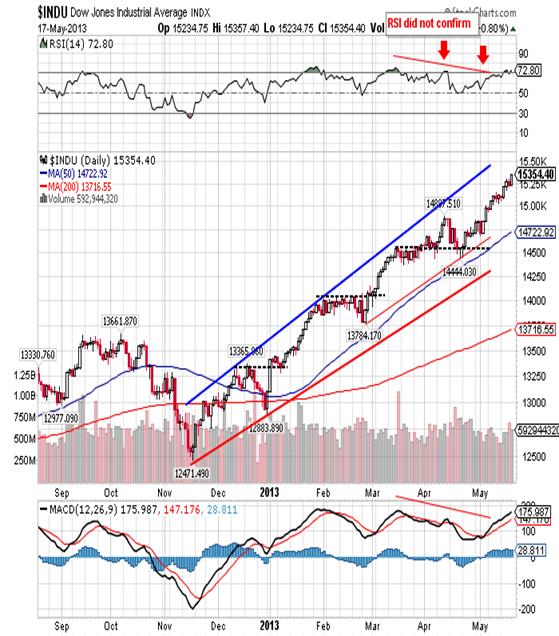
You can see that the Dow has been in rally modefor six months, with no more than a four-day decline along the way. Aside fromthat were seeing new all-time highs in both the S & P 500 as well as theTransportation Index. As you can see in the following chart, the Transportsarrived late to the party, but theyre there nonetheless:
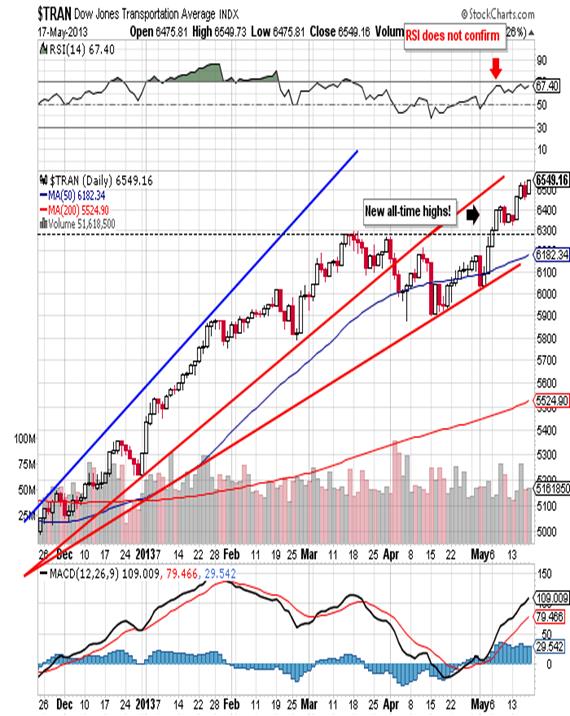
Friday was no exception as the Transports closedup 81 points at 6,549, another new all-time closing high.
If you look under the surface theres very littleweakness to be found. The percentageof NYSE stocks holding above their 50-day moving averages remained impressiveat 76.99% as you can see here:
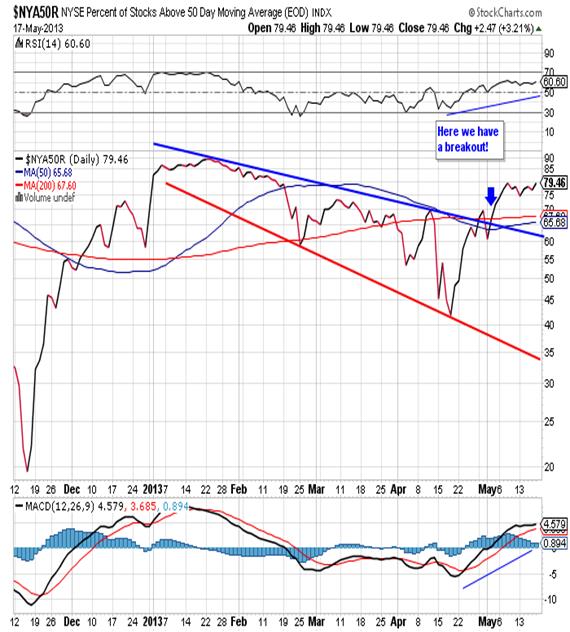
If I were to postcharts of the percentage of stocks trading above their respective 200-dmas, orthe NYSE High Low Index, you would see the same positive picture. Finally, if theres been one consistencythroughout the advance in the Dow, its the fact that absolutely no one isworried:
The current levelof complacency matches what we saw heading into the October 2007 top andexceeds what we saw in March 2000 as the tech wreck unfolded. For those of youwho think this time is different because the Fed supports the market, you wouldbe wise to rethink your position. Finally, if youre long the Dow I would use atight stop at this point.
Now lets move onto gold. In last Sundays report I said that giveneverything thats developed over the last couple of months, and in particularover the last four weeks, I see four possible outcomes:
· i.) May 10thsdip was a fluke and the bottom is in and well move up from here through thecritical 1,522.00 area and eventually a lot higher, or
· ii.) Gold continueslower on Monday or Tuesday to test good support at 1,402.90, a 50% retracementof the gains from the 1,321.50 low to the recent 1,487.20 high. Well hold thesupport and eventually start to rally up and through the resistance at 1,469.50and keep grinding higher throughout the year, or
· iii.) Gold willbreak below the 1,402.90 support and well run down to retest the 1,321.50April low. Gold will hold at or slightly above the April low and then begin ajourney up to much higher levels.
· iv.) The last case scenario is where gold fallsdown to 1,321.50, breaks below it and falls all the way down to 1,100.00 in avolatile, fast break (no more than two or three weeks, followed by a sharprecovery and an eventual move to much higher highs.
I then went on tosay that I believe well more than likely see either the second or thirdscenario play out, and I would give either one the same chance of happening.Given everything thats happened this week we can now rule out the first andsecond scenario since spot gold closed out the week at 1,359.10.
While the primary trendin golds bull market remains intact it is important to understand that thereare several factors contributing to lower gold prices right now, and they arecumulative:
· The fact thateverybody is printing and that supports the US dollar,
· Real interest ratesare negative or at zero so bonds and have no place to go but up,
· There is a paper(futures) market for gold that allows the bullion banks to pressure thephysical market for gold lower,
· The Dow isrecording new all-time highs every week so its an attractive alternative, and
· There is a mediablitz against gold.
This combination ofevents has gold heading lower for the moment and that benefits the centralbanks and smart money that want to buy cheaper gold.
Like other analysts Ithought that the bottom was already in and the strong support at 1,522.10 wasimpenetrable, and I was wrong. Making a mistake doesnt bother because I treatit as a learning experience, butrepeating the same mistake is inexcusable. So now when everybody rushes outto say that the April 16th low of 1,321.50 is the low, Ill have to pass on that for the moment and heres why:
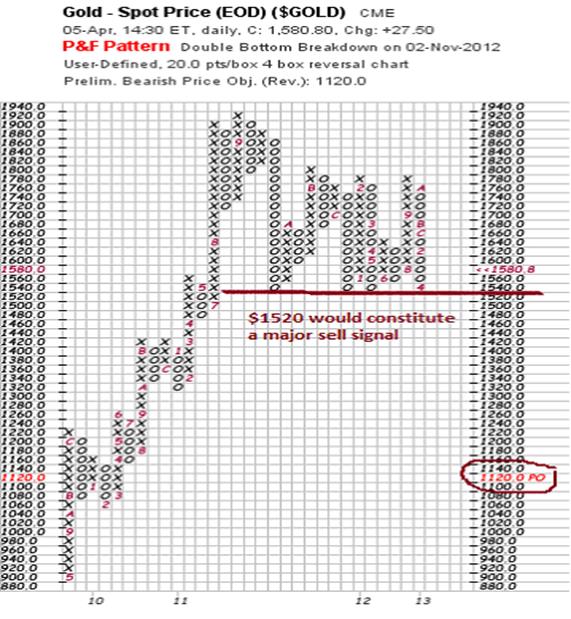
This is a Point &Figure chart that I published back in early April and is the work of JohnStrebler. At that time gold was at 1,580.00 and many were looking for abreakout to the upside. I noted backthen that a break below the critical 1,522.10 support would leave gold in a bigvacuum with nothing really to support it until it hit 1,089.00. Thatswhy I took my clients short as soon as price dipped below 1,522.00 and didntcover until it hit 1,345.00. Furthermore I only covered because RSI on theweekly and monthly charts hit 15.00 and I had never seen that before, in goldor anything else other than Dutch tulips. As it turned out the plunge stoppedat 1,321.50 almost one month ago, rallied up to the 1,468.67 resistance
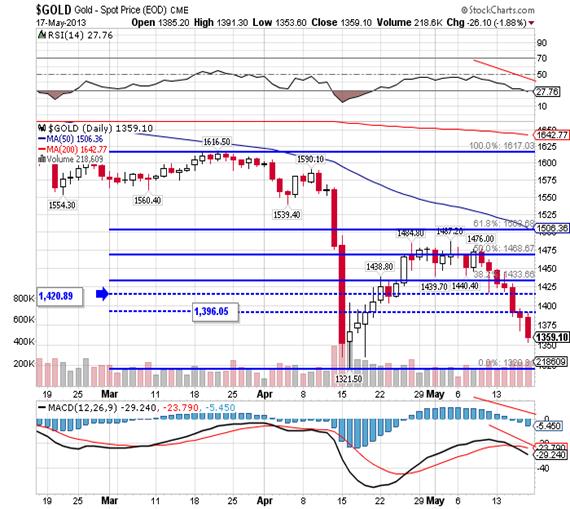
marking a 50%retracement from the point where it turned down and then it stopped. More than a half dozenattempts to punch through that resistance failed. As I type the spot gold isback down at 1,359.10 and has traded as low as 1,353.50. That is well belowboth the 1,425.70 and 1,404.10 support levels I have mentioned in previously.
I know that some veryintelligent people like Richard Russell believe the bottom is in, and I knowthat Jim Sinclair published a piece saying that we would see a secondary low ingold and silver between May 9th and 12th, but that didntturn out so well. That empty void Ipointed out in Streblers Point & Figure chart is huge and it literallyjumps out at you. Then I take into consideration that the Fed needslower prices right now to support the dollar, eliminate alternatives to the Dowand maintain credibility, so I have my doubts. Thats why Im short paper gold from 1,471.00, lookingfor a test of the April 16th bottom at 1,321.50 at the very least.
In conclusion, I hopegold holds here but my experience is that hope only disappears right after the margin call arrives. Even if gold breaks down here I do look fora bottom in gold over the next couple of weeks and I am convinced a decline to1,100.00, should it occur, will be swift and violent. I am also sure that wellbe at the bottom for a few minutes, and the bounce that follows will also bequite strong as the desire for physical gold completely overwhelms the papermarket. Finally, in the event that 1,321.50 holds here, and itspossible, Ill take in my short position and go long. In the mean time I havephysical gold and silver that Ive accumulated over the years that I nevertouch, and I have no doubt that it will come in handy once the wheels fall offof the fiat machine. In conclusion itreally doesnt matter which of the two remaining scenarios plays out becauseboth end with a move to much higher (new all-time) highs, the only differenceis the amount of pain we need to suffer in order to get to those new highs.
CONCLUSION
When Nixon wastook the oath of office for the second time in January 1973, the seeds plantedduring the first four years were supposed to yield a lot of fruit. In steadscandal brought his administration down. The nation ground to a halt as Americasat glued to its television sets to watch the impeachment hearings. NowPresident Obama may be headed down that same road with not one, but threescandals. The IRS scandal is the most serious, and the most likely to bringback a genuine whiff of Nixon who used the IRS as a weapon against his enemies.
In this case,IRS workers were filtering a wave of applications for tax-exempt status bypolitical organizations during the run-up to the 2012 election - casting anunacceptable and possibly illegal eye towards whether they had the phrases like"Tea Party" or "Patriot" in their name. While none of theconservative applicants were ultimately denied tax-exempt status, the intrusiveinquiries delayed their advocacy and cast a chill on the political process.After the scandal broke last week, President Obama denounced the actions as"outrageous" and fired the acting IRS director along with a topdeputy.
Were supposed to believe that hearings from aninept Congress will help determine how widespread this blatantly biasedpractice was, but the initial investigation report found no orders coming fromoutside the agency. Did they just decide to do this on their own? Not likely! Newregulations need to be put in place to ensure this abuse cannot happen againwhile also ensuring that explosive growth of partisan groups pretending to benon-partisan non-profits is properly monitored.
The secondscandal came when the Associated Press was told by the Justice Department thatreporters' phone records had been secretly subpoenaed as part of aninvestigation into a leak concerning national security, most likely related toa story that compromised a field agent's identity. Some of the conversationstapped were in Congressional cloakrooms where politicians meet for informalreunions and had nothing to do with the investigation! All of a suddenprivacy issues and concerns over the excesses of the Patriot Act becamepersonal to the press corps and they reacted with understandable outrage in aseries of brutal press conferences. On the surface, this new version of the old strugglebetween freedom and security might recall Nixon-era fights over the PentagonPapers. But the ugliness of this particular inquiry is really a reminder of howfar technology has outpaced our laws, putting privacy under assault forindividuals and the press.
Finally, thereis the continuing inquiry into the killing of four Americans in Benghazi. Afterdamning congressional testimony from former deputy chief Libya diplomat GregHicks, the White House belatedly released a barrage of emails - which showedthat the editing of the now-infamous "talking points" used byofficials in television interviews was largely the product of a bureaucraticturf war between the CIA and the State Department. Only now is the White Houseforthcoming with some documents related to this scandal.
All of this comesat a time when both the White House and Congress should be focusing theirattention on a slowing economy, high unemployment and massive debt. Insteadwell be watching Congressional hearings run by the same political hacks wevebeen watching for twenty years, anxious to win brownie points with the public.Maybe even laying the groundwork for a run at the White House! The only thingyou can be certain about is that they dont have the publics best interest atheart.
These scandals willsurely occupy the news for the weeks and months to come, meaning that nothingwill be done about the debt ceiling and deficits that face us here and now. Whatnobody seems to get is that these scandals are just part and parcel of acontinual erosion of the rights of Americans. Much like the movie Wag The Dog a lot of this is aconcerted effort to keep Americans from focusing on what matters. In the endnothing will be resolved and the inquiries will fade in September as footballseason heats up. Once the Super Bowl is played, theyll have to come up withsomething else
maybe a good war!
St.Andrews Investments, LLC
LasVegas, Nevada, USA
info@standrewspublications.com
www.standrewspublications.com
-- Posted Monday, 20 May 2013 | Digg This Article | Source: GoldSeek.com


