-- Posted Friday, 24 May 2013 | | Disqus
By: David Chapman, www.davidchapman.com
Much has been made about the drop in COMEX gold stocks. COMEX gold stocks have fallen from 11.1 million ounces in the end of 2012 to just under 8 million ounces today. The bulk of the decline has occurred at the JP Morgan Chase Depository that has seen its stocks fall from 2.8 million ounces to just over 800 thousand ounces since late 2012. JP Morgan Chase is the depository for the SPDR Gold Trust (GLD-NYSE). Of the other four depositories, the Scotia Mocatta Depository has seen the largest decline from roughly 4 million ounces at the beginning of 2013 to 2.8 million ounces today. The other depositories are smaller and have remained relatively stable.
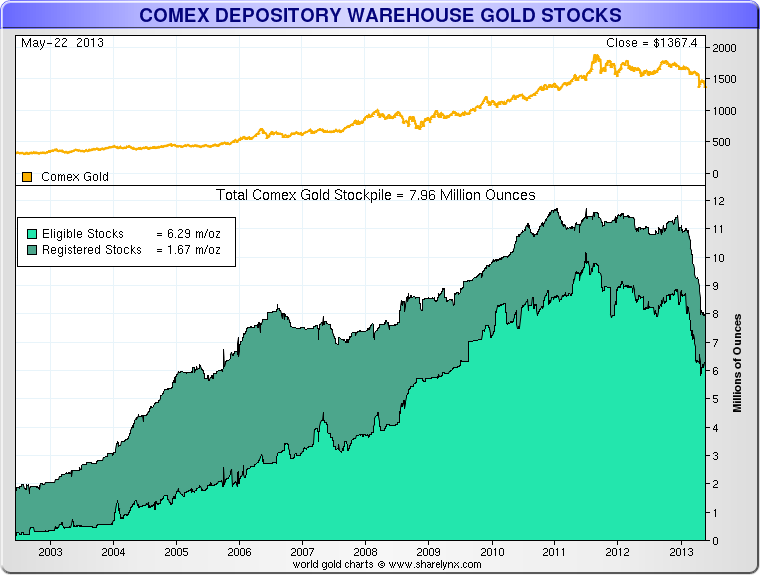
Source: www.sharelynx.com
The question that has been raised is does the COMEX have sufficient supplies on hand to meet demand if holders of gold futures were to demand delivery. In some respects, the question is moot. The vast majority of longs do not ask for delivery nor for that matter do the shorts have the metal to deliver. The vast majority of positions, long and short, are either covered for cash or rolled over to the next contract month. In a fast moving market, both up and down, it is the margin calls that may offer the best clue. If you are being sold out, it means you do not have the cash to stand for delivery.
While the COMEX stocks have fallen since late 2012, the stocks are considerably higher than they were in February 2001 at the market bottom and in January 1980 at the famous market top. In January 1980, stocks were roughly 2.3 million ounces and in February 2001 at the market bottom, they were about 1.8 million ounces. The peak in stocks was seen in August 2011 at 11.6 million ounces.
So what does all this mean? If stock were rising since 2001 that probably means that open interest was rising as well. And that has certainly been the case. In February 2001 at the market low open interest as expressed in millions of ounces was 14.6 million ounces. Today it stands at 45.3 million ounces and that is down from the peak in 2011 when at one point it was over 60 million ounces. It appears that has open interest rose, stocks rose and as open interest fell stocks fell as well.
Possibly a more efficient way of measuring as to whether there are sufficient stocks is take the ratio of open interest contracts to COMEX gold stocks. There is a chart of that ratio as provided by Sharelynx Gold www.sharelynx.com.
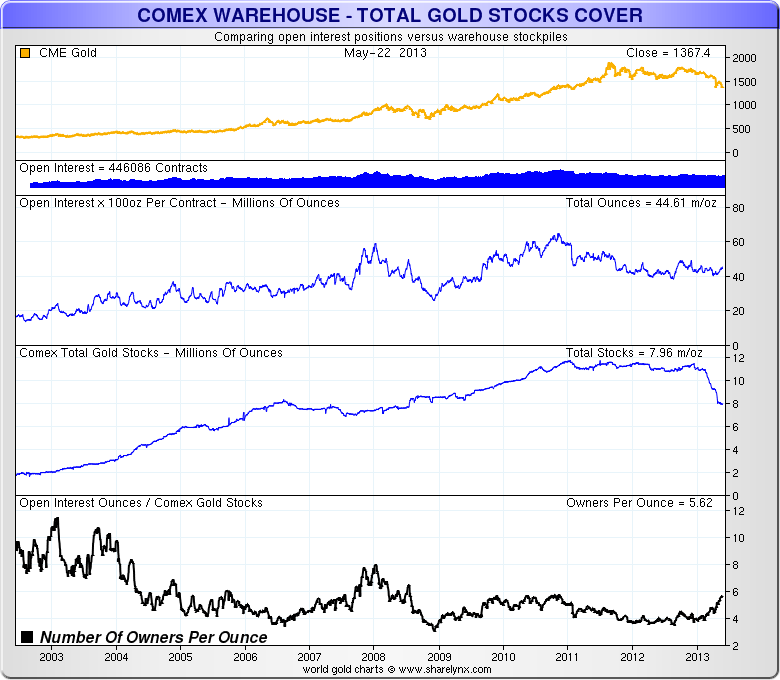
Source: www.sharelynx.com
The ratio today sits at 5.6 owners for each ounce of stock. The ratio has been rising. At year-end 2012 the ratio was 3.8 owners for each ounce of stock. In 2008 at the time of the financial crash, there was approximate 3.6 owners for each ounce of stock. Back in 2003 there was over 10 owners for each of stock. The peak was back in 1997 at the time of the Asian contagion crisis when there was over 44.1 owners for each ounce of stock. Other key dates were the January 1980 high when the coverage 8.7 owners for each ounce of gold stock and at the February 2001 low when the coverage was 8.3 owners for each ounce of gold stock.
The ratio has been rising but today it is lower than it was at the time of the January 1980 high, the February 2001 low and only slightly more than it was at the time of the August 2011 peak. While open interest has fallen since the beginning of 2013, stocks have also been falling but at a slightly faster pace.
Of potential greater concern is the decline in registered stocks. There are two types of stocks held in COMEX warehouses eligible stocks and registered stocks. Eligible stocks meet COMEX requirements but do not have delivery receipts issued against them, whereas registered stocks are the only gold stocks used to meet COMEX futures delivery requests.
At year-end 2012, registered stocks totaled 2.3 million ounces vs. eligible stocks of 8.8 million ounces. Recent numbers show there are now 6.3 million ounces of eligible stocks a decline of 2.5 million ounces and 1.7 million ounces of registered stocks for a decline of 0.6 million ounces. Of more importance is the coverage. At year-end 2012, there were 18.6 owners per ounce of registered gold stock whereas the most recent numbers show there are 26.6 owners for each ounce of registered stock. Again as with the bigger picture, the trend has moved higher with more claims on each ounce of registered stock.
As with total stocks, it has to be put in perspective. It is not as high as it was in August 2011 at the market peak when there were 29.2 owners for each registered stock. It is, however, above the 2008 financial crash market low when it recorded 11.9 owners for each ounce of registered stock.
That the COMEX have fallen is not disputed. But has the decline created a potential crisis? While owners per ounce of stock or registered stock has gone up the levels are not yet at peak ratios. This suggests that the COMEX still should have sufficient stocks on an historical basis. However, if the ratio continues to rise it could become a concern.
By: David Chapman, www.davidchapman.com
Copyright 2013 All Rights Reserved David Chapman |
General disclosures
The information and opinions contained in this report were prepared by MGI Securities. MGI Securities is owned by Jovian Capital Corporation (Jovian) and its employees. Jovian is a TSX Exchange listed company and as such, MGI Securities is an affiliate of Jovian. The opinions, estimates and projections contained in this report are those of MGI Securities as of the date of this report and are subject to change without notice. MGI Securities endeavours to ensure that the contents have been compiled or derived from sources that we believe to be reliable and contain information and opinions that are accurate and complete. However, MGI Securities makes no representations or warranty, express or implied, in respect thereof, takes no responsibility for any errors and omissions contained herein and accepts no liability whatsoever for any loss arising from any use of, or reliance on, this report or its contents. Information may be available to MGI Securities that is not reflected in this report. This report is not to be construed as an offer or solicitation to buy or sell any security. The reader should not rely solely on this report in evaluating whether or not to buy or sell securities of the subject company.
Definitions
Technical Strategist means any partner, director, officer, employee or agent of MGI Securities who is held out to the public as a strategist or whose responsibilities to MGI Securities include the preparation of any written technical market report for distribution to clients or prospective clients of MGI Securities which does not include a recommendation with respect to a security.
Technical Market Report means any written or electronic communication that MGI Securities has distributed or will distribute to its clients or the general public, which contains a strategists comments concerning current market technical indicators.
Conflicts of Interest
The technical strategist and or associates who prepared this report are compensated based upon (among other factors) the overall profitability of MGI Securities, which may include the profitability of investment banking and related services. In the normal course of its business, MGI Securities may provide financial advisory services for issuers. MGI Securities will include any further issuer related disclosures as needed.
Technical Strategists Certification
Each MGI Securities technical strategist whose name appears on the front page of this technical market report hereby certifies that (i) the opinions expressed in the technical market report accurately reflect the technical strategists personal views about the marketplace and are the subject of this report and all strategies mentioned in this report that are covered by such technical strategist and (ii) no part of the technical strategists compensation was, is, or will be directly or indirectly, related to the specific views expressed by such technical strategies in this report.
Technical Strategists Trading
MGI Securities permits technical strategists to own and trade in the securities and or the derivatives of the sectors discussed herein.
Dissemination of Reports
MGI Securities uses its best efforts to disseminate its technical market reports to all clients who are entitled to receive the firms technical market reports, contemporaneously on a timely and effective basis in electronic form, via fax or mail. Selected technical market reports may also be posted on the MGI Securities website and davidchapman.com.
For Canadian Residents: This report has been approved by MGI Securities which accepts responsibility for this report and its dissemination in Canada. Canadian clients wishing to effect transactions should do so through a qualified salesperson of MGI Securities in their particular jurisdiction where their IA is licensed.
For US Residents: This report is not intended for distribution in the United States.
Intellectual Property Notice
The materials contained herein are protected by copyright, trademark and other forms of proprietary rights and are owned or controlled by MGI Securities or the party credited as the provider of the information.
Regulatory
MGI SECURIITES is a member of the Canadian Investor Protection Fund (CIPF) and the Investment Industry Regulatory Organization of Canada (IIROC).
Copyright
All rights reserved. All material presented in this document may not be reproduced in whole or in part, or further published or distributed or referred to in any manner whatsoever, nor may the information, opinions or conclusions contained in it be referred to without in each case the prior express written consent of MGI Securities Inc.
-- Posted Friday, 24 May 2013 | Digg This Article | Source: GoldSeek.com


