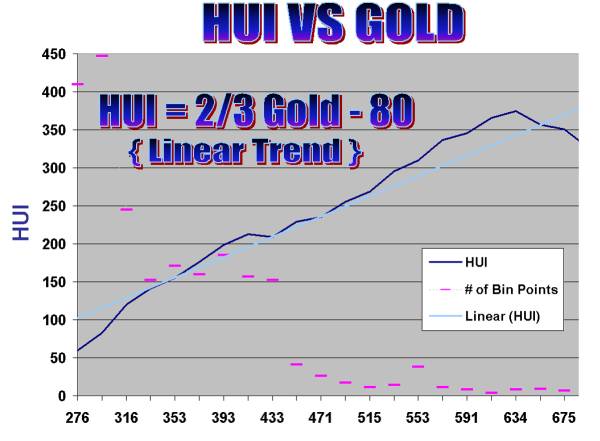
First, let's revisit the work presented in a 2001 paper entitled "Looking for Leverage in the HUI" - where the fundamental relationship between the HUI and Gold was explored and where the original "rule of 200" was developed. Basically, small price ranges of gold and their associated HUI values were each averaged to produce a single data point - the results then plotted over the entire range of these "bin" points. The figure below shows the results of this updated analysis.
The purple dashes show the number of times the price of gold fell within a price bin...data ranges between June of 1996 until the present time. There are relatively few data points when the price of gold traded higher than $450. As such, the strength of the conclusions should be tempered by this sparse data. The dark blue line is a plot of the process described above, and the light blue line is its linear trend. This trend line is well approximated by the formula shown: HUI = 2/3 Gold - 80. As an example, when gold is $600/oz, HUI's average historical performance values it at 320. Note the inverse relation as well: Gold = 3 (HUI + 80 ) / 2.
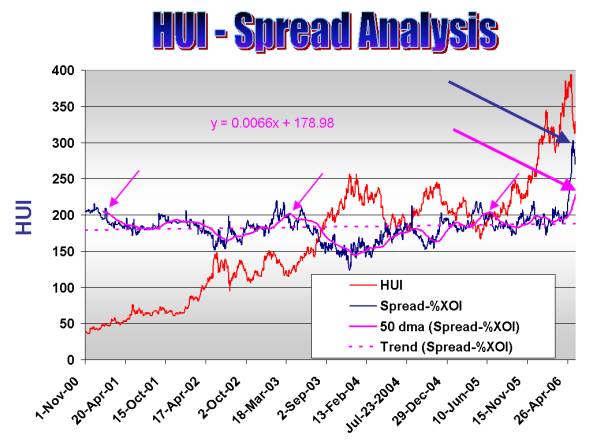
Now, let's consider the updated spread analysis shown in the plot below - previous readers should note that the standard spread has been removed; only the oil adjusted spread is shown to make the plot less cluttered.
The small purple arrows show good buy points for the raging gold bull that started in late-2000/early-2001. Any time the 50 day moving average (dma) of the spread popped above the 200 mark, significant gains were soon to follow. Now notice the large arrows at the right of the figure. The dark blue arrow corresponds to a huge spike in the absolute spread, and the large purple one corresponds to a similar historical spike in the 50 dma of the spread.
Previously, this type of spike has signaled a great buying opportunity. However, because it stands out so dramatically, some additional consideration is warranted. As I said earlier, there have been relatively few days where gold and the HUI have traded in these higher ranges. As such, the spread behavior could be misleading - without the sparse data caveat, it signals the "mother of all buying opportunities".
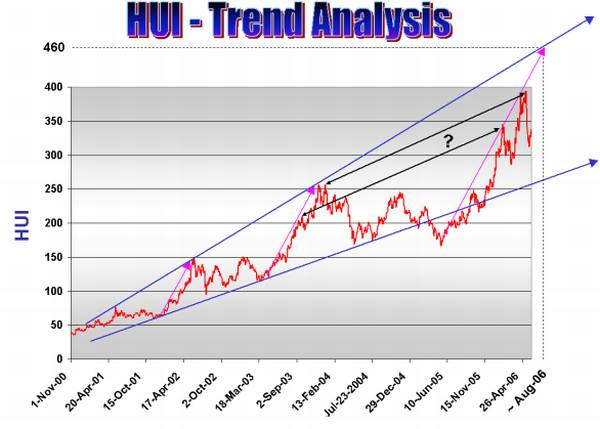
Finally, let's revisit the trend analysis given in the last few referenced editorials. There is something new to consider.
First, the blue lines show the cone-channel previously introduced. The purple arrows are parallel and show the major price moves in the HUI over the last five and a half years. Now look at the black double-arrows and the "?" mark. Here's the idea; if these lines are meaningful, then we may have reached a prolonged period of consolidation (on the order of a year). However, according to the cone-channel, we have not yet completed the move in the HUI.
In conclusion, it appears that we are in a period of uncertainty. Breaking 400 on the HUI should confirm the idea of filling the channel and bring the 460 target back into play. (Note that with the formula provided at the beginning of this paper, the 460 target corresponds to a gold price of about $810/oz.) Barring the setting a new high in the HUI, we may have entered into a period of consolidation.
Axiom House is running a great special starting June 6 and running all day June 7. You can check it out at the link below or by clicking on the picture. GATA will receive a $2 donation for every book purchased by a member.
The content on this site is protected
by U.S. and international copyright laws and is the property of GoldSeek.com
and/or the providers of the content under license. By "content" we mean any
information, mode of expression, or other materials and services found on GoldSeek.com.
This includes editorials, news, our writings, graphics, and any and all other
features found on the site. Please contact
us for any further information.
Live GoldSeek Visitor Map | Disclaimer
The views contained here may not represent the views of GoldSeek.com, Gold Seek LLC, its affiliates or advertisers. GoldSeek.com, Gold Seek LLC makes no representation, warranty or guarantee as to the accuracy
or completeness of the information (including news, editorials, prices, statistics,
analyses and the like) provided through its service. Any copying, reproduction
and/or redistribution of any of the documents, data, content or materials contained
on or within this website, without the express written consent of GoldSeek.com, Gold Seek LLC,
is strictly prohibited. In no event shall GoldSeek.com, Gold Seek LLC or its affiliates be
liable to any person for any decision made or action taken in reliance upon
the information provided herein.