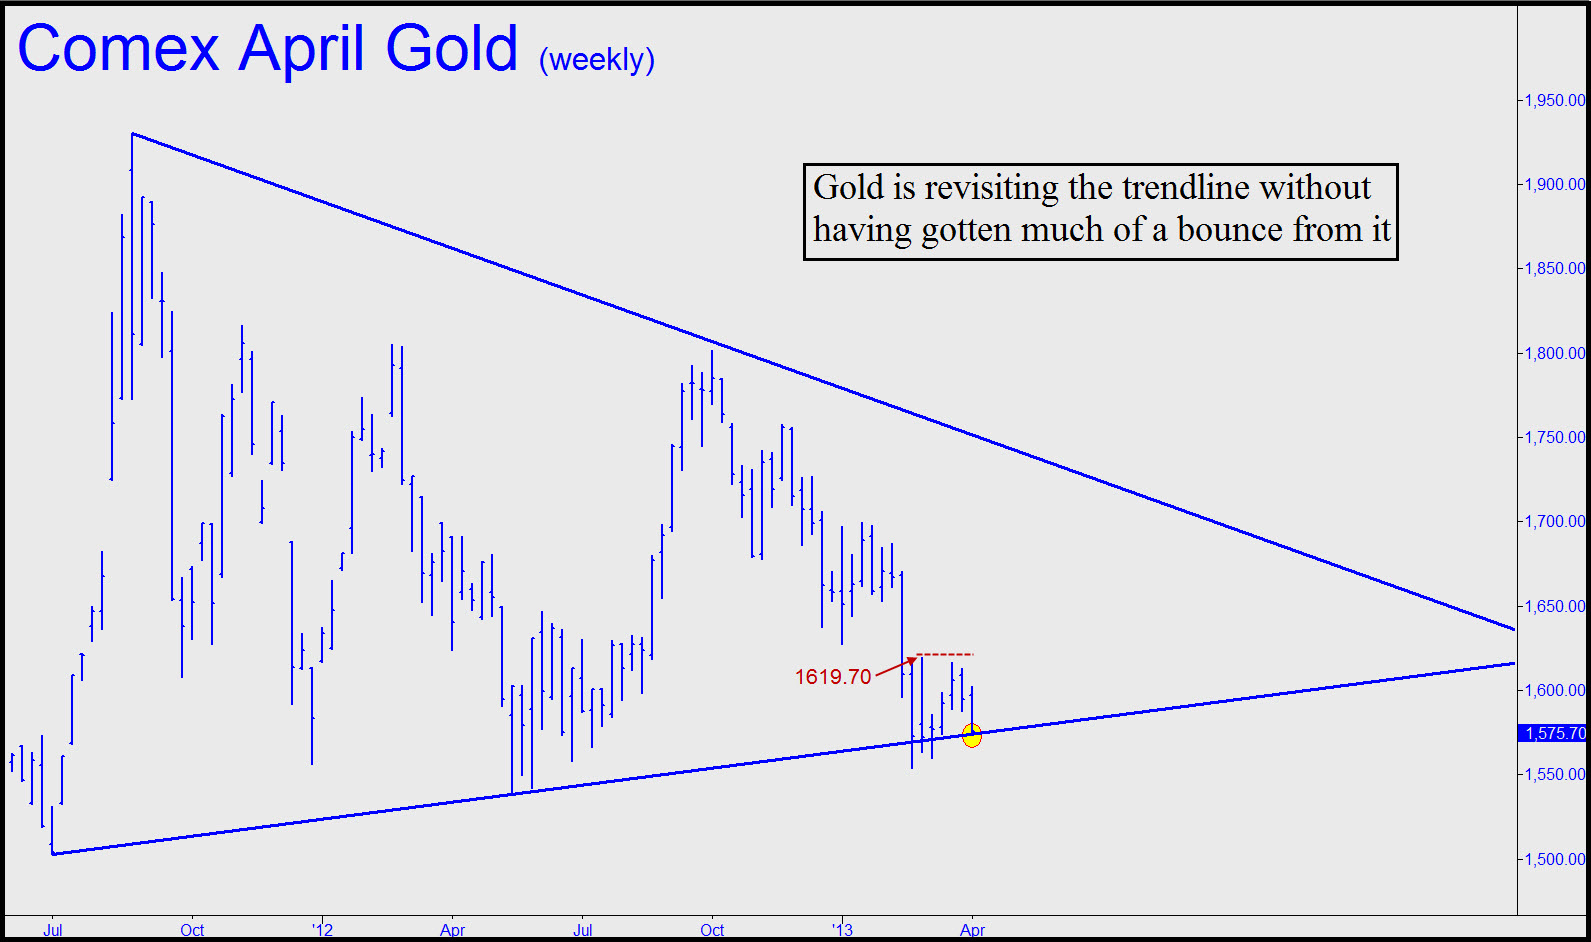
With a scary bank crisis in Cyprus driving the headlines a couple of weeks ago, gold could barely muster a rally. Notice in the chart below that the high of the move failed to clear a minor peak at 1619.70. Had it done so, we would have given bulls a fighting chance, since it would have created a bullish impulse leg with the potential to power quotes as much as $120 higher in just a few weeks. Instead, buyers showed themselves to be gutless, allowing the April contract to relapse down to within inches of the lower trendline. It could hold, but we doubt it.
Still worse is that a breakdown is likely to send the futures down to at least 1553.50, a Hidden Pivot support identified here a couple of weeks ago when the futures were trading above 1600. If that hidden support should fail as well, look out below, since the next stop would be a more important one at 1487.00 that was flagged at the same time. That would represent a 5.5% fall from current levels, which would hardly be disastrous. But it would also turn a trendline that has provided support since July of 2011 into resistance, opening a path to significantly lower prices into autumn.
Three Scenarios
Because the trendline is so clear, it seems all but certain to be tested. It comes in at around 1570 this week, and you should expect it to be breached. Once that has occurred, things could play out in a few different ways. Most bullish of them would be a sharp rebound that vaults the 1619.70 peak by mid-April. Thats what we should expect to happen if the smart money is planning to shake out the weak sisters in order to run gold steeply higher without being burdened by nervous profit taking. But if gold proves unable to get serious loft within a week or two, be prepared for a downdraft to 1487.00. Another possibility is a tedious game of footsies on and around the trendline. Beware, however, if settlement occurs below the trendline for two consecutive weeks, since that would imply distribution.
Because the long-term trend in gold is bullish, we should be willing to give it the benefit of the doubt under any circumstances. Technically speaking, it would take an impulsive rally on the hourly chart to turn us bullish again. At present, that would imply a swift thrust hitting 1612.90 within three or four days of any fleeting dip below the trendline. Wed lay three-to-one odds against it at the moment, but stranger things have happened.
-- Posted Wednesday, 3 April 2013 | Digg This Article | Source: GoldSeek.com
The content on this site is protected
by U.S. and international copyright laws and is the property of GoldSeek.com
and/or the providers of the content under license. By "content" we mean any
information, mode of expression, or other materials and services found on GoldSeek.com.
This includes editorials, news, our writings, graphics, and any and all other
features found on the site. Please contact
us for any further information.
Live GoldSeek Visitor Map | Disclaimer
The views contained here may not represent the views of GoldSeek.com, Gold Seek LLC, its affiliates or advertisers. GoldSeek.com, Gold Seek LLC makes no representation, warranty or guarantee as to the accuracy
or completeness of the information (including news, editorials, prices, statistics,
analyses and the like) provided through its service. Any copying, reproduction
and/or redistribution of any of the documents, data, content or materials contained
on or within this website, without the express written consent of GoldSeek.com, Gold Seek LLC,
is strictly prohibited. In no event shall GoldSeek.com, Gold Seek LLC or its affiliates be
liable to any person for any decision made or action taken in reliance upon
the information provided herein.


