How will we know when the Yen carry trade has been completely 'unwound'?
Nobody knows the total extent of the Yen carry trade, but it is probably at least US$500B and could be as much as US$1T. At least, these are the sorts of numbers that would have been applicable prior to the recent surge in the Yen and associated plunges in the investments/currencies that had been purchased with borrowed Yen. Clearly, whatever the size of the Yen carry trade at this time last month, it is a lot smaller today. The question is: has the Yen carry trade now been almost completely unwound?
Our guess is that hundreds of billions of dollars of Yen carry trades remain in place, because the exiting of all, or even the majority of, these trades would have resulted in a lot more than a 10% rebound in the Yen and 10% pullbacks in the senior stock indices. In any case, the signal that the Yen carry trade has been reduced to a shadow of its former self will be a sizeable bounce in the Yen that is not accompanied by 'all heck' breaking loose in other markets. Putting it another way, when the Yen can rally by 2% without causing other markets to plunge we'll know that the Yen carry trade is no longer a dominant influence in the financial world.
And once the Yen carry trade has been mostly 'unwound' we suspect that it will remain that way because speculators will not soon forget the cost of making large one-ways bets against this currency. This means that the shakeout that got underway last month should ultimately result in the Yen's longer-term BULLISH fundamentals being permitted to exert their rightful influence on the currency's relative value.
A US$ rally: probably not now, but soon
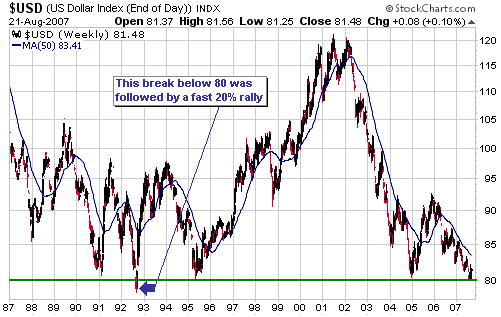
How bearish would a break below 80 be for the Dollar Index? With reference to the following weekly chart, perhaps as bearish as the 1992 break below 80.
The weekly chart presented above shows that the Dollar Index bottomed at 80 in early 1991, then rallied for several months before embarking on a decline that would take it back to 80 by the third quarter of 1992. It then dropped below this major support level and traded as low as 78...just prior to commencing a quick-fire 20% rally.
The price action of the past few years has been quite similar to the price action of the early-1990s, although the price moves of the past few years have been more subdued and have taken place over slightly longer time periods. This doesn't necessarily mean that the end result will also be similar, but with the US$ both under-valued and oversold relative to the euro we suspect that it will be. (Note that we don't expect the Dollar Index to rally by as much as 20% because US$ strength against the euro will likely be offset to some degree by US$ weakness against the Yen, but a 3-6 month advance that takes the Dollar Index 10-15% higher looks feasible.)
That having been said, there is no evidence in the price action that the sort of US$ rally mentioned above has already begun. Previous intermediate-term rallies from near major support at 80 have begun with large weekly up-moves, but the current US$ rebound from major support has not been particularly impressive to date. This might mean that a 1992-style spike below 80 will have to occur before a meaningful advance begins.
Gold versus Silver
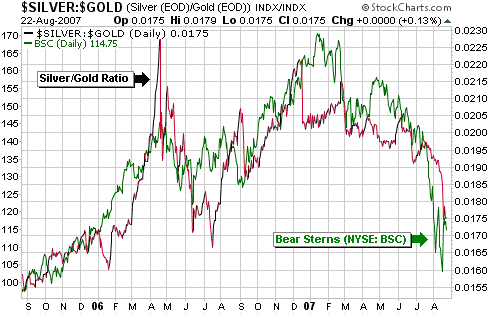
As discussed many times in TSI commentaries over the years, silver tends to do well relative to gold when confidence in the financial system is rising and poorly relative to gold when confidence is falling. This makes sense because silver is more of an industrial metal than a monetary metal whereas gold's supply/demand equation is dominated by changes in investment/monetary demand.
The above-mentioned relationship between the silver/gold ratio and confidence in the financial system has been as strong as ever during the past two years and is illustrated by the chart presented below. The chart compares the silver/gold ratio with the stock price of Bear Sterns. We chose Bear Sterns for this comparison because it is a large Wall Street financial house that fared well during the boom years and more recently became the 'poster child' for the "subprime debt crisis".
Clearly, as confidence has ebbed and flowed over the past two years, as indicated by the performance of Bear Sterns, so has the silver/gold ratio. Therefore, those who were wondering why silver has been weak relative to gold over the past 6 months should wonder no more.
The message of the above chart is that if the "subprime crisis" worsens over the coming 1-2 months then silver will weaken further relative to gold, but once the crisis ends we should see silver strengthen relative to gold.
-- Posted Tuesday, 28 August 2007 | Digg This Article | Source: GoldSeek.com
Regular financial market forecasts and analyses are provided at our web site. We arent offering a free trial subscription at this time, but free samples of our work (excerpts from our regular commentaries) can be viewed at:
http://www.speculative-investor.com/new/freesamples.html
The content on this site is protected
by U.S. and international copyright laws and is the property of GoldSeek.com
and/or the providers of the content under license. By "content" we mean any
information, mode of expression, or other materials and services found on GoldSeek.com.
This includes editorials, news, our writings, graphics, and any and all other
features found on the site. Please contact
us for any further information.
Live GoldSeek Visitor Map | Disclaimer
The views contained here may not represent the views of GoldSeek.com, Gold Seek LLC, its affiliates or advertisers. GoldSeek.com, Gold Seek LLC makes no representation, warranty or guarantee as to the accuracy
or completeness of the information (including news, editorials, prices, statistics,
analyses and the like) provided through its service. Any copying, reproduction
and/or redistribution of any of the documents, data, content or materials contained
on or within this website, without the express written consent of GoldSeek.com, Gold Seek LLC,
is strictly prohibited. In no event shall GoldSeek.com, Gold Seek LLC or its affiliates be
liable to any person for any decision made or action taken in reliance upon
the information provided herein.


 Thoughts on Currencies and the Gold/Silver Ratio