|
-- Posted Monday, 27 August 2007 | Digg This Article
Good week but on pathetic daily trading volume. Professionals still on vacation ??? Lets see where we are. GOLD LONG TERM
Semi-Log Scale 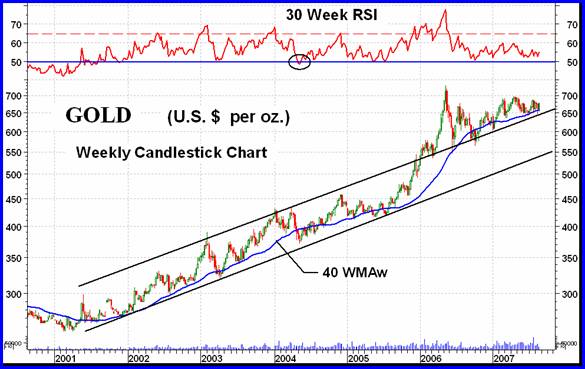 I was sort of unsure which long term chart to show this week, a bar (or candlestick) chart or a P&F chart. However, the P&F chart shown with the 03 Aug 2007 commentary has still not budged. It is still as it was then. All that action over the past few weeks made not a smidgeon of effect on the P&F chart. For those interested in what it looks like you can go to the archives of some web sites publishing these commentaries. I will show the P&F again one of these weeks, especially if there is some movement in the chart. The weekly chart shown this week has been shown on many occasions in the past. The interesting points are the up trending channel which was broken on the up side over a year ago with the upper resistance trend line now acting as a support line. Except for a very brief period the long term momentum (represented here by a 30 week RSI) has been in the positive zone ever since it made its bull start back in 2001. The momentum continues in its positive zone but is in a very precarious position. It would not take much negative action to move this indicator into the negative zone. That could come should the price decline again AND move below the now support trend line shown. Since peaking in early 2006 I have been looking for some sign that the momentum indicator is showing signs of strength versus price action as a prelude to a sustained new bull move. No such sign has yet shown itself. With the price action still slightly above a positive sloping moving average line I can only remain BULLISH on the long term. However, if one were to rate this bullishness on a scale of 1 (least bullish) to 5 (most bullish) I would rate it at 1 or 2 at this time. INTERMEDIATE TERM 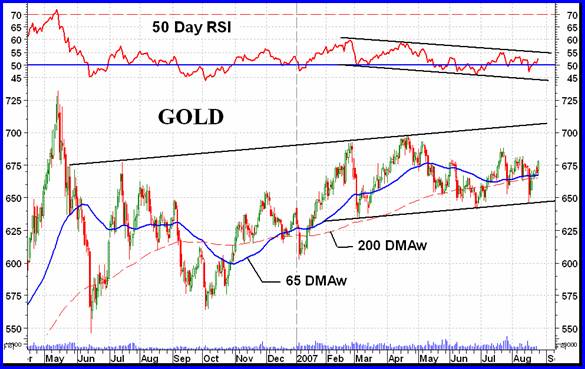 When you have a chart and cant find any quick obvious patterns in it you start grasping at straws. This is what you get with the straw grasping. One can draw a resistance trend line through three or four tops since May of 2006. With that you draw a parallel line and see if you can match it to any bottoms. Low and behold you can match the trend to recent bottom actions providing a several month up trending channel. Looking encouraging so far. So, we have a gently upward sloping channel trend in the price activity, but what about the underlying strength (or momentum) of this activity? For this we go to the momentum indicator, here represented by the 50 day RSI indicator. The two price tops during 2007 in the price channel were, unfortunately, unconfirmed by similar tops in the momentum indicator. The lower top in the second case gave us that much dreaded negative divergence. Since then the price has gone nowhere. The momentum, however, has shown a negative channel activity since the divergence. Now what? Looking at the two one observes that the price is still within the lower half of its channel while the momentum is in the upper half of its channel. You can deduce many things from this, mostly contradictory. But lets not get too deep into the charts. Should the price continue to rally one can imagine that the momentum would quickly break above its upper channel line long before the price reaches its upper trend line. This might be the start of showing some strength versus price action but would not be the hoped for seriously powerful positive divergence. Any positive signs would be welcome, however, and we will have to see how things transpire in such event. Should the price turn lower, momentum would turn also but at what strength is the unknown. Both may reach their lower support lines at the same time or not. So much for confusion. With the price once again moving above its moving average line and momentum moving back into the positive zone one cannot remain bearish. However, I dont think there is strong enough movement here to go all out bullish so I will go to the NEUTRAL rating this week. I know, thats a cop-out but so be it. SHORT TERM 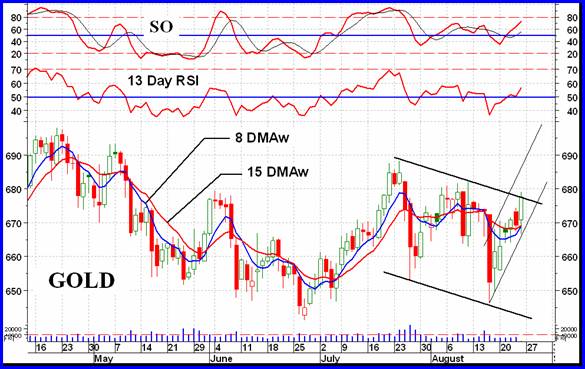 So, what can we determine for the short term? We are in a little bit of a rally but with the daily low volume behind this move it does not give one a comfortable feeling. Short term momentum (13 day RSI) has moved into the positive zone to confirm the price move but not with any significant extra strength. There is nothing much to grab on to so Ill go with the trend in motion, and thats to the up side. A move below $665 might, however, signal a reversal in progress. IMMEDIATE TERM As with the short term we have an up move in progress so that is what to expect over the next day or two. As we have seen, the flip of the coin gives us a 50/50 chance of guessing the next days action but so be it. One thing that is noted is the positive divergence in the aggressive Stochastic Oscillator (SO) with a move on Friday that is ahead of the price. There is still a day or two to go before the SO would enter its overbought zone so that might be a reason to expect some additional upside action, but only for a day or so. NORTH AMERICAN GOLD INDICES With five major North American Indices that I follow in rotation each week its not long before we get back to one weve looked at just a few weeks earlier. Today we are back to the AMEX Gold BUGS Index (HUI). The chart shows the full move of the Index since the start of its bull move in 2001. There are a couple of things to note from this chart. Long time readers to these commentaries may remember my Mervs FAN PRINCIPLE. Here we have an example of a decelerating bearish FAN. The important criteria to address here is the breaking of the third FAN trend line. It looks like that FAN trend line HAS been broken and based upon the Principle, that confirms a bear trend in progress. In reality there is still some significant support zones to overcome, especially around the 275 level, but well just have to see how things develop from here.
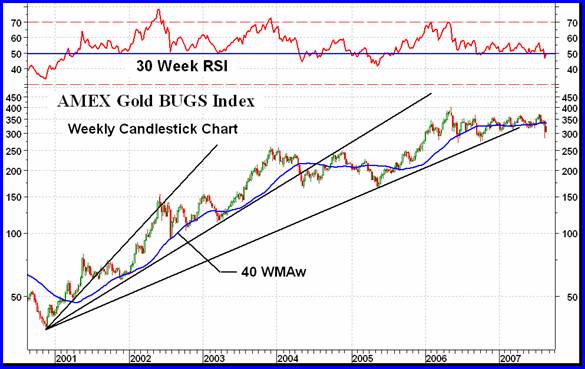
The other interesting feature is the highly compact trading action this Index has presented over the past year and a half. This compact action is most noticeable on semi-log scale charts. Any move to or below the 275 level would have to be seen as a very serious and negative move BREAKING THE COMPACT NATURE OF THE PREVIOUS ACTION. The opposite is also true if the Index happens to move above the 400 level. At the present time I would say that the FAN is in control until verified otherwise, say by a move above 400. MERVS PRECIOUS METALS INDICES Looking over the various precious metals Indices, it was a very good week all around with the FTSE Australasia Index taking the prize with a 12.7% advance. More generally the Indices advanced in the neighborhood of 5 to 6%. Despite such advance nothing much had changed as far as trend is concerned. Both the long term and intermediate term trends are in downward directions. MERVS GOLD & SILVER 160 INDEX With 160 component stocks in this Index, each with an equal weighting towards the Index value calculation, that makes this one of the most accurate Indices to get a feel for what is happening in the world of gold stock investing, speculating and gambling. All of the top gold companies are represented in the Index, in fact I try to maintain the top 100 market capitalized companies in the Index. That leaves 60 companies of a wide variety to represent everything from exploration to production to thinking about exploration type of companies. How goes the 160 universe is very likely how goes the industry in general. The average stock in this universe of 160 gained 5.5% on the week. This represented companies that lost 17% on the week and companies that gained 53% on the week, but the overall average of these 160 was a gain of 5.5%. The number of stocks advancing versus declining was not quite the reverse of last week but still a very good ratio with 108 advancers (68%) and 50 decliners (31%). With such a good week one might have expected the ratings of the various time periods to improve dramatically. Wrong. The summation of individual stock ratings did improve for all three time periods but only a little, and without changing the bearishness. On the short term we now have a rating of BEAR 78% (bear 94% last week). On the intermediate term the rating was BEAR 83% (bear 92% last week). For the long term we are at BEAR 82% (bear 89% last week). We still need a few more good weeks to turn these ratings around into the bull. In the mean time what this tells us is that the one week bounce is not yet convincing as far as turning around the basic bearish trends. From the standpoint of the charts, both the intermediate and long term are still in negative territory as far as both the moving average and momentum are concerned. Both time periods must still be considered as BEARISH at this time. More positive work is required. MERVS QUAL-GOLD INDEX MERVS SPEC-GOLD INDEX MERVS GAMB-GOLD INDEX What we see in the sector information is the story of quality taking the lead and the speculatives falling behind. This indicates a market not yet comfortable on the buy side. The Qual-Gold Index advanced by 6.6% while the Spec-Gold Index advanced by only 2.5%. The 4.6% advance made by the Gamb-Gold Index was helped by one stock in the Index which gained 53% on the week and by its gain pushed the Index up by almost 2%. Taking this single stock out of the list would have brought the Gamb-Gold Index into the same level as the Spec-Gold Index. When the money flow is towards the quality the participants show a lack of conviction of the up trend. Further to the quality advance mentioned above, 100% of the component stocks in the Qual-Gold Index advanced during the week while only 67% of the Spec-Gold and 57% of the Gamb-Gold component stocks advanced. The summation of individual stock ratings shows the short term Qual-Gold rating now at NEUTRAL, not quite bullish. All other ratings are still deep in the BEAR category so that the actions during the week has not changed the overall ratings much. Looking at the charts and indicators, nothing much has changed here either. All time periods are still in the BEARISH category with negative moving averages and momentum indicators. SILVER 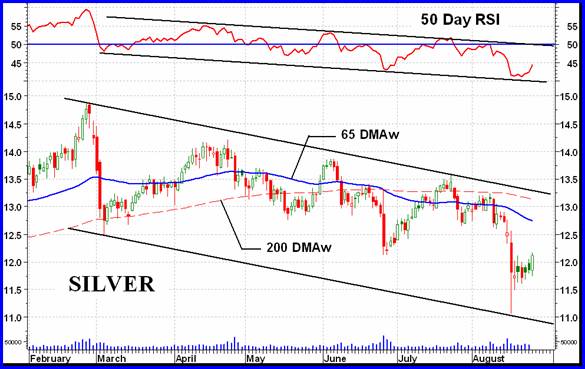 Unlike the intermediate term gold chart shown earlier the silver chart is very disappointing. While we have a divergent trend in gold with the price trending higher while the momentum is trending lower, in silver BOTH are trending lower. This week, during a good up week in the precious metals, silver was still a noticeable laggard. Other than the slope of the overall trend this difference is also noticeable in the different direction of the moving averages between gold and silver, the gold averages are still positive while the silver averages are negative. How long this divergence between the performances of the two will last is an unknown but at some point they should get back to acting in unison. MERVS QUAL-SILVER INDEX MERVS SPEC-SILVER INDEX Despite the general weakness in silver versus gold, silver gained slightly more than gold during the week resulting is about an equal performance of the respective Silver Indices versus Gold Indices. Nothing in the stock trends has changed with the summation of individual stock ratings improving but still staying in their BEARISH location. All three time periods for both Indices are well over the 80% BEAR level, except for the short term Qual-Silver which is at a BEAR 65% level. Much more work is required to get these Indices into the bullish range. Mervs Precious Metals Indices Table  Well, I guess Ill call it another week. Merv Burak, CMT Hudson Aero/Systems Inc. Technical Information Group for Mervs Precious Metals Central 26 August 2007 During the day Merv practices his engineering profession as a Consulting Aerospace Engineer. Once the sun goes down and night descends upon the earth Merv dons his other hat as a Chartered Market Technician (CMT) and tries to decipher whats going on in the securities markets. As an underground surveyor in the gold mines of Canadas Northwest Territories in his youth, Merv has a soft spot for the gold industry and has developed several Gold Indices reflecting different aspects of the industry. As a basically lazy individual Mervs driving focus is to KEEP IT SIMPLE. To find out more about Mervs various Gold Indices and component stocks, please visit www.themarkettraders.com and click on Mervs Precious Metals Central. There you will find samples of the Indices and their component stocks plus other publications of interest to gold investors. While at the themarkettraders.com web site please take the time to check out the Energy Central site and the various Mervs Energy Tables for the most comprehensive survey of energy stocks on the internet. Before you invest, Always check your market timing with a Qualified Professional Market Technician
-- Posted Monday, 27 August 2007 | Digg This Article
Previous Articles
|


