Is Gold Price Action Warning Of Imminent Monetary Collapse Part 2?
-- Published: Wednesday, 29 July 2020 | Print | Disqus
Hubert Moolman
The following is an update of a previous article:
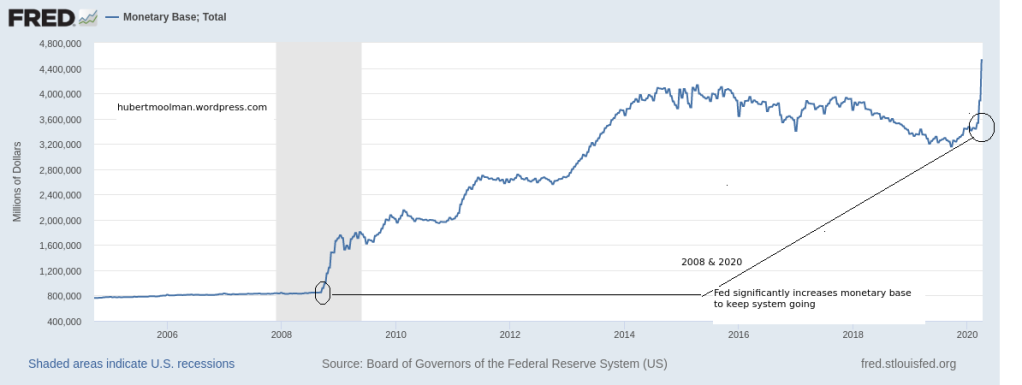
During the 2008 financial crisis the Fed significantly increased the US monetary base to keep the system from collapse. They are currently in a similar situation, and have done (is doing) the exact same thing.
Here is a chart of the US monetary base to illustrate the similarity:
With the 2008 actions they were able to avoid the collapse until now. Will the current actions yield the same results, or will we see a completely different outcome?
One thing to look at for this answer is Gold (probably one of the most important things).
So, when the Fed increased the monetary base of the US significantly in 2008, it took Gold prices quite a long time to show price increases to catch up with the monetary base. Then, the Fed doubled the monetary base in a period of about four months. However, from around the same time the Gold price took almost three years to double, thereby only catching up very late in the game.
Gold was not crying system collapse, and rightly so.
That shows that there was still a decent amount of faith and resource in the monetary system to be able to continue.
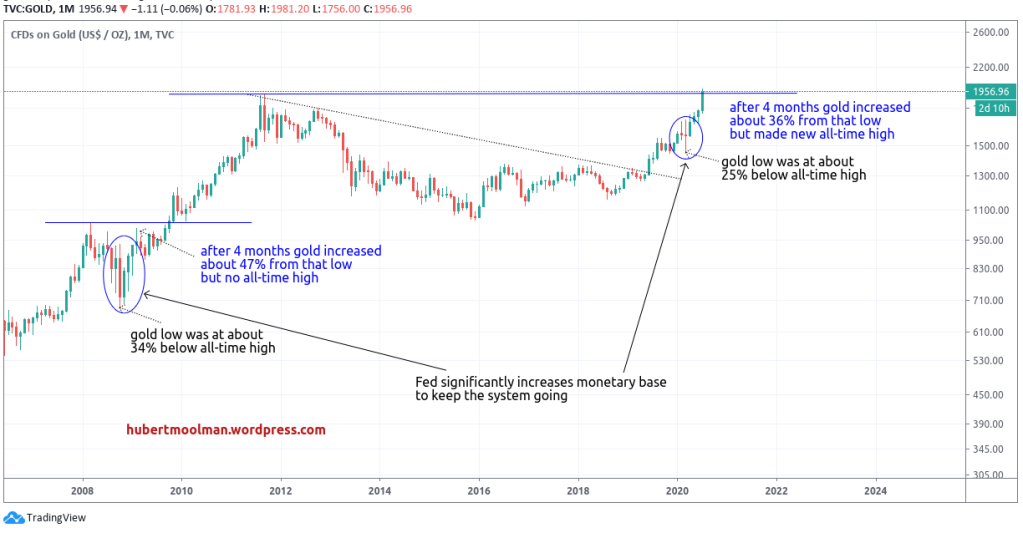
The current increase in the monetary base only just stopped short of doubling the monetary base in a period of about four months. Below, is a chart of gold to see how gold reacted then and now:
At around the 2008 financial crisis (during the significant monetary base increase) gold fell to a low of about 34% below the then all-time high. After about 4 months gold increased about 47% from that low, but did not make a new all-time high.
The new all-time high only came about 13 months after the low of the crisis.
During the current crisis ( after the significant monetary base increase) gold fell to a low of a about 25% below the all-time high. It is also important to note that the fall to the low was percentage wise much lower than that of the 2008 crisis (indicating gold being much more resilient this time).
After about 4 months from the low, gold increased about 36%, which is lower than the 2008 increase. However, it did make a new-all time high this time (also there are still a few days left in this month).
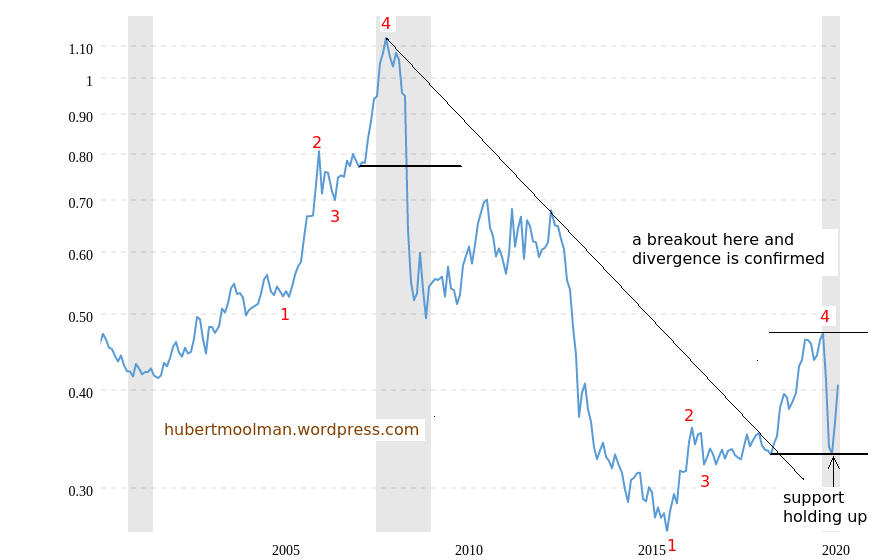
Here is a chart that tracks the Gold price relative to the US monetary base (Gold price/US monetary base in millions):
Point 4 in 2008 is where the Fed increased the monetary base significantly. The eventual massive decline to lower than point 1, shows that the Gold price did not keep up with the US monetary base.
So, although Gold was going up during that same period, it was not warning of system collapse. There were two other periods in history that similar situations occurred, but gold actually was warning of a system collapse (or system bank run, if you will)
Those times were in 1933 and 1971, and you can read more about those (and the above chart)here. Both of those occasions resulted in a system reset.
In the chart above, there are two patterns marked out (1 to 4). The current pattern appears to follow the earlier pattern. If the similarity continues, then there is a good chance that the outcome of the current crisis will be like the 2008 one.
If there happens to be divergence from the earlier pattern, and Gold outruns the monetary base increase (by the chart going higher than point 4 over the coming months), then we are likely to see a radically different (and worse) outcome to the 2008 financial crisis.
Since the previous update, it appears that a divergence could be developing. It still has not gone higher than point 4, to confirm the divergence, but there are signs of it possibly happening over the coming months.
During the 2008 crisis, the ratio was unable to hold support just lower than point 2 (but higher than point 3). Currently the support at point 2 (but higher than point 3) appears to be holding, and we have seen a nice turnaround since the low.
With a new stimulus package coming, but gold looking very bullish, it will be interesting to see what will happen. To me it looks like the ratio could rise above point 4 soon, signaling a huge monetary (banking) crisis.
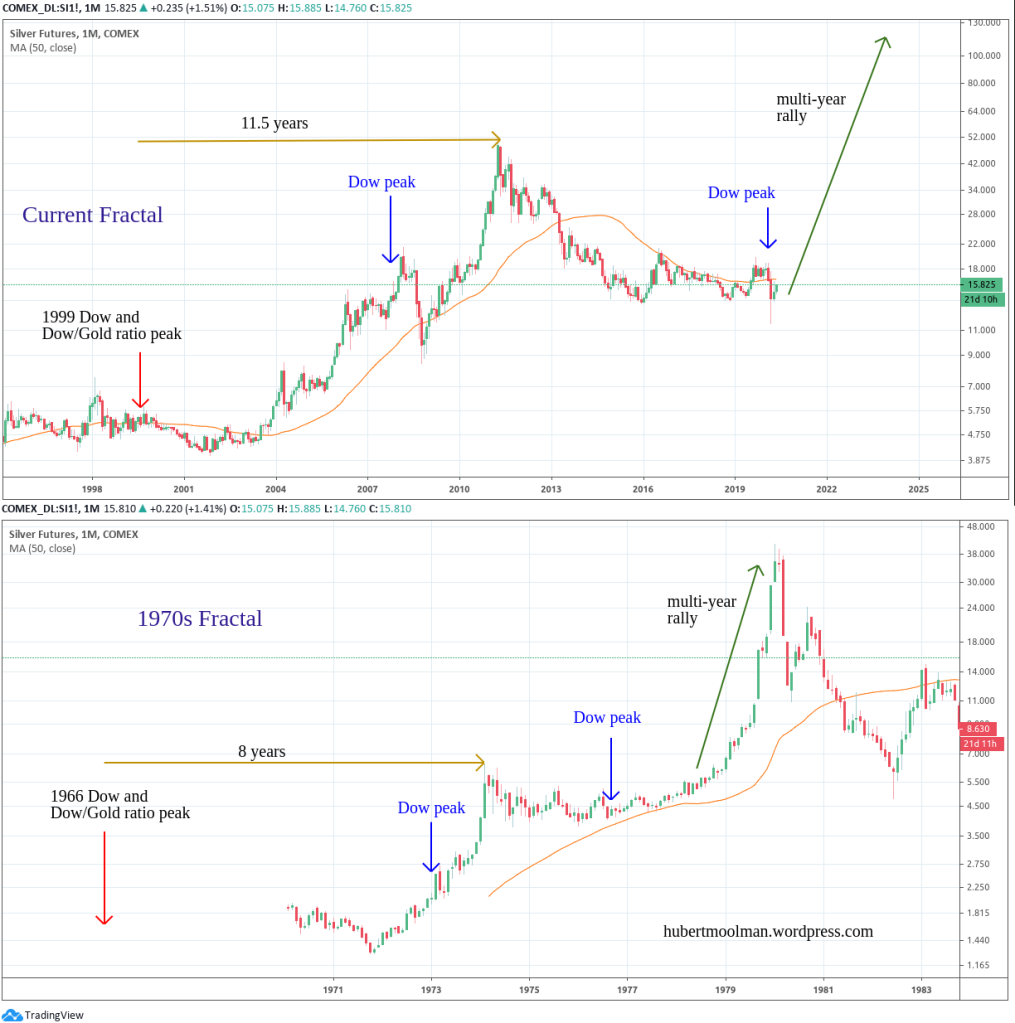
Silver is another important reason why the current financial crisis will be far worse than 2008. This silver chart is warning of a late 70s rally rather than a 2008 to 2011 kind of rally:
The content on this site is protected
by U.S. and international copyright laws and is the property of GoldSeek.com
and/or the providers of the content under license. By "content" we mean any
information, mode of expression, or other materials and services found on GoldSeek.com.
This includes editorials, news, our writings, graphics, and any and all other
features found on the site. Please contact
us for any further information.
Live GoldSeek Visitor Map | Disclaimer
The views contained here may not represent the views of GoldSeek.com, Gold Seek LLC, its affiliates or advertisers. GoldSeek.com, Gold Seek LLC makes no representation, warranty or guarantee as to the accuracy
or completeness of the information (including news, editorials, prices, statistics,
analyses and the like) provided through its service. Any copying, reproduction
and/or redistribution of any of the documents, data, content or materials contained
on or within this website, without the express written consent of GoldSeek.com, Gold Seek LLC,
is strictly prohibited. In no event shall GoldSeek.com, Gold Seek LLC or its affiliates be
liable to any person for any decision made or action taken in reliance upon
the information provided herein.