-- Posted Thursday, 3 January 2008 | Digg This Article | Source: GoldSeek.com
By Gary Dorsch, Editor, Global Money Trends
A trend in motion, will stay in motion, until some major outside force, knocks it off its course. After gyrating within a sideways trading range over the past 18-months, the Commodity Super Cycle, measured by the Dow Jones-AIG Commodity Index, (DJCI), resumed its upward course in the second half or 2007. Led by the agricultural, energy, and precious metal sectors, the DJCI closed at an all-time high.
According to famed hedge-fund trader Jimmy Rogers, the 20th century has seen three secular bull-markets in commodities from 1906-1923, and from 1933-1955, and 1968-1982, spanning an average of 15-years. The current bull market for the DJCI is now six-years old, and Mr Rodgers thinks the Commodity Super Cycle has many more years to run, albeit with some nasty corrections along the way.
The latest commodities boom began at the end of 2001, when Chinas industrial revolution was just starting. Chinas voracious appetite for raw materials for its industrialization has made it the #1 consumer of copper, steel, and iron ore in the world, consuming more of theses metals than the United States and Japan combined, and ranking #2 in consumption of oil and energy products. And Chinas population of 1.3 billion has become the worlds #1 consumer of soybeans.
Evidence of an impressive bull-run is stacking up, with crude oil surging 60% to $96 per barrel in 2007, and tripling since late 2003. Platinum climbed 34% to an all-time record high of $1,550 /oz, and if the worlds 500 million cars were fitted with fuel cells, the worlds platinum supply would be exhausted in 15-years. Copper was a laggard, with a 10% gain, but is still five times higher since 2003, hitting a record $8,800 /ton in 2006, while lead and tin are now at historic highs.
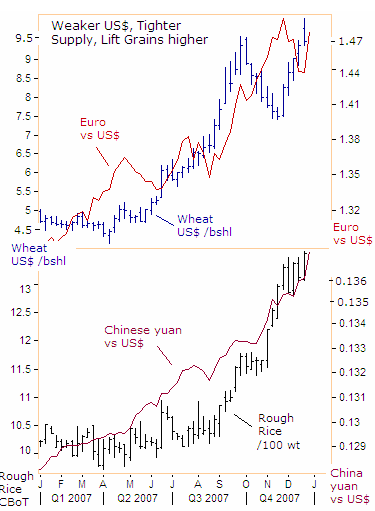
Agricultural commodities joined the party in 2007, with wheat futures in Chicago climbing +77%, as global demand outpaced supply, soybeans up +79%, corn up +16%, and rice futures were up +35 percent. A weaker US dollar makes American grain prices less expensive to buyers abroad, and US wheat exporters already have sold more than 90% of the 1.18 billion bushels the US Department of Agriculture expects will be exported during the whole marketing year, which ends in June 2008.
Rough rice futures in Chicago soared to all-time highs, led by strong export demand and weather-related Asian crop shortages in India, the worlds second-largest rice exporter, and in Vietnam, the third-largest shipper. Global rice supplies fell 6.5% in the fourth quarter alone to 72.1 million tons, and according to latest estimates, supplies are headed down to 50 million tons, the lowest level since 1983-84.
Food prices are 18% higher in China from a year ago, and the Communist kingpins in Beijing, fear that runaway inflation could ignite social unrest. The price of pork, which forms the core of most Chinese diets, was up a staggering 56%. Were facing a grave situation, said Ma Kai, the countrys top planner. China has a fifth of the worlds population, with 1.3 billion people using 7% of the worlds farmland.
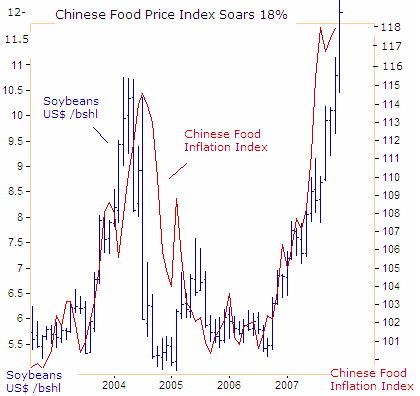
Zheng Guogan, head of the State Meteorological Administration forecasts global warming will cut Chinas annual grain harvest by up to 10 percent. That would mean about 50 million tons less grain in the current tight supply situation and a potential for further food inflation in world markets. Given the tightened food supply in the international market, a decline in domestic grain production could lead to more price hikes, said Song Tingmin, VP of the China National Association of Grain.
The US Department of Agriculture has also cut its estimate of world wheat stocks for 2007-08 to 112.4 million tons, a 30-year low. If sustained, sharply higher wheat prices will eventually work their way into the grocery aisle for bread, cereal, cookies and other products. Fearing a further rise in prices, India, Pakistan, Egypt, Morocco, Algeria, Indonesia and Iraq have all booked large cargoes of wheat.
And its not just the Feds weak US dollar policy that is driving up agricultural prices to record highs these days. Growing Bio-fuel demand has pushed up corn and soybean prices, and creating a linkage with crude oil. Furthermore, the cost of transporting dry goods such as coal, iron ore, and grains overseas, as measured by the Baltic Dry Index, have doubled from a year ago. Higher transportations costs, by land or by sea, are expected to be eventually passed along to the final consumer.
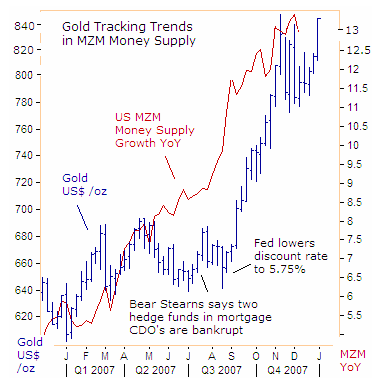
Riding on the wings of the Commodity Super Cycle and global inflation was the glittering Gold market, up 32% in 2007. Gold was energized by reckless central bankers and the explosive growth of the worlds money supply. In Australia, the M3 money supply rose 20.7% from a year ago, Brazils M3 +17%, Canadas M3 +12.9%, Chinas M2 +18.5%, the Euro zones M3 +12.3%, Hong Kongs M3 +31.5%, Indias M3 +21.5%, and the USAs M3 +15.8%, a 47-year high.
Chinese and Indian Imports fuel Commodity Super Cycle
Maybe, the longevity of the Commodity Super Cycle, boils down to one simple equation. According to the latest population count by the United Nations, the world had 6.5 billion inhabitants in 2005, 380 million more than in 2000, or an annual gain of 76 million persons. By 2050, the world is expected to house 9.1 billion persons, assuming declining fertility rates. So a world of finite raw materials, along with an increasing population base, translates into higher commodity prices. China and India house one-third of the worlds population with 2.3 billion inhabitants.
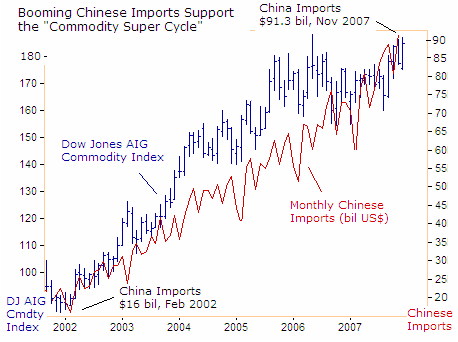
In an ironic twist, China has become a victim of its own phenomenal success. Chinas economy expanded at a blistering 11.5% last year, but was plagued with a 7% inflation rate, largely linked to the countrys voracious appetite for global commodities. Chinas imports climbed 20.5% to $865.5 billion in the first 11-months of 2007, from the year earlier period, and Chinese demand effectively put a floor under the DJCI, whenever panicky commodity traders in London, New York, Tokyo, or Shanghai got the urge to turn paper profits into cash.
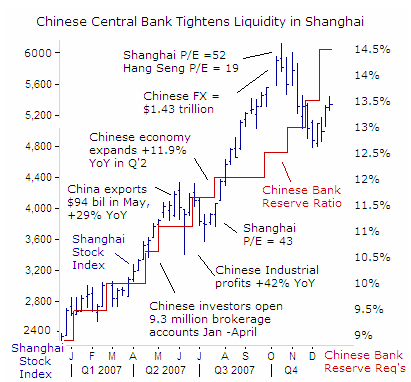
To combat consumer inflation, the Peoples Bank of China (PBoC) has tightened its monetary policy, ordering banks to set aside 14.5% of their deposits as reserves, an all-time high. The PBoC also raised bank lending rates five times to 7.47%, and announced a special bond sale of 750 billion yuan to drain cash from the financial system. The latest tightening moves took some steam out of the Shanghai stock index, which still ended 97% higher last year, the worlds gold medal winner.
Then on Dec 27th, Chinas central bank signaled it would allow the yuan to appreciate faster in 2008, in a move designed to lower the cost of dollar denominated commodities imported from overseas. Yao Jingyuan, chief economist of the state statistics agency, explained, The weakening dollar and rising global commodity prices would create inflationary pressures for China next year, but a quicker appreciation of the yuan would probably help offset some of those price increases.
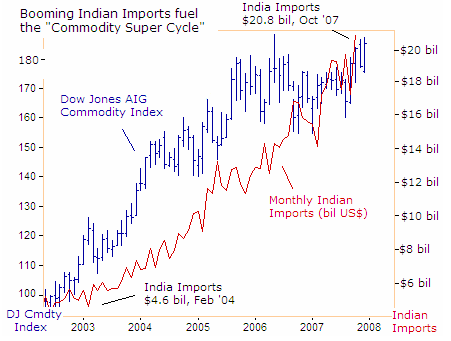
But a stronger yuan vs the US$ will also boost Chinas purchasing power abroad, and could exert more upward pressure on commodity prices worldwide. And China must compete with India, the worlds second fastest growing economy, with one billion consumers for global commodities. Indias imports rose to $20.8 billion in October, up from $4.6 billion in February 2004, also supporting the commodity markets.
Interestingly enough, India could face a supply shortfall of about 4-million tons of rice in 2008, threatening to turn the worlds largest exporter of rice into a net importer. With tight supplies of wheat this year, Indian demand for rice could grow to 96 million tons or higher, and above the rice crop of 92 million tons last year. India is also Asias third-largest oil consumer, and imported 9.25 million tons of crude oil in November, or 2.8 mil barrels per day, up 6.5% from a year ago.
Bernanke Fed Re-Ignites Commodity Super Cycle in 2007
For 24-months until June 2006, the Federal Reserve embarked on a long, but predictable road of lifting short-term US interest rates, to reach an unknown neutral rate, that would neither stimulate nor weaken the US economy. The Fed was also tracking the Commodity Super Cycle and appeared to have finally gotten ahead of the inflation curve with its last rate hike to 5.25% in June 2006.
The Fed will be vigilant to ensure that the recent pattern of elevated monthly core inflation readings is not sustained, declared Fed chief Ben B-52 Bernanke at the International Monetary Conference on June 6, 2006. The Fed must continue to resist any tendency for increases in energy and commodity prices to become permanently embedded in core inflation, he said, telegraphing the last rate hike to 5.25%.
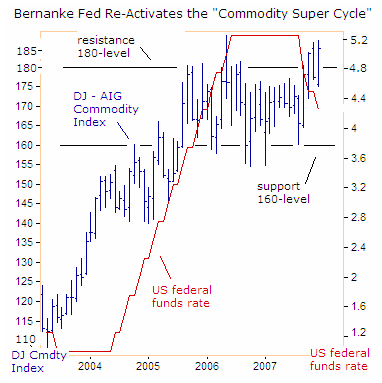
The 2-year cycle of Fed rate hikes was the longest in a quarter of a century, and finally put a dent in the Commodity Super Cycle. Crude oil tumbled $30 per barrel, and gold fell $160 /oz in the second half of 2006. The Fed had finally corralled the Commodity Super Cycle, and put the fed funds rate on ice for 15-months. The Fed relied on other G-20 central banks to tighten their monetary policies to keep the Commodity Super Cycle, in check, while it sat on the sidelines.
However, other G-20 central banks were reluctant to tighten their money spigots, and only lifted their lending rates in tiny baby-steps, that failed to rein-in double digit credit and money supply growth. Central bankers were clandestinely inflating their economies to prosperity, by pumping up stock markets with monetary steroids, and in turn, hoping to bolster consumer confidence and spending.
However, the bursting the $1.8 trillion sub-prime credit bubble in the summer of 2007, rattled the Bernanke Fed into a series of rate cuts totaling 1% to 4.25%. The Feds aggressive rate cutting campaign knocked the US dollar index to 20-year lows, and ignited the fastest money supply growth in 47-years, with US M3 hitting an annualized 16% in November, while the narrower MZM money supply soared to +12.8% higher from a year earlier.
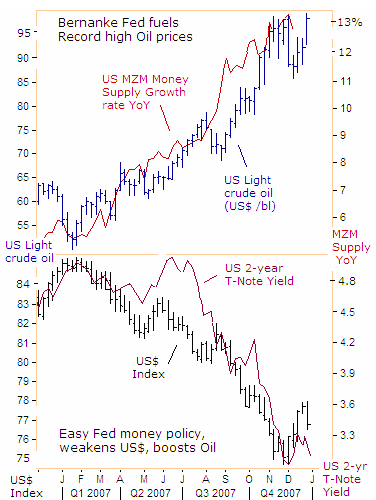
Because most international commodities are traded in US dollars, the Fed must defend the value of the US dollar in the foreign exchange market, with higher interest rates if necessary, to keep the Commodity Super Cycle in check. But with the Fed moving in the opposite direction, and slashing the fed funds rate to 4.25%, the US central bank let the inflation genie out of its bottle, awakening the Commodity Super Cycle from its 18-month siesta.
Thus, the finger of blame for global inflation points to the Bernanke Fed and the US Treasury, for engineering the devaluation of the US dollar in the second half of 2007. Traders should only trust the money that flows thru the commodity markets for real time indications of future inflation, and not government statistics, which are manipulated by apparatchniks and adopted as gospel by the mainstream media.
Money supply growth is explosive, at a time when inflation is rearing its ugly head across the globe, led by sharply higher food and energy prices. European and US central bankers are intellectually dishonest about food and energy prices, routinely subtracting the essentials of life from their inflation equations, reckoning that commodity price spikes are self-correcting, due to the laws of gravity, and shouldnt be countered with higher interest rates.
In the US, producer prices were 7.7% higher in November from a year ago, the highest in 34-years. Consumer prices rose at an annual rate of 4.2% through the first 11-months of 2007, the most in 17-years, thanks to soaring food and energy prices. Yet remarkably, federal funds futures traders in Chicago are betting on a quarter-point Fed rate cut to 4.00% on January 30th, to bail out Wall Street bankers from massive losses in sub-prime mortgages, despite dangerously elevated inflation.
Theres a big difference between the way US households and the Fed view inflation. To the average household, food and energy prices are the most closely watched costs. To the Fed, food and energy are subject to cyclical swings and ignored. If inflation expectations are well anchored, changes in energy and food prices should have relatively little influence on core inflation, Fed chief Ben B-52 Bernanke told the National Bureau of Economic Research on July 10th, 2007.
So far, investment banks and brokers have recognized $97 billion of losses, related to the collapse of the $1.8 trillion sub-prime mortgage market. That could just be the tip of the iceberg of bank write downs for 2008. But additional Fed rate cuts could weaken the US dollar, and unleash the fastest rate of inflation and money supply growth that the world has seen in decades, - leading to the Stagflation trap.
European Central Bank fuels Global Inflation
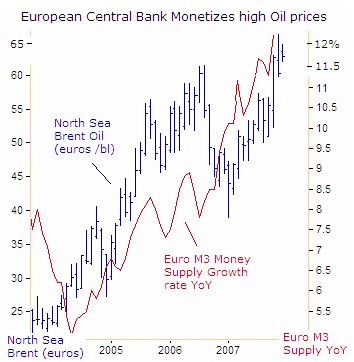
Under the leadership of Jean Tricky Trichet, the European Central Bank has veered far away from its monetarist roots and its original 4.5% growth target for Euro M3. Since Trichet got his hands on the printing presses in November 2003, the Euro M3 money supply has exploded from a 5% growth rate to an annualized 12.3% in October, its fastest in history, lifting the Euro zones inflation rate to a six-year high of 3.1%, and far above the ECBs target of 2%.
Trichet has immunized the Euro zone stock markets from record high oil prices with carefully calibrated dosages of monetary morphine. The ECB engineered an 11% Euro rally against the US dollar in 2007, by running the printing presses at a slightly slower pace than the Bernanke Fed. Still, North Sea Brent crude oil rose to a record 65 euros per barrel, and European wheat futures closed at 248 euros, posting a 68% gain on the Paris-based Euronext exchange.
ECB chief Trichet and his sidekick Bundesbank chief Axel Weber have forgotten the sound advice of the late ECB chief Wim Duisenberg, Trying to use monetary policy to fine-tune economic activity or asset markets, or to gear it above a sustainable level will, in the long run, simply lead to rising inflation - not to faster economic growth, Duisenberg warned on Sept 5, 2003, just before he retired from the ECB.
With Euro zone inflation getting out of control, Trichet and Weber are conducting open-mouth operations thru the media, talking tough and making bold threats, but taking no action to tighten monetary policy. European gold traders have seen through the ECBs propaganda and empty rhetoric, and are bidding 570 euros for an ounce of gold, up 75% from just three years ago.
Writing in Germanys Bild am Sonntag newspaper on Dec 31st, Bundesbank chief Axel Weber said that high energy and food prices would keep inflation elevated through the first half of 2008, but warned European workers not to ask for higher wages to compensate for the higher cost of living. The current, unusually high inflation rates in Germany and the Euro zone must not be the yardstick for the next wage round. A spike in prices as a result of excess wage rises can endanger medium-term price stability. We would act decisively against this, he warned.
Our primary goal is to preserve price stability. We are alert and everybody must know that we will do whatever is needed to deliver price stability in the medium term and be credible in that delivery. The single needle in our compass is price stability, warned ECB chief Trichet on Dec 14th. But alas, the ECBs compass has been broken for three years, with Euro money and credit expanding at double digit rates.
How are we to interpret the ECBs latest riddles, designed to keep commodity and gold speculators off balance. Would the ECB actually hike its repo rate to 4.25% to rein-in its money supply, when other G-7 central bankers in Canada, England, and the US are lowering their lending rates? Thats doubtful. Yet the ECB would look like a hawk, by simply resisting the temptation to follow the rate-cutting Bernanke Fed and the Bank of England, by leaving its repo rate unchanged at 4.00 percent.
Still, the persistence of the current inflation shock entails the serious risk that inflation expectations could become unhinged and our credibility as central bankers could be significantly damaged, Bank of Spain chief Miguel Angel Fernandez Ordonez warned. Spains consumer price index soared to +4.1% in November. We are monitoring the situation very closely, and are permanently alert. Central bankers, even the best ones, cannot prevent an increase of oil prices or other international commodities, said Belgian central banker Guy Quaden on Dec 13th.
Thats music to the ears of global commodity traders, and why the world economy could be headed for hyper-inflation. Central bankers always try to avoid their last big mistake. So every time theres the threat of a contraction in the economy, theyll over stimulate the economy, by printing too much money. The result will be a rising roller coaster of inflation, with each high and low being higher than the preceding one, said Milton Friedman, the late Nobel monetarist.
Inflation is always and everywhere a monetary phenomenon. As the government increases the rate at which it prints money, the result is too much money chasing too few goods and services. Higher wages dont cause inflation, and the whopping oil price increases between 1973 and 1980 didnt cause the stagflation, - a stagnant economy with rising inflation. Rather, the oil price hikes were the form inflation took from rapid money supply growth, Friedman and Anna Schwartz argued.
Gold is a Safe Haven during US Banking Crisis
Nowadays, bankers are so afraid to lend money to each other, that they prefer to park their excess cash in safe haven Treasury bills and notes, even at negative rates of return, after adjusting for inflation. Big banks are reluctant to lend money in the LIBOR market, because of suspicions that borrowers might be holding big undisclosed losses in toxic sub-prime mortgages.
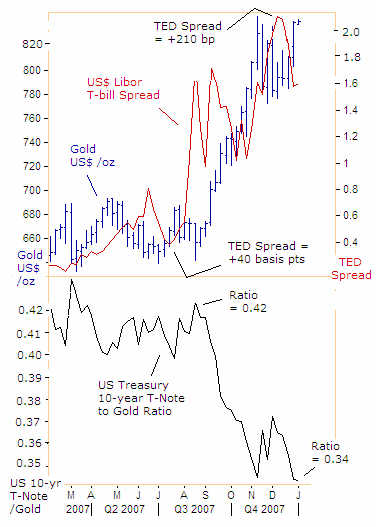
Global banks are also hoarding cash to plug future losses that must be written off their balance sheets in the year ahead. The fear factor in the banking system is measured by the TED spread, which is the difference for yields on US$ Libor rates (ie Eurodollar rates) and for US Treasury bills. Since August, there have been two eruptions in the TED spread that lifted US$ Libor rates to +210 basis points above 3-month Treasury bills rates, the highest since the 1987 stock market crash.
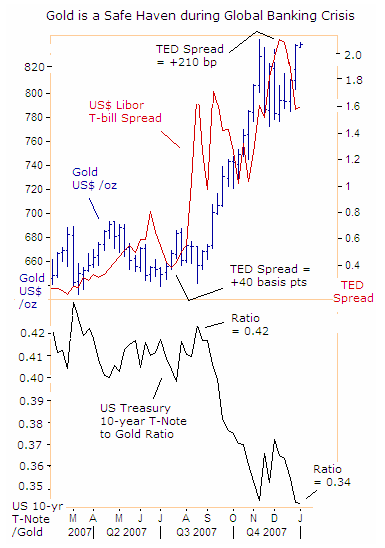
Gold has done a reasonable job of tracking widening credit spreads between Libor rates and Treasury bills, and acting as a safe haven in a time of risk-aversion in the stock markets. Yet the same sophisticated bankers that bought $1.8 trillion of toxic sub-prime mortgages over the past few years are now locking in 10-year bond yields below the inflation rate, even though hyper-inflation might lie on the horizon.
When measured in hard money terms, the US Treasurys 10-year Note lost 20% of its value compared to an ounce of gold since August 2007. Wouldnt it make better sense to park excess cash in gold, rather than US Treasury IOUs, during periods of double-digit money supply growth, and soaring commodities?
To stay on top of volatile markets, subscribe to the Global Money Trends newsletter today, for insightful analysis and predictions for the (1) top stock markets around the world, (2) Commodities such as crude oil, copper, gold, silver, and related gold mining and oil company indexes (3) Foreign currencies (4) Libor interest rates, global bond markets and central bank monetary policies, and (5) Central banker "Jawboning" and Intervention techniques that move markets.
GMT filters important news and information into (1) bullet-point, easy to understand analysis, (2) featuring "Inter-Market Technical Analysis" that visually displays the dynamic inter-relationships between foreign currencies, commodities, interest rates and the stock markets from a dozen key countries around the world. Also included are (3) charts of key economic statistics of foreign countries that move markets.
Subscribers can also listen to bi-weekly Audio Broadcasts, with the latest news on global markets, and view our updated model portfolio for Q1, 2008. To order a subscription to Global Money Trends, click on the hyperlink below,
http://www.sirchartsalot.com/newsletters.php
or call toll free to order, Sunday thru Thursday, 8 am to 9 pm EST, and on Friday 8 am to 5 pm, at 866-553-1007. Outside the US call 561-367-1007. This article may be re-printed on other internet sites for public viewing, with links required to,
http://www.sirchartsalot.com/newsletters.php
Disclaimer: SirChartsAlot.coms analysis and insights are based upon data gathered by it from various sources believed to be reliable, complete and accurate. However, no guarantee is made by SirChartsAlot.com as to the reliability, completeness and accuracy of the data so analyzed. SirChartsAlot.com is in the business of gathering information, analyzing it and disseminating the analysis for informational and educational purposes only. SirChartsAlot.com attempts to analyze trends, not make recommendations. All statements and expressions are the opinion of SirChartsAlot.com and are not meant to be investment advice or solicitation or recommendation to establish market positions. Our opinions are subject to change without notice. SirChartsAlot.com strongly advises readers to conduct thorough research relevant to decisions and verify facts from various independent sources.
Copyright © 2005-2007 SirChartsAlot, Inc. All rights reserved.
-- Posted Thursday, 3 January 2008 | Digg This Article | Source: GoldSeek.com


