-- Posted Monday, 28 February 2011 | | Source: GoldSeek.com
By Toby Connor, GoldScents
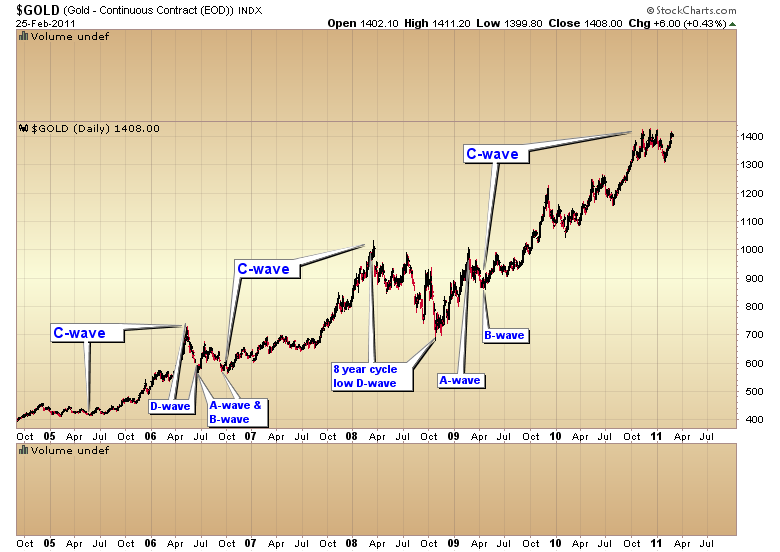
The gold bull is now on the verge of launching the most spectacular up leg of this 10 year bull market. This spring we should see the final parabolic rally of the massive C-wave advance that began in April `09 with a test of the 1980 high at $860.
First off let me explain gold's 4 wave pattern (and no it has nothing to do with Elliot wave). Gold moves in an ABCD wave pattern, driven not only by the fundamentals of the gold market (which I will get into in a minute) but also by the emotions of gold investors and the thin nature of the precious metals market. The A-wave is an advancing wave that begins and is driven by the extremely oversold conditions created during a D-wave decline (more on that in a second). A-waves can often test the all time highs but rarely move above them. Usually they will retrace a good chunk of a D-wave decline.
The B-wave is a corrective wave spawned by the extreme overbought conditions reached at an A-wave top.
The C-wave is where the monster gains are made. They can last up to a year or more. The current C-wave is now almost two years old. They invariably end in a massive parabolic surge as investors and traders chase a huge momentum driven rally. Of course as we all know parabolic rallies are not sustainable. So the final C-wave rally ends up toppling over into a severe D-wave correction as the parabola collapses. This is about the time we hear the conspiracy theorists start crying manipulation. In reality all that has happened is that smart money is taking profits into a move that they know can't be sustained.
Then the entire process begins again.
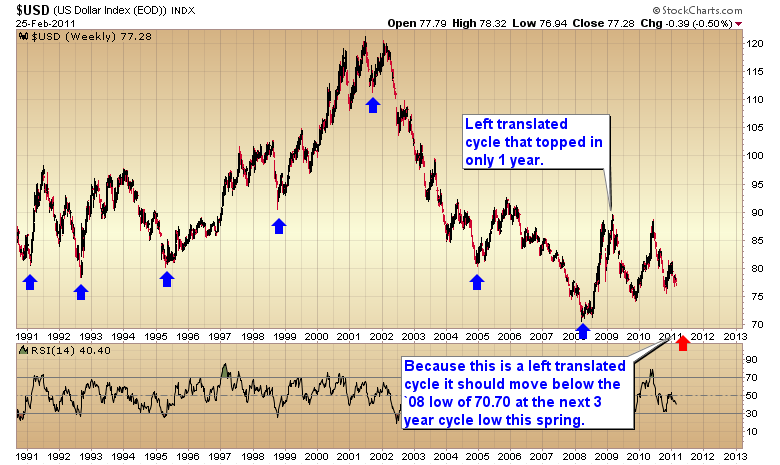
Next, let me show you the fundamental driver of the secular gold bull. It's probably no surprise to most of you that the Fed's ongoing debasement of the dollar is one of the main drivers of this bull. But let me take this one step further and show you how the dollar's three year cycle drives these major C-wave advances and how the move down into the dollar's three year cycle low always drives a final parabolic C-wave rally. Let's begin with a long term chart of the dollar. I've marked the last 7 three year cycle lows with blue arrows. The average duration from trough to trough is about 3 years and 3 months. As you can see the dollar is now moving into the timing band for that major spike down in the next 2 to 3 months.
The extreme left translated nature (topped in less than 18 months) of the current cycle gives high odds that the final low when it arrives will move below the last three year cycle low. That means that sometime between now and the end of May we should see the dollar fall below the March `08 low of 70.70.
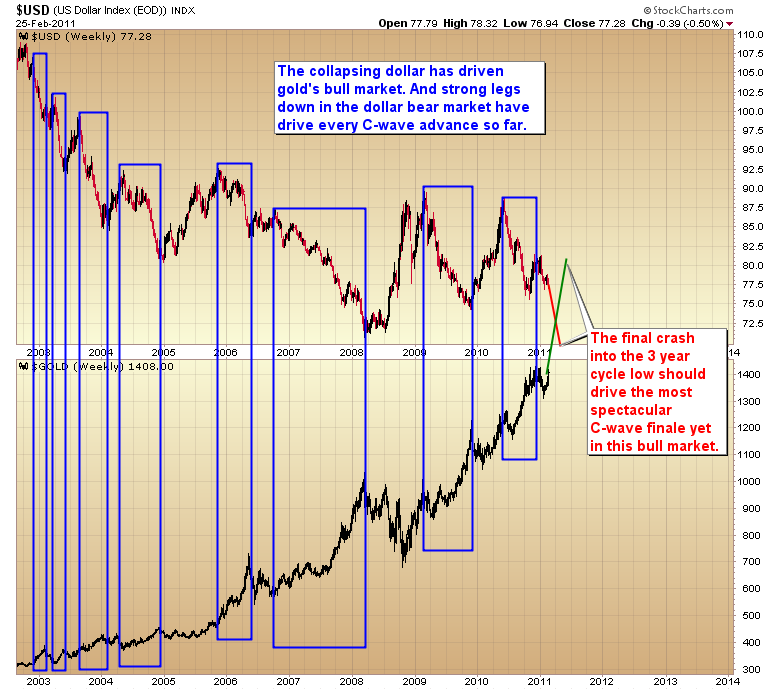
That crash down into the final three year cycle low will drive the final parabolic move up in gold's ongoing C-wave advance. Every major leg down in the dollar has driven a major leg up in gold since the bull began. I really doubt this time will be any different.
I will be watching the dollar over the next couple of months for signs that the three year cycle low has been made. Because once the dollar bottoms and begins the explosive rally that always follows a major three year cycle low it will initiate the severe D-wave correction in the gold market. Gold investors will want to exit at the top of the C-wave if at all possible and avoid getting caught in the D-wave decline.
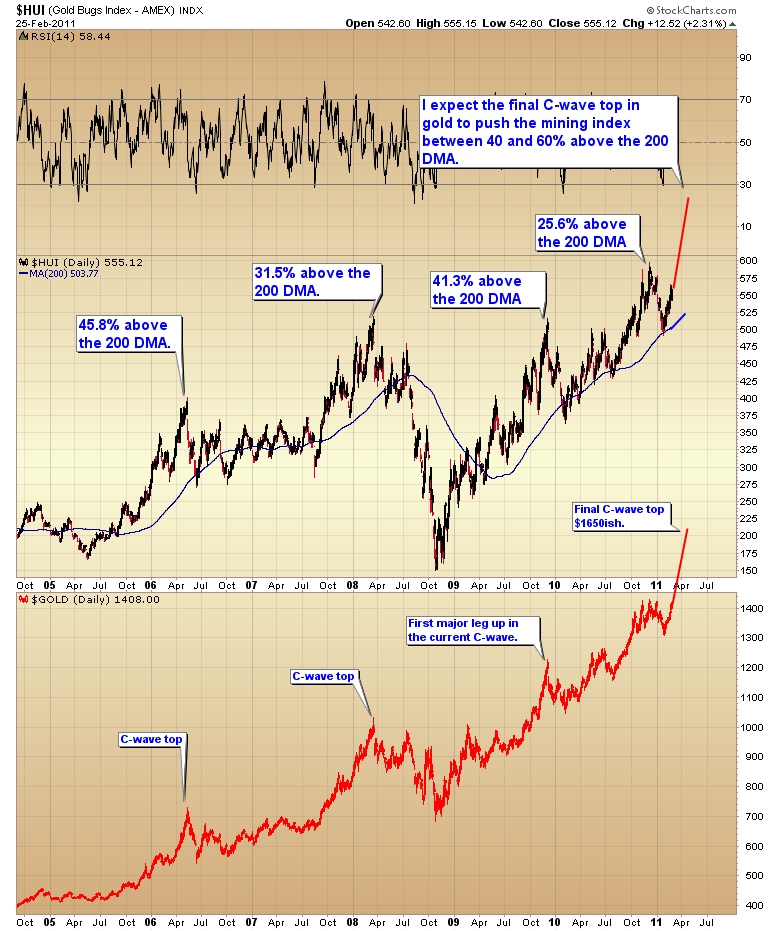
There is a developing pattern on the gold chart that once it reaches its target will be a strong warning for traders and investors to exit so they don't get caught in the D-wave profit taking event as the parabola collapses. This T1 pattern is a four part pattern with the first and second legs up being almost equal in magnitude, separated by a midpoint consolidation that allows the 200 day moving average to "catch up". The current T1 has a target of roughly $1650ish once gold breaks out of the consolidation zone.
The fourth part of the pattern is the D-wave correction which should retrace to test the consolidation zone between $1300 and $1425. At that point the next A-wave will begin and we'll repeat the whole process all over again.
Let me be clear though. I have no desire to buy gold. I doubt I will ever buy another ounce of gold again. The real money will be made in silver during this final C-wave advance and in the miners (I prefer silver miners).
During the last major moves higher in the gold market, miners, which are leveraged to the price of gold, stretched 35% to 45% above the 200 day moving average. At the latest peak the HUI was only 25% above the mean - a strong clue that this was not the final C-wave top.
I expect we will see the HUI stretch 40 to 60% above the 200 DMA at the final top later this spring. But like I said, I really have no desire to buy gold or the major gold miners. The real money is going to be made in silver and silver miners.
Silver has been exhibiting exceptional strength compared to gold for 7 months now. The consolidation on the silver chart is much larger than on the gold or gold miner charts. I expect that massive consolidation to drive silver up to test the old 1980 high of $50 by the time gold puts in its final C-wave top.
The time to get on board is before gold breaks out of the consolidation. Once it does the parabolic move should be underway and your chances of a significant pullback to enter the market will decrease significantly.
I've been helping investors time the gold and silver bull for several years now. If you are the kind of person that needs a coach to keep you focused on the big picture, someone to cut through the meaningless noise of all the myriad top callers and bubble proponents, someone to show you how these long and intermediate term cycles operate so you can actually make money from the gold bull, I have an invaluable offer for you. For those of you that need a coach and want to learn how the gold bull works, I'm going to make available, this week, a special 15 month subscription. For the regular price of one year I will add three free months to your subscription which includes the daily and weekend reports. To take advantage of this offer, clickhere.
Choose a username and password and enter goldscents15 in the promotional code box, then click continue. You will be taken to a page with the 15 month offer. Now is the time to act before the bull comes roaring out of the gates and the golden fireworks begin.
GoldScents is a financial blog focused on the analysis of the stock market and the secular gold bull market.Subscriptions to the premium service includes a daily and weekend market update emailed to subscribers.If you would like to be added to the email list that receives notice of new posts to GoldScents, or have questions, email Toby.
The content on this site is protected
by U.S. and international copyright laws and is the property of GoldSeek.com
and/or the providers of the content under license. By "content" we mean any
information, mode of expression, or other materials and services found on GoldSeek.com.
This includes editorials, news, our writings, graphics, and any and all other
features found on the site. Please contact
us for any further information.
Live GoldSeek Visitor Map | Disclaimer
The views contained here may not represent the views of GoldSeek.com, Gold Seek LLC, its affiliates or advertisers. GoldSeek.com, Gold Seek LLC makes no representation, warranty or guarantee as to the accuracy
or completeness of the information (including news, editorials, prices, statistics,
analyses and the like) provided through its service. Any copying, reproduction
and/or redistribution of any of the documents, data, content or materials contained
on or within this website, without the express written consent of GoldSeek.com, Gold Seek LLC,
is strictly prohibited. In no event shall GoldSeek.com, Gold Seek LLC or its affiliates be
liable to any person for any decision made or action taken in reliance upon
the information provided herein.


