-- Posted Thursday, 14 April 2011 | | Source: GoldSeek.com
By Justin Smyth
The slogan the trend is your friend was created for a reason. People tend to agree more often than disagree with their friends. Aligning yourself with the long term trend means you are choosing to agree with the wisdom of the market. Good friends typically help each other out too, and when you trade with the trend you let the market help you choose the correct direction to align your long term investments with.
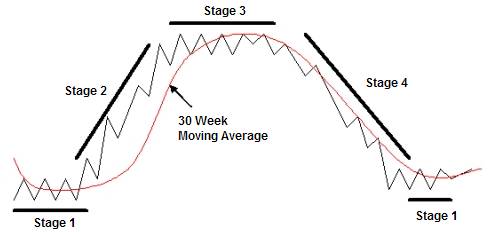
Theres numerous trend following strategies, but one of my favorites is Stage Analysis. The strategy was developed by Stan Weinstein and discussed in the outstanding book Secrets for Profiting in Bull and Bear Markets. The beauty of Stage Analysis is its simplicity. In Stage Analysis the market can be in one of four stages: Stage 1 the bottoming or basing stage, Stage 2 the advancing stage, Stage 3 the consolidating or topping stage, and Stage 4 the declining stage. The weekly price and its relationship to the 30-week moving average determine the stage. In this article Im going to focus on Stage 2 and Stage 4, which are the trending stages in Stage Analysis. A Stage 2 advance is defined as a rising weekly price which occurs mostly above a rising 30-week moving average. Stage 4 is defined as a falling weekly price which occurs mostly below a falling 30-week moving average.

Source: Secrets for Profiting In Bull and Bear Markets By Stan Weinstein
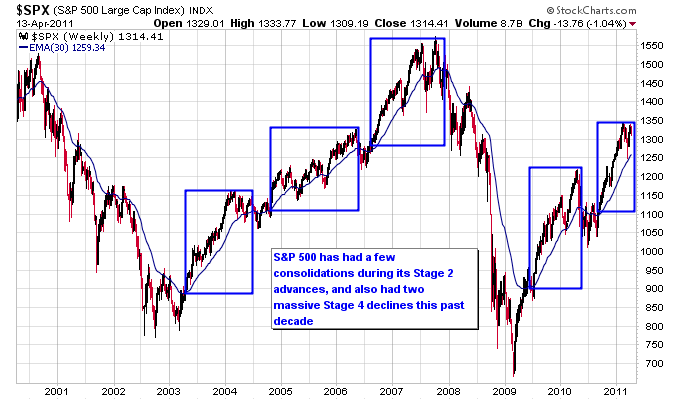
Lets look at the stock market using Stage Analysis first. The chart below shows the S&P 500 over the last decade. The regions marked with rectangles on the chart denote where the S&P 500 was in a Stage 2 advance. Over the past 10 years the S&P 500 has had two periods where it made Stage 2 advances, from 2003-2007 and from 2009 until now. During each of those periods the market had a few significant consolidations which temporarily interrupted the Stage 2 advances. Those are the periods between the rectangles on the chart. An important thing to note on this chart is the massive Stage 4 declines that have occurred for the stock market during this decade as well, from 2000-2002 and 2008-2009. The 2008-2009 Stage 4 decline in particular wiped out all the gains made during the 2003-2007 advance, and has contributed to the range bound stock market we have witnessed this past decade.

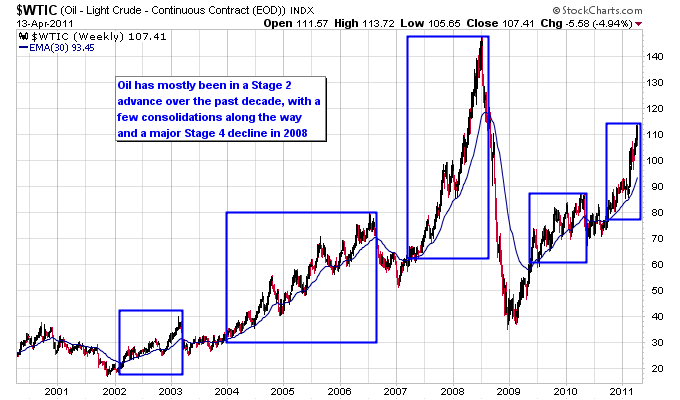
The next chart shows the Stage 2 advances over the past decade for oil. Oils Stage 2 advances have occurred during roughly the same time frame as the S&P 500, except oil topped later in 2008 than the stock market. Oil suffered a massive Stage 4 decline in 2008 as well, but unlike the S&P 500, oil only returned to its 2005 lows in 2008 instead of going all the way below its 2002 lows. In general by looking at the area covered by the rectangles on the chart oil has been trending higher more often than the stock market over the past decade.

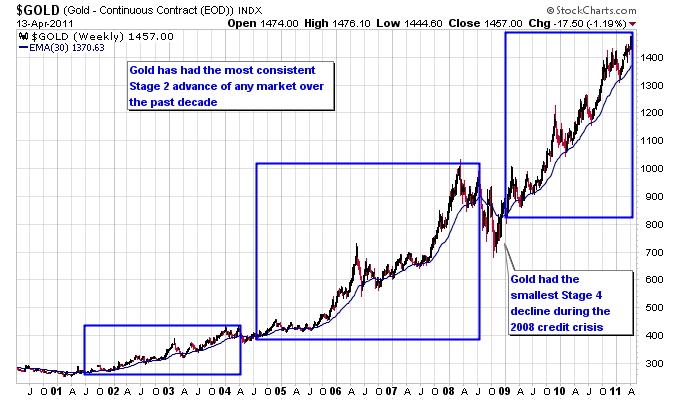
Gold has had the most consistent and steady long term trend higher over the past 10 years as shown on the next chart. Gold had the shortest Stage 4 decline in 2008, and resumed its Stage 2 advance after that decline quicker than other markets. For a trend following market it couldnt get any better than gold over the past decade.

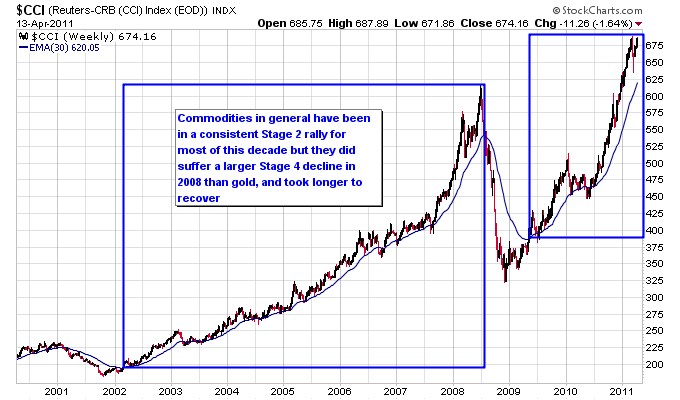
Commodities as a whole have also had a very consistent long term trend higher over the past decade. If it werent for the massive Stage 4 decline commodities had in 2008, that was larger than the decline in gold, commodities would have been just as consistent overall as gold.

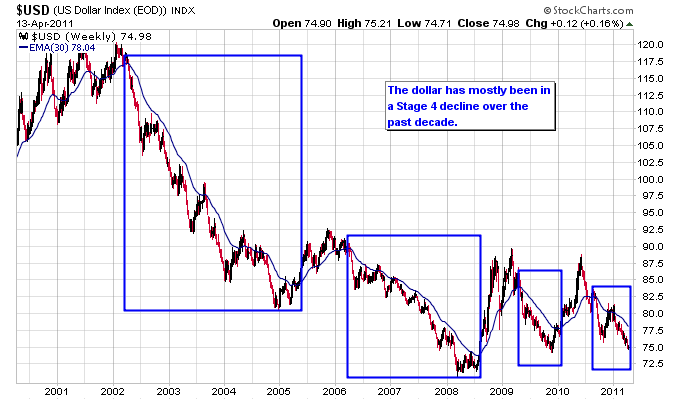
The dollar has mostly experienced Stage 4 declines over the past decade. On the chart below the rectangular regions highlight four distinct Stage 4 declines in the dollar, including the current Stage 4 decline. The only advancing periods for the dollar over the past decade came during three periods. The first was in 2005 when the dollar bounced after undergoing a massive downleg starting in 2002. And the other two periods came during two separate crises, the first being the financial crisis in 2008 and the second being the Euro crisis in 2010. Besides these brief rallies, as clearly shown on the chart the dollar has most often been in a period of decline over the past decade.

Trend following systems, whether they are Stage Analysis or another system, can provide a simple and powerful way to identify long term market trends. As demonstrated above gold has been the most consistent long term trend higher over the past decade, and coming in a close second is the commodities sector in general. The stock market has had two major trends higher, but only after two major trends lower, which has overall produced a sideways market if you look at it over a ten year period. And the dollar has been in a general decline over the past decade, with only brief countertrend rallies when looking at the overall period.
Justin Smyth
http://www.nextbigtrade.com/
-- Posted Thursday, 14 April 2011 | Digg This Article | Source: GoldSeek.com


