-- Posted Monday, 25 April 2011 | | Source: GoldSeek.com
Charts speak more eloquently than I can and they speak a brutal truth. Perhaps it is my scientific background or perhaps I appreciate the art that can be found in price charts. In either case, I prefer the message of charts to CNBC blowhards and other so-called experts.
Anyone who currently has excess savings they want to invest is in the minority of the world's population. They are also likely "rich" and "evil" according to populist sentiment. In any case, these aren't the best of times for advanced/Western economies.
We are currently in the midst of an unmistakable secular bear market for general equities in the United States. Such bear markets don't end with the current obscene valuations and they don't end because government saves the day. If it were only true, writing everyone a check for $700 billion dollars (i.e. treating everyone like a Wall Street bank) would bring endless prosperity and create an endless bull market.
The piper waits patiently, knowing that he will be paid. Currency debasement and allowing survival of the most unfit is not the way to restore a secular bull market. Ask Japan how QE1, QE2, and QE3 helped their stock market for the long haul.
Speaking of Japan, do you realize that we are on a similar course when stock markets are priced in Gold? I am not saying deflation or inflation, I am saying "priced in Gold." Only Gold bulls are used to such pricing strategies, but it is time for reality to intrude on the paperbug world.
Whatever monetary chaos we are in store for, Gold will outperform stocks over the next several years. This is open for debate in my mind as much as the question of whether fiat money will retain its value over the next decade is open for debate. Believe what you will.
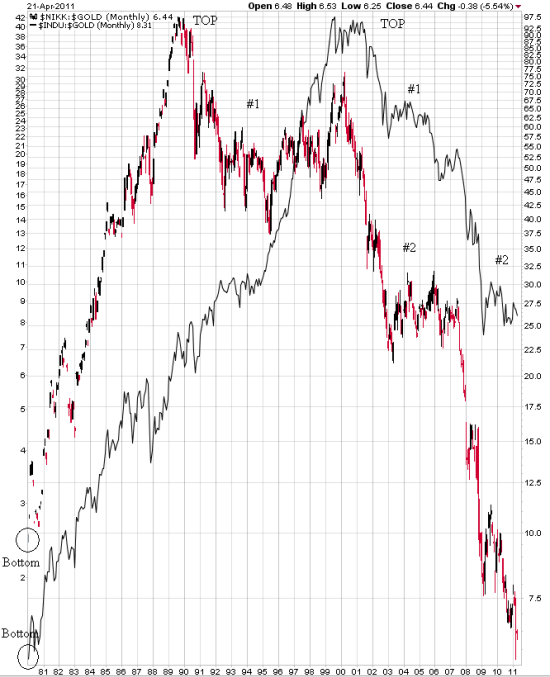
But notice the "phase shift" chart message between Japan and the USA shown below. The chart is a monthly log scale chart of the Nikkei stock index ($NIKK, the main Japanese stock index) divided by the price of Gold ($NIKK:$GOLD), shown in a black and red candlestick format, versus the Dow to Gold ratio ($INDU:$GOLD), shown in a black line format:
Same chart with a phase shift, no? The corrections in this ratio lasted longer for Japan because they entered their secular depression when everyone else's economy was booming. We don't have that luxury, so our corrections in the Dow to Gold ratio have been shorter. We are about to begin the biggest leg down in this ratio since the "secular bear market" in this ratio began in 1999. This is not a drill and this is not a call for the end of the world. Be careful out there if you're not in the precious metals sector.
The content on this site is protected
by U.S. and international copyright laws and is the property of GoldSeek.com
and/or the providers of the content under license. By "content" we mean any
information, mode of expression, or other materials and services found on GoldSeek.com.
This includes editorials, news, our writings, graphics, and any and all other
features found on the site. Please contact
us for any further information.
Live GoldSeek Visitor Map | Disclaimer
The views contained here may not represent the views of GoldSeek.com, Gold Seek LLC, its affiliates or advertisers. GoldSeek.com, Gold Seek LLC makes no representation, warranty or guarantee as to the accuracy
or completeness of the information (including news, editorials, prices, statistics,
analyses and the like) provided through its service. Any copying, reproduction
and/or redistribution of any of the documents, data, content or materials contained
on or within this website, without the express written consent of GoldSeek.com, Gold Seek LLC,
is strictly prohibited. In no event shall GoldSeek.com, Gold Seek LLC or its affiliates be
liable to any person for any decision made or action taken in reliance upon
the information provided herein.


