|
-- Posted Friday, 29 April 2011 | | Source: GoldSeek.com
The Golden Parabola is continuing to follow the cycle of the 70s Gold Bull as the U.S. Dollar is further devalued against Gold to balance the budget of the United States at this point in the paper currency cycle where Global Competitive Currency Devaluations rule. As discussed in a recent editorial this point in the cycle suggests that Gold will soon enter into a more aggressive higher rise in price as it starts to project the higher Vth Wave characteristics of this new Golden Parabola. Much of the debt that must be devalued by the U.S. government has not yet been moved to the balance sheet of the U.S. Government. As such, from a fundamental standpoint, we wont know the true height that Gold will achieve until that has been accomplished although we can gauge the progress of todays Gold Bull off of the 70s Gold Bull to a large extent. Price Inflation and the Price of Gold We saw price inflation, in general, track Gold in the late 70s, although much of the rise in general price inflation tends to lag the rise in the price of Gold because Golds rise is directly related to the rise in Dollar Inflation that eventually creates general price inflation. General price inflation lags the rise in the price of Gold since it takes time for Dollar Inflation to work its way through the pricing environment of the various markets. Thus, not only are Gold and Silver great hedges against price inflation, but owning Gold and Silver is a great way to pre-empt the ravages of price inflation that are headed our way over the coming years at this point in the paper currency cycle. THE GOLD CHARTS Chart #1 Suggests a Potential Price of $1860 for Gold into Mid-year The first Gold Chart is one I created for the original Golden Parabola editorial that showed my expectations at the time for Gold to bottom at the 34 week EMA with a potential target for Gold into mid-year per the 1970s Gold Bull up to around the $1860 level. On the chart, below, I have now added a blue line off of the tops since the 2008 Deflation Scare low showing a potential for Gold into mid-year to around the $1860 price level, which appears to confirm the earlier chart. The chart also shows that Gold has busted out to new historic highs with no horizontal resistance above and with no real angled resistance on the chart until much higher price levels are reached. Frankly, I expect the price of Gold to rise fairly rapidly up to the $1620 to $1640 area on the chart before going up to at least $1860 by mid-year. The TA indicators which simply monitor the health of price movements are all a go. 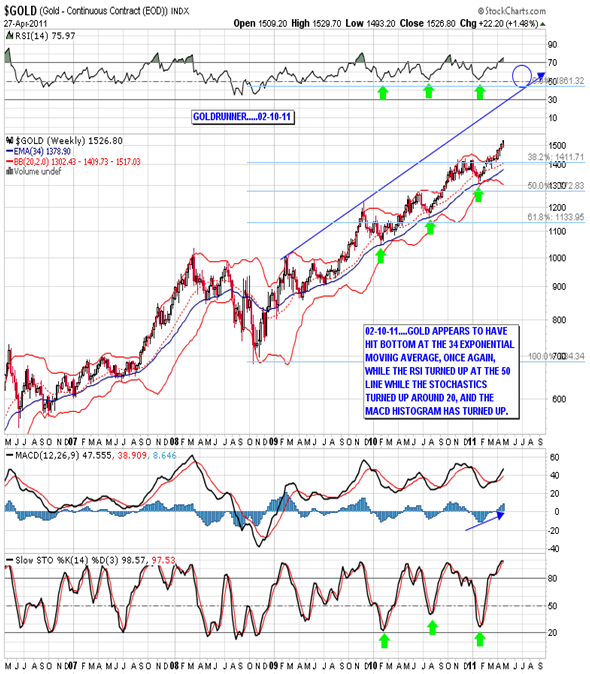
Chart #2 Suggests Potential $1920+ Gold Into Mid-year The second chart shows Gold rising up through the same angled dotted line that it rose through back in 2006 on its way to the upper black solid line of the channel top which will be around the $1920 level into mid-year. This chart also includes a black dotted line above the channel line that mimics the extent that Gold overshot the channel on the down side into the Deflation Scare Bottom into late 2008. Since the necessary Dollar Inflation to deal with the larger current level of debt is so much larger today versus the late 70s, is it possible that Gold will overshoot the upper log channel on the upside to the extent it overshot the channel bottom on the downside? If so, then a higher target for Gold might come into play.
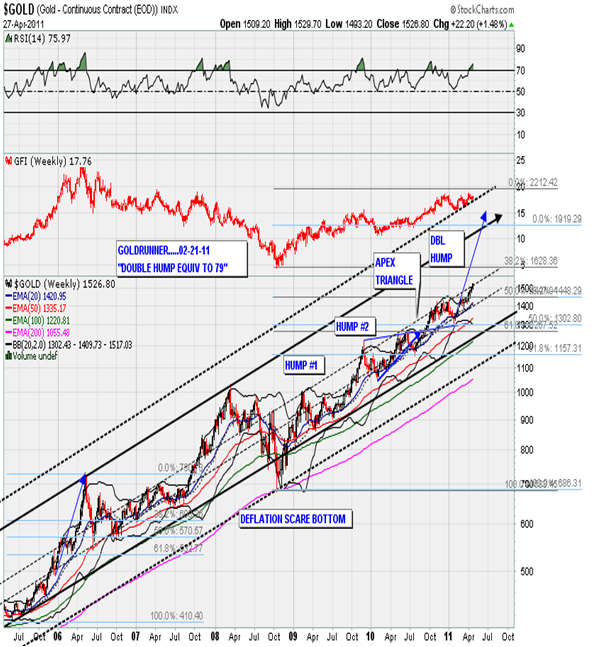
Chart #3 Suggests Vth Wave For Gold Unfolding The third Gold chart shows a distinct channel for each Phase or Elliott Wave rise in this current Golden Parabola. We can see that Wave I was basically held in the smaller flat blue channel into late 2005. After Gold broke out of that blue channel it moved into a higher sloped rise into the green channel that approximates Wave III in the current Golden Parabola. We can see on the chart that Gold has now busted up through the top of the Green Channel firmly into the Red Channel which appears to approximate the higher sloped Wave V advance. I had suggested some weeks ago to the subscribers to my service (see here for details) that a rise above the black dotted line on this arithmetic chart might herald in a very sharp rise in price into mid-year, and that appears to be in motion. We can see a similar bust out of the Wave I Channel into the Green Wave III Channel back in late 2005. That move in late 2005, up and out of the Wave I blue channel, was basically phase transition into Wave III if you want to use that term. Similarly, the current bust out of the Green Wave III Channel into the Red Wave V Channel appears to be the phase transition to Wave V in progress - a transition to a true higher priced slope of rise for the Golden Parabola.
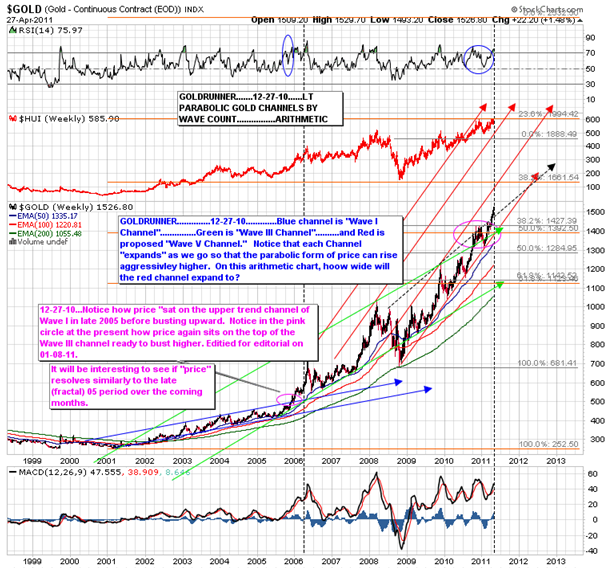
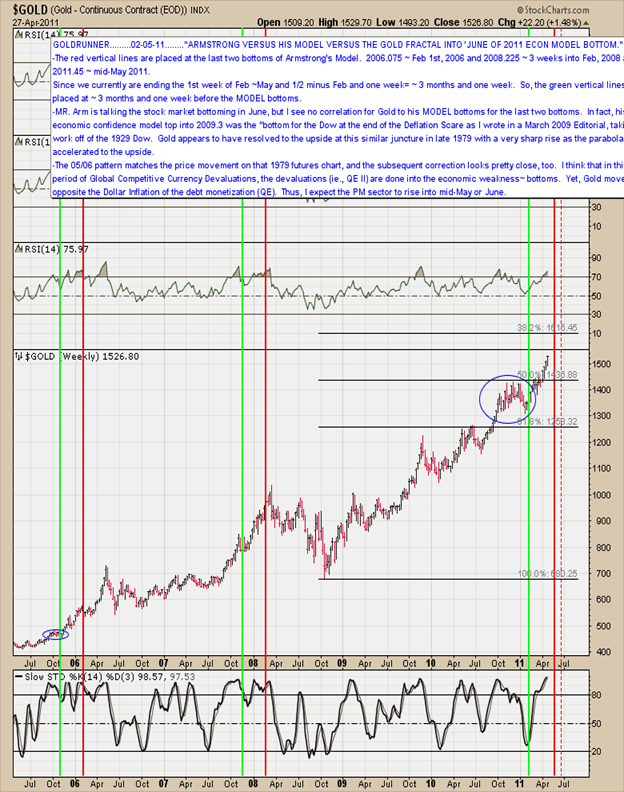
Chart #4 Suggests Gold Likely to Rise Into Armstrongs June 13th Turn Date The final chart for Gold is Fractal Gold Vs Armstrongs Economic Confidence Model. I have placed a dotted red line to the right of the sold red vertical line in the coming period to denote the actual June 13th turn date that Mr. Armstrong has proposed. We can see that the Gold price is running hard and higher toward his turn date as it did into the last 2 similar turn dates represented by the solid red lines on the left hand side of the chart. We can see that the TA Indicators which are simply tools to measure the health of the rise of Gold suggest that higher Gold pricing into the June 13th turn date appears probable.
CONCLUSION: Current Golden Parabola on Track The current Golden Parabola has been tracking the Golden Parabola of the 1970s almost perfectly for over a decade. Todays Golden Parabola is driven by the parabolic growth of the U.S. Dollar Inflation in response to the massive backdrop of debt that exists, today. We can project price targets as the Golden Parabola grows, but its final height will be determined by the necessary price level for Gold to balance the U.S. budget once all of the liabilities of the U.S. are eventually placed on its balance sheet. Many of those liabilities will not be transferred to the U.S. balance sheet until late in the Golden Parabolas rise in an attempt to compress the level of discomfort in terms of time that the Dollar Devaluation will create. Thus, it appears that at this time the terms Bubble and Gold do not belong in the same sentence. If you take a look at the chart for Silver you will start to get an inkling of what is to come for the Gold price. It appears that we are just entering the higher sloped rise in Gold that has already begun in Silver; and Silver still has a much higher path to climb into the future. There is no doubt that Gold has made a nice run since the original Golden Parabola article, but I expect the run to continue into mid-year. PM Stocks As a quick note on the PM Stock Indices, this analogous break-out of Gold ushered in higher valuations for the large cap PM stocks in the late 70s. The PM stocks tend to be re-valued higher in short dynamic spurts, and I am looking for one of those spurts higher for the PM Stock Sector to commence with this break-out in Gold. I hope to return with an article on the PM Stock Indices in a few days. Thank you for taking the time to read this article. By: Goldrunner, Goldrunnerfractalanalysis.com Please understand that the above is just the opinion of a small fish in a large sea. None of the above is intended as investment advice, but merely an opinion of the potential of what might be. Simply put: The above is a matter of opinion and is not intended as investment advice. Information and analysis above are derived from sources and utilizing methods believed reliable, but we cannot accept responsibility for any trading losses you may incur as a result of this analysis. Comments within the text should not be construed as specific recommendations to buy or sell securities. Individuals should consult with their broker and personal financial advisors before engaging in any trading activities. Do your own due diligence regarding personal investment decisions. In the interest of full disclosure, GOLDRUNNER is personally invested in the Precious Metals sector including various Precious Metals and other individual stocks. GOLDRUNNER reserves the right to modify or eliminate any or all positions at any point in time.
-- Posted Friday, 29 April 2011 | Digg This Article | Source: GoldSeek.com | Source: GoldSeek.com
Previous Articles
|


