-- Posted Thursday, 6 October 2011 | | Disqus
By: David Chapman
With gold correcting back roughly 16% from its recent all-time highs it sometimes pays to put things in a little perspective.
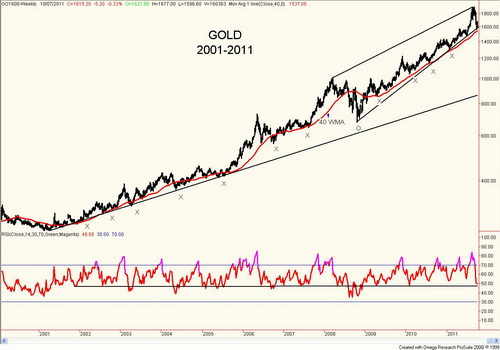
This is a weekly chart of gold dating back to the start of the bull market in 2001. As can be seen gold has been in a relentless uptrend since its double bottom lows near $250 in 2001. Based on the current price that is a gain of 540%. Gold is up about 460% since the beginning of the millennium. Compare that with the S&P TSX Composite that is up 33% and the S&P 500 who is down some 23% since the beginning of the millennium.
As this chart shows gold has also had numerous corrections over the past 11 years. Many of them have been quite sharp. However, a couple of things stand out. First gold tends to find significant support at or near the 40 week MA. Second gold appears to find good support when the weekly RSI falls to around the 50 level. All of these points have been marked with an X.
There has been an exception. The 2008 financial collapse took Gold well below the 40 week MA and the RSI fell significantly under 50. As TC has noted in the past gold follows what appears to be a 8.5 year cycle with a range of 7 to 11 years. Based on the 2001 low that low was due August 2009 + or 17 months. The low of October 2008 fell in that period suggesting that was the 8.5 year cycle low. Confirmation came when gold took out the highs of March 2008 going from $1000 to $1900. As TC has suggested this current correction is probably the 34 month cycle (subdivision of the 8.5 year cycle by a factor of 3) low that is due July 2011 + or 3 months.
With the exception of the 2008 collapse gold has found support near the 40 week MA and an RSI of 50. Confirmation would come that the low had been made with new highs above $1910. Some have suggested that gold is in the process of forming an ascending wedge triangle. The slope of the triangle is not particularly steep and to date there has been only one test of the top of the channel. There is considerable room to move higher in the triangle and make another test of the top of the channel. If it is an ascending wedge triangle then it needs further confirmation.
Gold has done a good job of holding its bull uptrend lines. The suggestion here is that this should be the case once again. An area that would cause concern if broken on the downside is around $1480. This was the July 2011 lows. That level should hold on this current pullback.
Bonus Chart
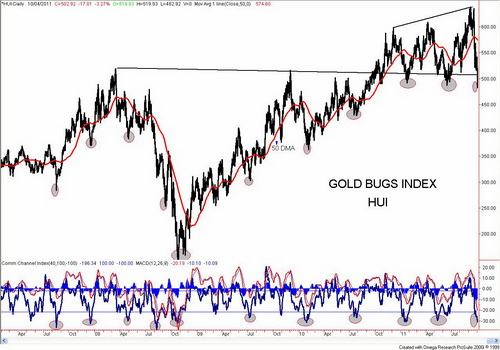
Chart created using Omega TradeStation 2000i. Chart data supplied by Dial Data.
If gold has been beat up this past month the gold stocks have been equally beat up. The chart of the HUI shows that the gold index has fallen to the levels seen in January and June 2011. This has many concerned that the HUI could crash right through and begin a more substantial collapse. Up until the past week the gold stocks had been holding well even as gold (and silver) plunged. Not so late last week and with the broader market falling sharply late last week the HUI plunged as well to new lows for the current down move.
Despite the current 22% correction the HUI is still up 578% since the beginning of the millennium. The daily chart of the HUI shows that it has fallen to a broad base of support connecting the highs of March 2008 with the highs of December 2009. The index is also at extremes seen numerous times over the past 3 years (denoted by the elliptical gray area on both the index and the CCI indicator). This is not to suggest that the lows are at hand but only that at a minimum a good rebound could soon get underway. Any rebound that takes the HUI to new highs would confirm that the low was in. In the interim as mentioned in the weekend report the HUI needs to regain above 580 to suggest that the recent highs could fall.
If gold rebounds from the current levels as is expected then the HUI would follow. Given the plunge of the S&P 500 back towards the levels seen back in July 2010 this suggests that all of the gains since QE2 have been effectively wiped out. Is QE3 about to arrive to save the markets once again?
Bonus Chart #2
Source: www.stockcharts.com
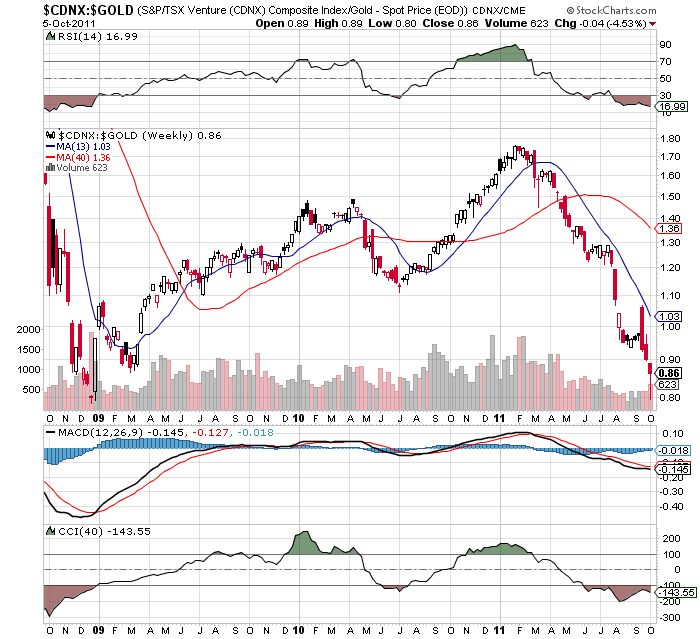
TC also notes that in looking at the TSX Venture Exchange/Gold ratio that the ratio is back at levels seen at the depths of the 2008 financial crash. If the past is portend of the future this suggests that the junior gold mining exploration stocks are as cheap now as they were at the depths of the 2008 financial crash. Many are trading for less than the value of their holdings in the ground and some are even trading below the amount of cash held in the bank.
All of the above are signs that suggest gold, the gold stocks and the junior miners could soon be rising again.
Note: Some of the charts above are based on similar ones seen at www.jsmineset.com.
copyright 2011 All Rights Reserved David Chapman
www.davidchapman.com
General Disclosures
The information and opinions contained in this report were prepared by MGI Securities. MGI Securities is owned by Jovian Capital Corporation (Jovian) and its employees. Jovian is a TSX Exchange listed company and as such, MGI Securities is an affiliate of Jovian. The opinions, estimates and projections contained in this report are those of MGI Securities as of the date of this report and are subject to change without notice. MGI Securities endeavours to ensure that the contents have been compiled or derived from sources that we believe to be reliable and contain information and opinions that are accurate and complete. However, MGI Securities makes no representations or warranty, express or implied, in respect thereof, takes no responsibility for any errors and omissions contained herein and accepts no liability whatsoever for any loss arising from any use of, or reliance on, this report or its contents. Information may be available to MGI Securities that is not reflected in this report. This report is not to be construed as an offer or solicitation to buy or sell any security. The reader should not rely solely on this report in evaluating whether or not to buy or sell securities of the subject company.
Definitions
Technical Strategist means any partner, director, officer, employee or agent of MGI Securities who is held out to the public as a strategist or whose responsibilities to MGI Securities include the preparation of any written technical market report for distribution to clients or prospective clients of MGI Securities which does not include a recommendation with respect to a security.
Technical Market Report means any written or electronic communication that MGI Securities has distributed or will distribute to its clients or the general public, which contains an strategists comments concerning current market technical indicators.
Conflicts of Interest
The technical strategist and or associates who prepared this report are compensated based upon (among other factors) the overall profitability of MGI Securities, which may include the profitability of investment banking and related services. In the normal course of its business, MGI Securities may provide financial advisory services for issuers. MGI Securities will include any further issuer related disclosures as needed.
Technical Strategists Certification
Each MGI Securities technical strategist whose name appears on the front page of this technical market report hereby certifies that (i) the opinions expressed in the technical market report accurately reflect the technical strategists personal views about the marketplace and are the subject of this report and all strategies mentioned in this report that are covered by such technical strategist and (ii) no part of the technical strategists compensation was, is, or will be directly or indirectly, related to the specific views expressed by such technical strategies in this report.
Technical Strategists Trading
MGI Securities permits technical strategists to own and trade in the securities and or the derivatives of the sectors discussed herein.
Dissemination of Reports
MGI Securities uses its best efforts to disseminate its technical market reports to all clients who are entitled to receive the firms technical market reports, contemporaneously on a timely and effective basis in electronic form, via fax or mail. Selected technical market reports may also be posted on the MGI Securities website and davidchapman.com.
For Canadian Residents: This report has been approved by MGI Securities which accepts responsibility for this report and its dissemination in Canada. Canadian clients wishing to effect transactions should do so through a qualified salesperson of MGI Securities in their particular jurisdiction where their IA is licensed.
For US Residents: This report is not intended for distribution in the United States.
Intellectual Property Notice
The materials contained herein are protected by copyright, trademark and other forms of proprietary rights and are owned or controlled by MGI Securities or the party credited as the provider of the information.
Regulatory
MGI SECURIITES is a member of the Canadian Investor Protection Fund (CIPF) and the Investment Industry Regulatory Organization of Canada (IIROC).
Copyright
All rights reserved. All material presented in this document may not be reproduced in whole or in part, or further published or distributed or referred to in any manner whatsoever, nor may the information, opinions or conclusions contained in it be referred to without in each case the prior express written consent of MGI Securities Inc.
-- Posted Thursday, 6 October 2011 | Digg This Article | Source: GoldSeek.com


