-- Posted Thursday, 15 December 2011 | | Disqus
By Justin Smyth
One of the beauties of trend following is ignoring the constant swirl of noise that surrounds the market. Charts dont lie, and they dont have opinions. By pouring through a wide variety of charts, from the major market indexes, to commodities, bonds, and foreign markets, you can develop an overall feel for what is going on in the markets. This objective method of looking at the market can dramatically improve your confidence and understanding.
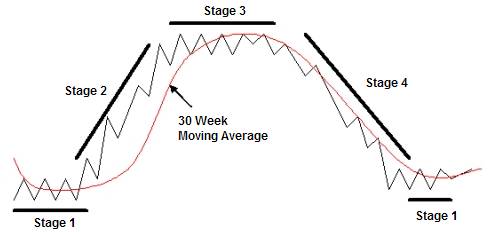
To get a simple view of the trend I like to use weekly charts with a 30-week moving average and a TRIX indicator. The relationship of the weekly price action to the 30-week moving average determines what stage the market is in, according to Stage Analysis. Stage Analysis is one of my preferred trend following methods since it is easy to visualize but still very effective in understanding the current trend.

The TRIX indicator is used to confirm the trend, and also determine whether the market is trending or pulling back within a trend. My interpretation of the TRIX is as follows: when the TRIX is above zero, the long term trend is up, and when the TRIX is below zero, the long term trend is down. Along with that rule, if the TRIX is above zero but has crossed back below its signal line and is traveling back down, then the market is pulling back within a longer term uptrend. Conversely, when the TRIX is below zero, but has crossed back up above its signal line and is moving higher, then the market is bouncing within a longer term downtrend.
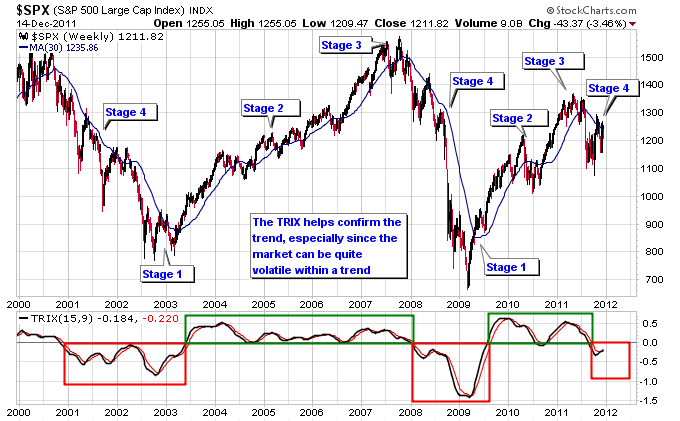
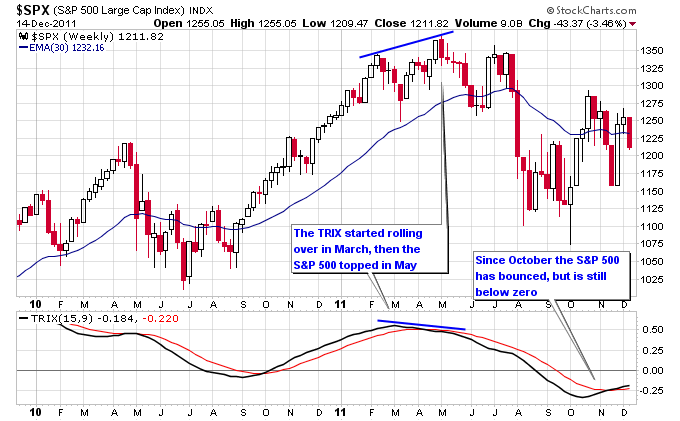
The weekly chart of the S&P 500 below shows the stage transitions through the bull and bear markets of the last 10+ years. Notice how the TRIX helped confirm the trend, it stays below zero during bear markets and above zero during bull markets.

Looking closer at the S&P 500, it started losing momentum back in March of this year, as evidenced by the TRIX crossing over and moving to the downside. Then the S&P 500 topped in May, and the TRIX continued to move lower and cross below zero. The cross below zero is key, since it signals a long term trend change to a downtrend. This is a clear warning sign to long term investors. Since October the TRIX has crossed over to the upside, but is still below the zero line. So according to the rules laid out above the bounce from October is still a bounce within a downtrend.

Its important to follow the major indexes since they form the foundation for where the market is headed. But smaller components of the market, such as sectors, commodities, currencies, and even individual stocks or collections of stocks can give clues as to when the overall market could slowly be undergoing a trend change. One thing I like to focus on is where the strength in the market is, and where the weakness is.
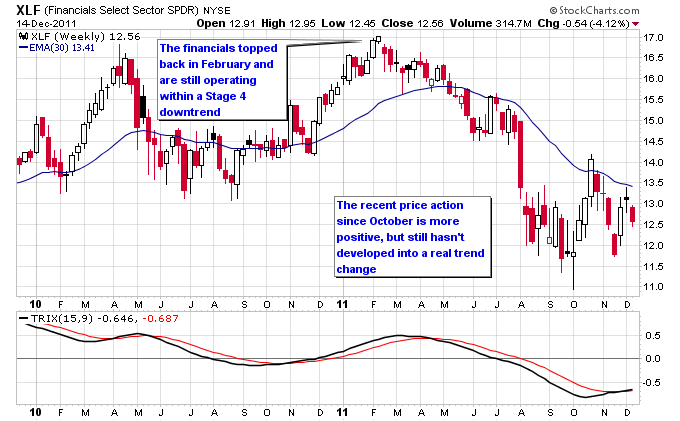
The financial sector was the primary cause of the bear market in 2008 and topped well ahead of the rest of the stock market. The same thing has happened again with the financials topping in February of this year ahead of the market. Notice how the financials have shown some strength with their recent bounce, but it still hasnt developed into a definitive trend change.

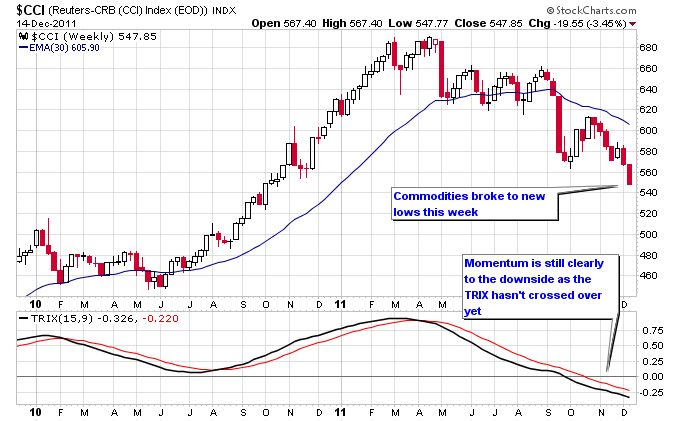
The commodities sector is one of the weakest components of the market currently. The CCI Commodities index broke to new lows this week, and the TRIX hasnt even crossed over to the upside yet, and is still below zero.

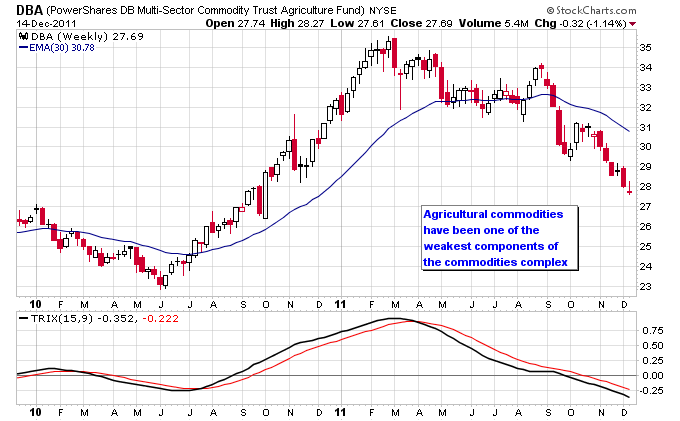
Looking at commodity sub-sectors, the agricultural sector is especially weak compared to other commodities like gold and oil.

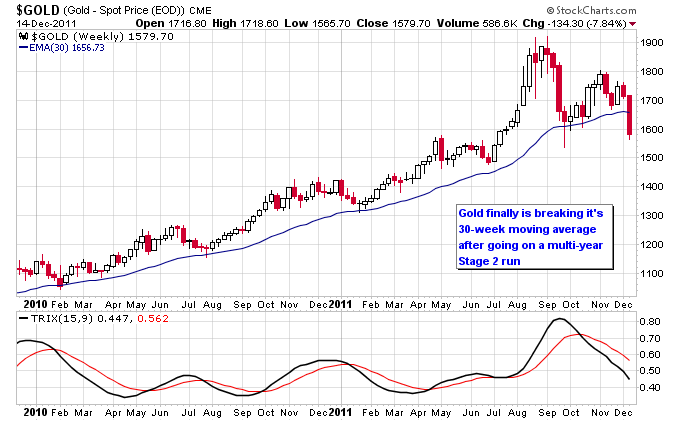
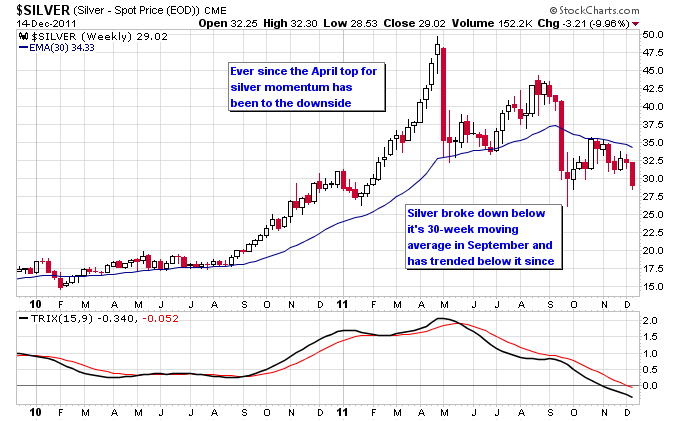
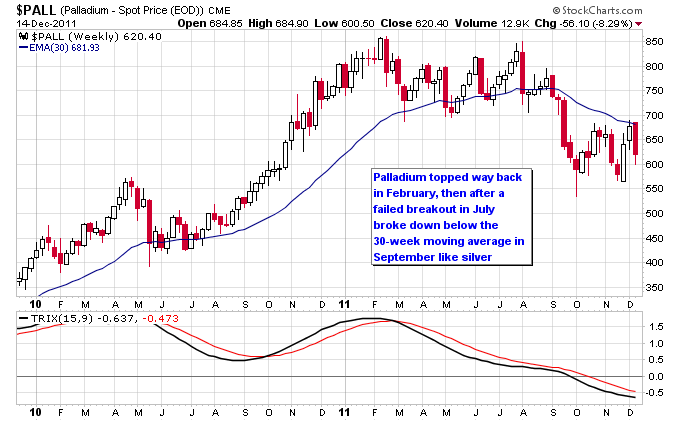
Gold finally broke below its 30-week moving average this week. The fact that silver, platinum, and palladium had broken down previously into a Stage 4 downtrend was a warning sign that gold could be vulnerable. Usually the precious metals move in more or less the same direction, so its important to note when there are divergences within the sector. This time around the weakness that the other three metals were showing finally caught up to gold.


The charts presented above represent a portion of the overall market, but if one were to delve further into charts across other sectors, commodities, and foreign indexes there is a predominance of Stage 4 downtrends currently in the market. The key question now is how long will it take for these downtrends to play out? If you set aside attempts to forecast a bottom, all you can do is wait for it to come. Think of a bear market like a horrific accident, its much better to experience it as an innocent bystander passing by it, than a participant right in the middle of it. You want to be in a safe place and let the bear market run its course.
The most positive end to the current bear market would be if the early October bottom held up for portions of the market that havent broken below it yet. Commodities have already broken below this bottom, but if other sectors diverged and didnt break below their October lows that would setup the basis for a much healthier market. So the October lows will provide an important area to monitor as this bear market plays out.
Justin Smyth
Follow me on Twitter: @nextbigtrade
The original article and much more can be found at: http://www.nextbigtrade.com
-- Posted Thursday, 15 December 2011 | Digg This Article | Source: GoldSeek.com


