-- Posted Friday, 17 May 2013 | | Disqus
The latest World GoldCouncil Gold Demand Trends report shows that the gold market is driven bydiverse global demand, and the appetite for owning gold jewelry, bars and coinscontinues to grow.
The price drop in April,fuelled by non-physical moves in the market, proved to be the catalyst for asurge of buying that has left many retailers short of stock and refineriesintroducing waiting lists for deliveries, said Marcus Grubb, Managing Directorof Investment at the World Gold Council. What these figures show is that evenbefore the events of April, the fundamentals of the gold market remain robustwith; growing demand in India and China, central banks consistently adding goldto their reserves and strong buying of investment products such as gold barsand coins.
The report, for theperiod between January-March 2013, shows that total jewelry demand was up 12%year-on-year in Q1 2013, driven mainly by Asian markets. For example, jewelrydemand in China was up 19% on the same period last year and stood at a record185 tons. Demand in both India and the Middle East was up 15% respectively andin the US, demand showed a significant increase, 6%, for the first time since2005.
Demand for gold inChina and India was also fuelled by an increase in bar and coin sales - up 22%year-on-year in China and a whopping 52% in India. The US also saw a growinghunger for bars and coins-- up 43% compared with the same quarter in 2012.
Theres significantinvestment demand for physical gold bullion at the current prices what does it mean for the market? That itsgoing higher in the long run and that the current move down is just acorrection. It doesnt imply, however, that the bottom is already in or that itwill form without additional temporary downswing.
To gain some insightinto short- and medium-term picture of the market, let's take a look at thecharts. In todays essay we will discuss the implications of the currentsituation in the USD Index and the general stock market for, gold, silver andmining stocks, and we will also provide a follow-up to our recent essay on gold stocks and gold. We will start with the very-long-term USDIndex chart (charts courtesy by http://stockcharts.com.)
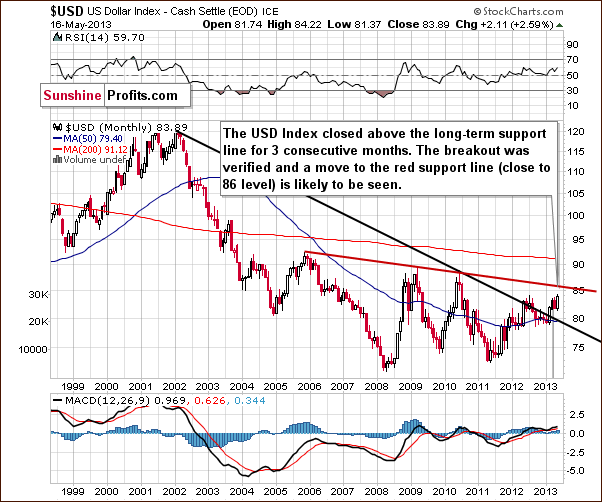
In this chart, we seethat more moves to the upside took place this week. As we stated in our essay of two weeksago:
The index hasactually confirmed a breakout above the very long-term resistance line. It hasclosed above it now for three consecutive months (yes, months). While acorrection to the 80 level is still possible in the short term, an eventual move to theupside is now more likely than not.
This weeks priceaction was in tune with what we expected after the recent breakout and thesituation remains bullish.
Letus move on to the general stock market.
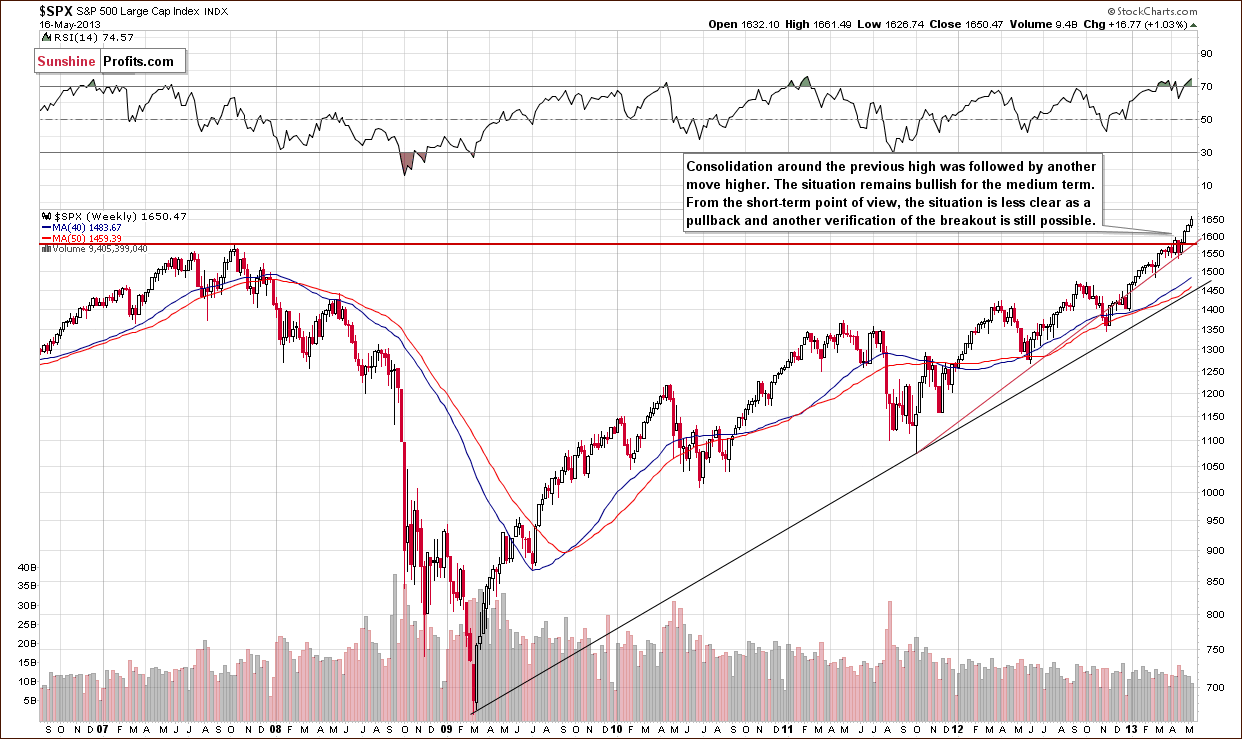
The stock market(S&P Index in this case) continues to move higher this week as expected.The situation is overbought on a short-term basis, but we do not expect to see amove below 2007 high. If anything, we could see stocks move back to this level,which could further verify the breakout and allow them to gather strength inadvance of the next rally. After all, the breakout above the 2007 high wasconfirmed.
To see how thesituation in the USD and stocks may translate into the prices of gold andsilver, we now turn to the intermarket correlations.
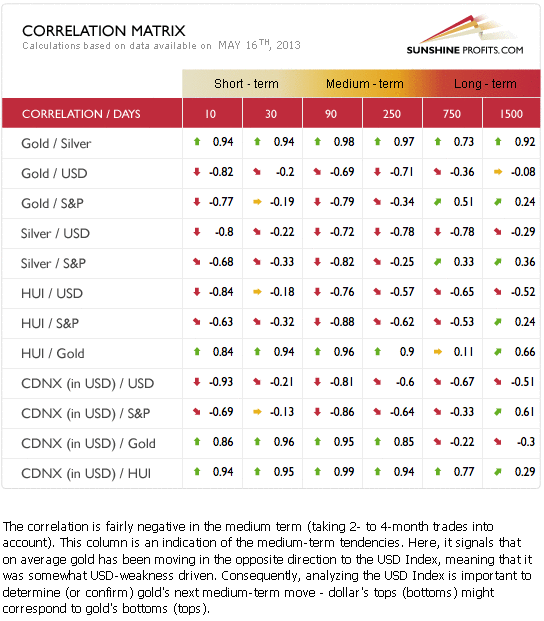
The CorrelationMatrix is a tool which we have developed to analyze the impact of the currencymarkets and the general stock market upon the precious metals sector, (namely: gold correlations and silver correlations).
The short-termsituation here is mixed and no real implications can be drawn at this time. Themedium-term correlations are negative for the precious metals with both the USDIndex and the general stock market. The precious metals are still pretty muchanti-asset at this time. The medium-term odds, which favor a rally in the USDIndex and the general stock market, have now painted a bearish picture forgold, silver and the precious metals mining stocks.
To finish off, let ushave a look at the situation in gold stocks relative to the yellow metalitself.
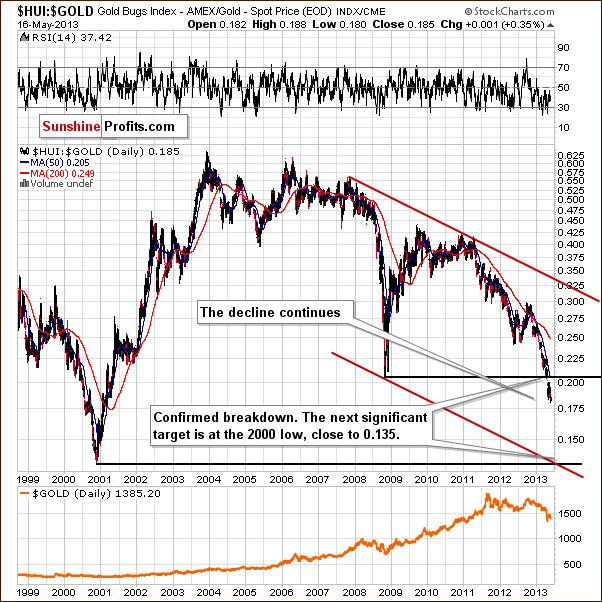
On the above chart,the situation hasnt changed much this week. Hence, comments made in last weeks essay remain up-to-date at this time and the bearish outlook continues to be supportedby this chart:
The trading channel and the next horizontal supportintersect at a point much lower than where this ratio is today. Of course, theexistence of a target level by itself is no indication that it will be reached;the trend has to be in place as well. The point here is that the ratio hasalready broken below the previous late 2008 major low and is now a bit morethan 5% beneath it. This is a major breakdown and it was confirmed. Theimplication is that the trend is still down.
With the trend being down and accelerating andthe recent breakdown being confirmed, there is a good possibility that theminers will decline significantly once again. This makes the previouslymentioned target level a very important one. At this time it seems likely thatthe ratio will move to its 2000 low close to the 0.135 level.
If gold stocks decline relative to gold as theydid late in 2000, and gold declines to $1,300 or slightly higher, the targetlevel for the HUI Index would be slightly above the low of 2008 around the180 level.
Summing up, the long-term and medium-term outlook is bullish for the USD Index atthis time. As for stocks, the situation remains bullish for the medium term,and although a short-term correction is likely not too far off, we dont expectto see it immediately. Finally, gold stocks performance relative to goldcontinues to provide us with bearish indications. Overall, it seems that thefinal bottom in the precious metals market is not yet in.
Thank you for reading. Have a great and profitable week!
Przemyslaw Radomski, CFA
Founder, Editor-in-chief
SunshineProfits.com
* * * * *
About Sunshine Profits
SunshineProfits enables anyone to forecast market changes with a level of accuracy thatwas once only available to closed-door institutions. It provides free trialaccess to its best investment tools (including lists of best gold stocks and silver stocks), proprietary gold & silver indicators, buy & sellsignals, weekly newsletter, and more. Seeing is believing.
Disclaimer
All essays, research andinformation found above represent analyses and opinions of Przemyslaw Radomski,CFA and Sunshine Profits' associates only. As such, it may prove wrong and be asubject to change without notice. Opinions and analyses were based on dataavailable to authors of respective essays at the time of writing. Although theinformation provided above is based on careful research and sources that are believedto be accurate, Przemyslaw Radomski, CFA and his associates do not guaranteethe accuracy or thoroughness of the data or information reported. The opinionspublished above are neither an offer nor a recommendation to purchase or sellany securities. Mr. Radomski is not a Registered Securities Advisor. By readingPrzemyslaw Radomski's, CFA reports you fully agree that he will not be heldresponsible or liable for any decisions you make regarding any informationprovided in these reports. Investing, trading and speculation in any financialmarkets may involve high risk of loss. Przemyslaw Radomski, CFA, SunshineProfits' employees and affiliates as well as members of their families may havea short or long position in any securities, including those mentioned in any ofthe reports or essays, and may make additional purchases and/or sales of thosesecurities without notice.
-- Posted Friday, 17 May 2013 | Digg This Article | Source: GoldSeek.com


