-- Posted Friday, 17 May 2013 | | Disqus
Nothing is normal: not the economy, not the financial system, not the financial markets and not the political system. The system remains still in the throes and aftershocks of the 2008 panic and the near-systemic collapse, and from the ongoing responses to same by the Federal Reserve and federal government. Further panic is possible and hyperinflation is inevitable.
The economic and systemic solvency crises of the last eight years continue. There never was an actual recovery following the economic downturn that began in 2006 and collapsed into 2008 and 2009. What followed was a protracted period of business stagnation that began to turn down anew in second- and third-quarter 2012. The official recovery seen in GDP has been a statistical illusion generated by the use of understated inflation in calculating key economic series (see Public Comment on Inflation ). Nonetheless, given the nature of official reporting, the renewed downturn likely will gain recognition as the second-dip in a double- or multiple-dip recession.
What continues to unfold in the systemic and economic crises is just an ongoing part of the 2008 turmoil. All the extraordinary actions and interventions bought a little time, but they did not resolve the various crises. That the crises continue can be seen in deteriorating economic activity and in the panicked actions by the Federal Reserve, where it proactively is monetizing U.S. Treasury debt at a pace suggestive of a Treasury that is unable to borrow otherwise.
April Employment and Unemployment, M3 and Monetary Base,
John Williams, Shadowstats.com, 05/03/2012
It had to happen. And now it has begun. The Very Biggest Bubble in Financial History has begun to Deflate. And over the next few months, we expect that Deflation to accelerate and morph into a Bursting.
And that Bursting will affect the price of nearly every Financial Asset on the Planet, and Many Key Non-Financial ones as well.
Independent (non-Main Stream Media) Financial Analysts generally agree that The Fed, Bank of Japan, and increasing numbers of other Central Banks Orgy of Fiat Money Printing (i.e., Competitive Fiat Currency Purchasing Power Debasement i.e., the Currency Wars) will likely come to a very Bad End.
One Likely result: Hyperinflation. (The U.S., e.g., is already Threshold Hyperinflationary with Real CPI at 9.15% per shadowstats.com.) and consequent Collapse of one or more Sectors. Think Argentina (50% Inflation) as a Distinct possibility.
So it is crucial to recognize the 3 Key Warning Signs that a Collapse of one or more Sectors is impending, so one can Profit and Protect. Unfortunately, 2 of these Indicators are already hinting that Collapse in one and quite possibly two Key Sectors may Not be far off beginning within the next few weeks or very few months. Do these signs of Key Sector Collapse mean one is certain? No, but they are Ominous Indicators of Probability nonetheless.
Indeed, it is the possible collapse in one of these Sectors about which Goldman Sachs CEO Lloyd Blankfein warned just a few days ago and about which we have been Warning for weeks, that is most likely.
Carefully consider the four-month chart of the benchmark 10-year U.S. T-Bond which confirms that Bond Technicals confirm Bond Fundamentals.
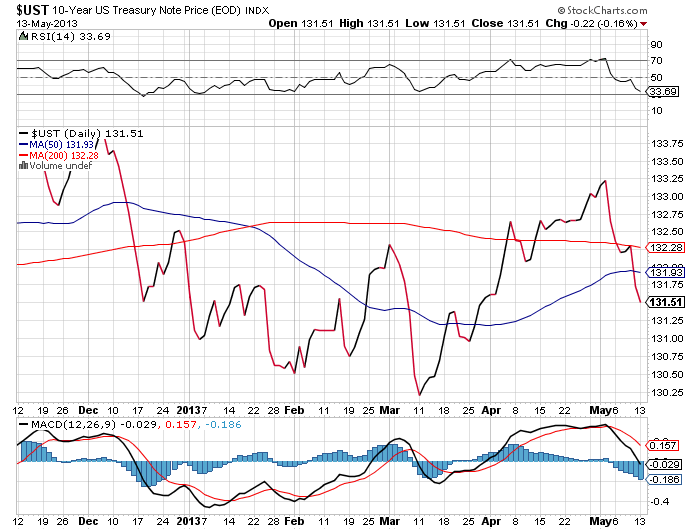
Note the violation of the short rising trend-line in early May. Not good. Note the key support level is the March low of 132.21.
It has now been violated conclusively with this Past Mondays (05/13) close of 131.31.
If the US 10 Year continues down, a Massive Collapse in the Bond Market (i.e., much lower Bond prices / much higher Interest rates) becomes increasingly probable. Such a Collapse would Wreak Havoc on the economy because credit would become very expensive or unavailable, as it became in the late 1970s to early 1980s and again in 1994.
Consider Blankfeins Warning:
I worry now
I look out of the corner of my eye, to the 94 period
youd think in hindsight (it) should have been expected
(it) really was stunning.
Lloyd Blankfein, CEO, Goldman Sachs, 05/01/2013
Going Forward, watch the U.S. 10Yr Chart very carefully. It is Indicator #1 that a one or two Sector, and perhaps broader Collapse is impending and it is already Hinting.
Indicator #2 is the U.S. Dollar. Short-term (next few weeks) we have already forecast continued strengthening basis USDX because of continued Eurozone weakness, Bank of Japan Yen (and several other Central Banks intensified) printing, i.e. the ongoing, and intensifying Currency War, i.e. Competitive Devaluation.
But given The Feds Ongoing Orgy of printing ($85 billion per month) long-term the $US is toast vis à vis Real Assets.
So looking again at a 5-year $US chart we see key support is at 78 basis USDX. If the $US were to close below 78 it would be Indicator #2 that a Major Collapse is quite likely impending. At present, we see no Hinting yet for the $US.
In sum, short-term (next few weeks or very few months) we continue to forecast the $US remains above 80. However, short-term the 10-year U.S. T-bond is already hinting at collapse with the yield popping to 1.95% very recently. We shall watch very closely, and are indeed prepared to recommend shorting the 10-year at any time. (Regarding Profit and Protection from the foregoing, see Notes 1, 2 and 3 below.)
Indicator #3 that a Key Sector or, at broader, Financial, Collapse is impending would be Crude Oil Prices.
A serious spike in Crude Oil prices would / will stop Fed and other Central Bank Money Printing dead in its tracks. And such a Halt would remove support from Equities and other Markets. Therefore, consider well that a 3-year chart of Crude prices presents a triangle pattern, a pattern which is coming closer and closer to the breakout point.
The question is, which way will it break.
With WTI Crude in the mid-$90s and trending up recently, it is hinting that a Sector Collapse resulting from a spike in Crude Prices may be impending.
Some month (or weeks) not too far off, Fed and other Central Banks Money Printing will likely cause a price breakout most likely to the upside (i.e., above $100). Equities will then tank. Given the Central Banks intensified money printing a Breakout is likely just a matter of a weeks or a very few months.
The Crude Price is an Indicator to watch, and it is already hinting. In sum, if Crude spikes up, or Bonds down (and thus, interest rates up), Equities will Tank and both Crude and Bonds are hinting.
[By the way, we discount somewhat the enthusiasm with which the recent IEA Report (the U.S. production would increase by 3.9 Million/bbl/day in the next five years appx due to fracking) was accompanied. Even if true that would increase U.S. Production to appx 12 Million/bbl/day. But the U.S. consumes 18 Million BBL/day and fracked wells have much higher depletion rates.]
The Great Bond-Bubble Bursting is near (and a $US Swoon is likely not too many months off either) thanks to Fed and other Central Banks printing, the only issue is which month, or week, will the Acceleration to that Burst occur.
In sum, Bonds and Crude Oil are the Indicators hinting that the Collapse of one or more Sectors impending, the US$ not yet.
Best regards,
Deepcaster
May 16, 2013
Note 1: Central Bank and Major Government Actions lately increasingly have the Odor of Desperation about them.
- Japan and the U.S. Central Banks are creating Fiat Money at all-time record levels. And Australia just joined the Fiat Currency weakening War.
- India has tripled the tax on and imposed restrictions on Gold Imports.
- Cypruss Gold and Bank Deposits have been confiscated.
- U.S. job and Inflation numbers are becoming increasingly unbelievable.
- And evidence of Central bank and Government Intervention continue to increase in a wide variety of Markets.
- Witness the mid-April Precious Metals Paper Price Takedown, which resulted in a rush for Physical world-wide and doubling of Premiums for Physical.
And the main reason for these Actions by the Powers of the Developed World is that the Market performance of Key Sectors has become farther and farther divorced from Economic Fundamentals and the US$ is becoming increasingly Vulnerable. And, ultimately, Fundamentals will prevail. All of this has led to the increasing likelihood of a Massacre in one Huge Sector, according to one very highly placed Financial System Insider. And Deepcaster agrees with him, and has been saying the same thing for weeks.
To consider how this Warning is justified and what Opportunities for Profit and Protection it provides, read our recent Alert, Insider Warns Key Sector Mega-Crash Impending; Reco. Prep.; Forecasts: U.S. Dollar/Euro, U.S. T-Notes, T- Bonds, & Interest Rates, Gold & Silver, Crude Oil, & Equities, just posted in Alerts Cache at deepcaster.com.
Note 2: There are Magnificent Opportunities in the Ongoing Crises of Debt Saturation, Rising Unemployment, Negative Real GDP growth, over 9.0% Real U.S. Inflation (per Shadowstats.com) and prospective Sovereign and other Defaults.
One Sector full of Opportunities is the High-Yield Sector. Deepcasters High Yield Portfolio is aimed at generating Total Return (Gain + Yield) well in excess of Real Consumer Price Inflation (9.12% per year in the U.S. per Shadowstats.com).
To consider our High-Yield Stocks Portfolio recommendations with Recent Yields of 17.97%, 10.6%, 18.5%, 10.7%, 26%, 8%, 15.6%, 8.6%, 10%, 6.7%, 14.9%, 8.8%, 10.4% and 15.4% when added to the portfolio; go to www.deepcaster.com and click on High Yield Portfolio.
Note 3: A superficial review of the Market Performance of Major Sectors can present a confusing perspective. There are Major Bullish and Major Bearish Fundamental and Technical Indicators in several of the Major Sectors we follow.
But a review of deeper and longer term Technical and Fundamental Indicators reveals High Probability forecasts which can allow Profitable Investments above the noise.
Indeed two sectors provide Great Profit Potential in the mid-to-long term. We identify those High Probability Forecasts and Sectors in our recent Alert, Profit Opportunity; Forecasts: Gold, Silver, Equities, U.S. Dollar/Euro, U.S. T-Notes, T- Bonds, & Interest Rates, & Crude Oil posted in Alerts Cache at deepcaster.com.
And in one of these a very substantial Profit Opportunity has dramatically appeared just recently. To consider this Profit Opportunity and High Probability Forecasts for Waves 2, 3 and 4, read this Alert.
DEEPCASTERLLC
www.deepcaster.com
DEEPCASTER FORTRESS ASSETS LETTER
DEEPCASTERHIGH POTENTIAL SPECULATOR
WealthPreservation Wealth Enhancement
-- Posted Friday, 17 May 2013 | Digg This Article | Source: GoldSeek.com


