-- Posted Tuesday, 9 July 2013 | | Disqus
By Rambus
As most of you know Ive been bullish on the stock markets for quite sometime now. I know there are a lot of investors that are bearish on the US markets and are looking for them to crash on burn. From my perspective nothing is broken that would tell me at this point in time to expect a major correction. So far the charts have been playing out beautifully and if nothing is broken there is no need to fix it.
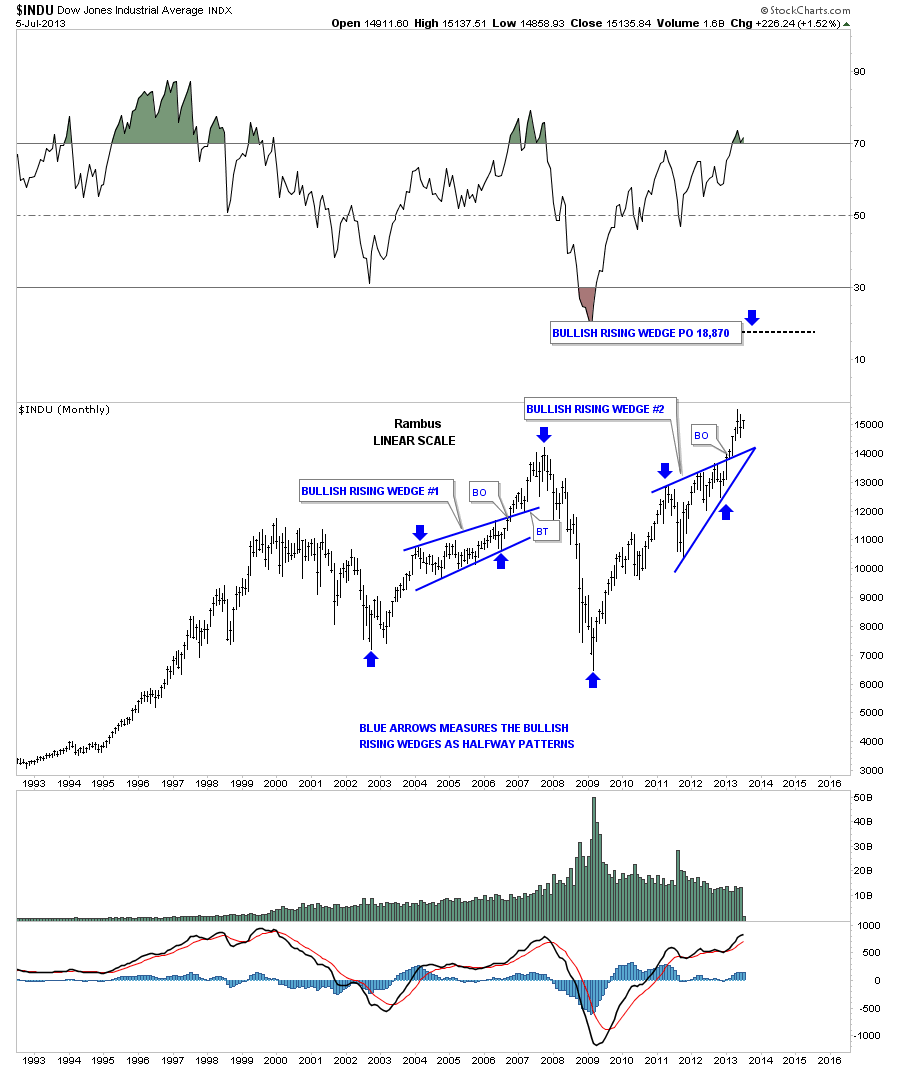
The first chart I would like to show you is a very long term monthly look at the INDU that seems to be repeating a pattern that formed back in 2002 to 2007 rally phase. Ive shown this chart several times in the past that shows the bullish rising wedge that formed as a halfway pattern in the middle of the 2002 to 2007 rally. No one at the time recognized this pattern, the bullish rising wedge, because everyone always considers these patterns as bearish. Nothing could be further from the truth as I have shown many times they act and perform just as any other consolidation if the price action breaks out through the top rail. The chart below shows the bullish rising wedge that formed in 2002 to 2007 as a halfway pattern that measured out perfectly in time and price to the 2007 high just before the crash. You can see our current bullish rising wedge that Ive been showing since the breakout about 6 months or so ago.

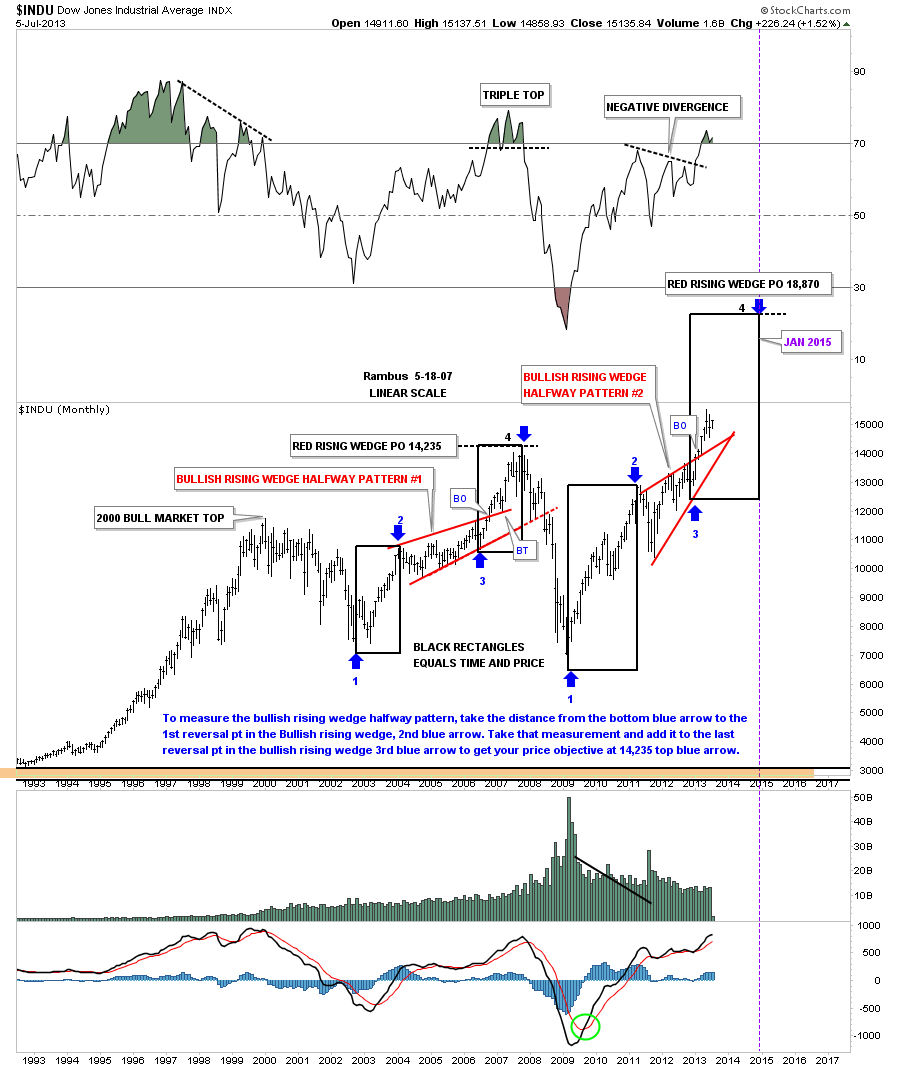
This next chart is the exact same chart as shown above. It may look a little busy but it shows you what Im look for with our current bullish rising wedge #2. Note the two black rectangles from 2002 to 2007 that measured out the bullish rising wedge #1 as a halfway pattern in time and price. Now look at our current bullish rising wedge #2 that is showing a price objective up to 18,870 as measured by the blue arrows with a time frame in January of 2015 or so. You will only see a chart like this at Rambus Chartology and nowhere else because no one is looking for this pattern. The bears were all over the bullish rising wedge before it broke out to the upside. Its now been about 6 months and nothing is broken.

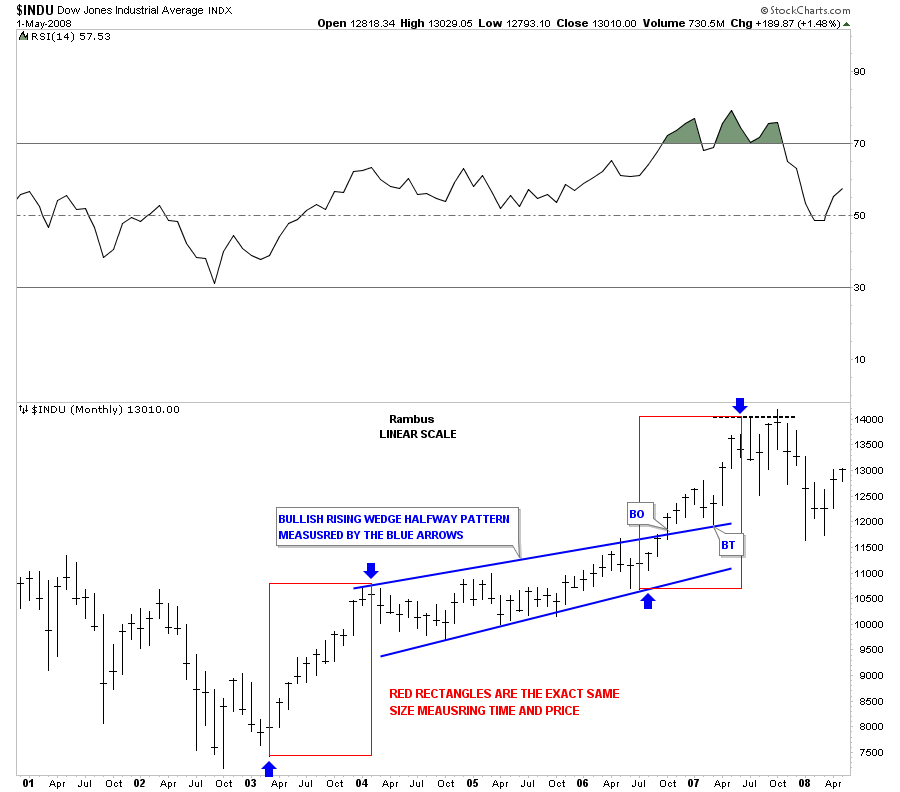
This next chart is a closeup look at the 2002 to 2007 price action that measured out the bullish rising wedge as a halfway pattern.

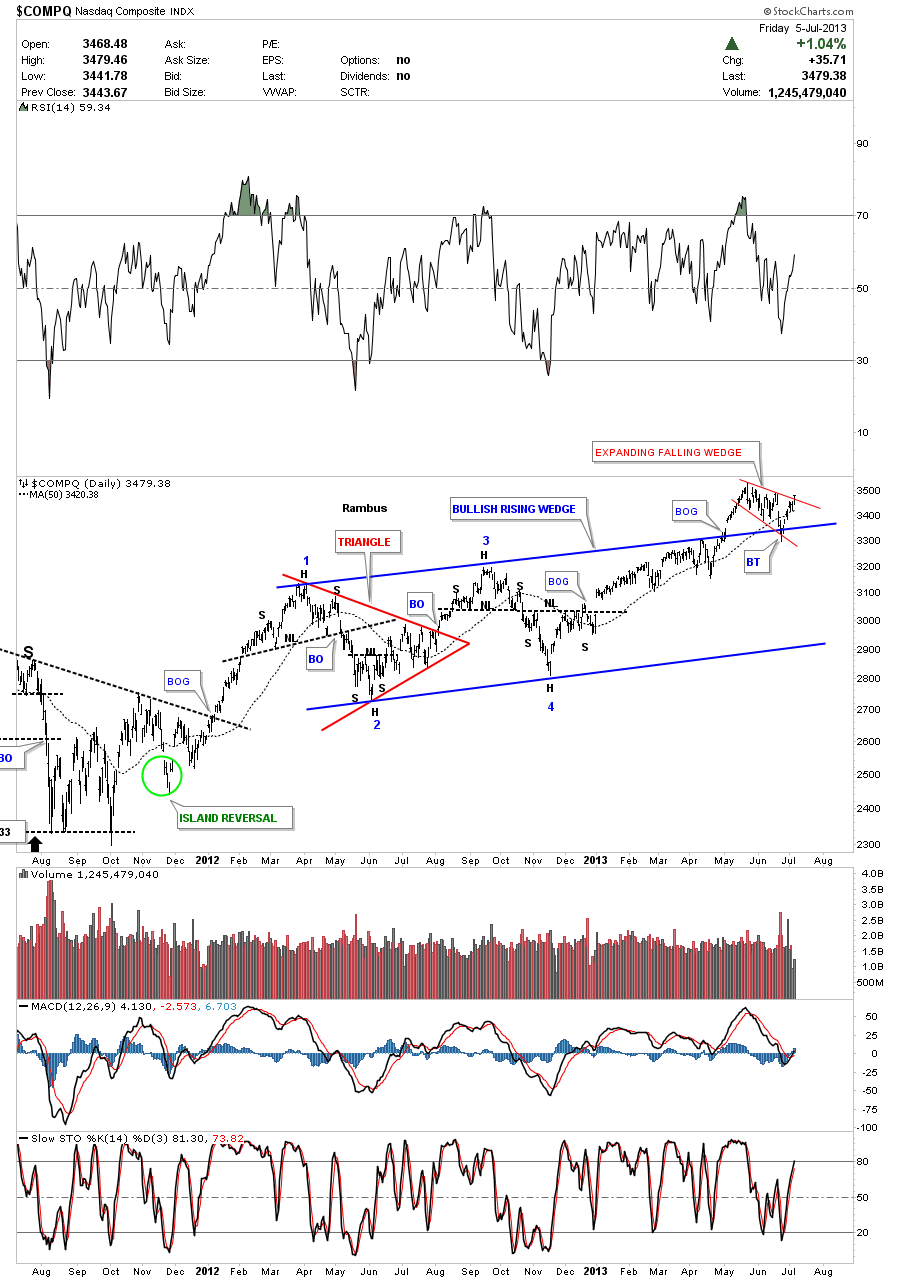
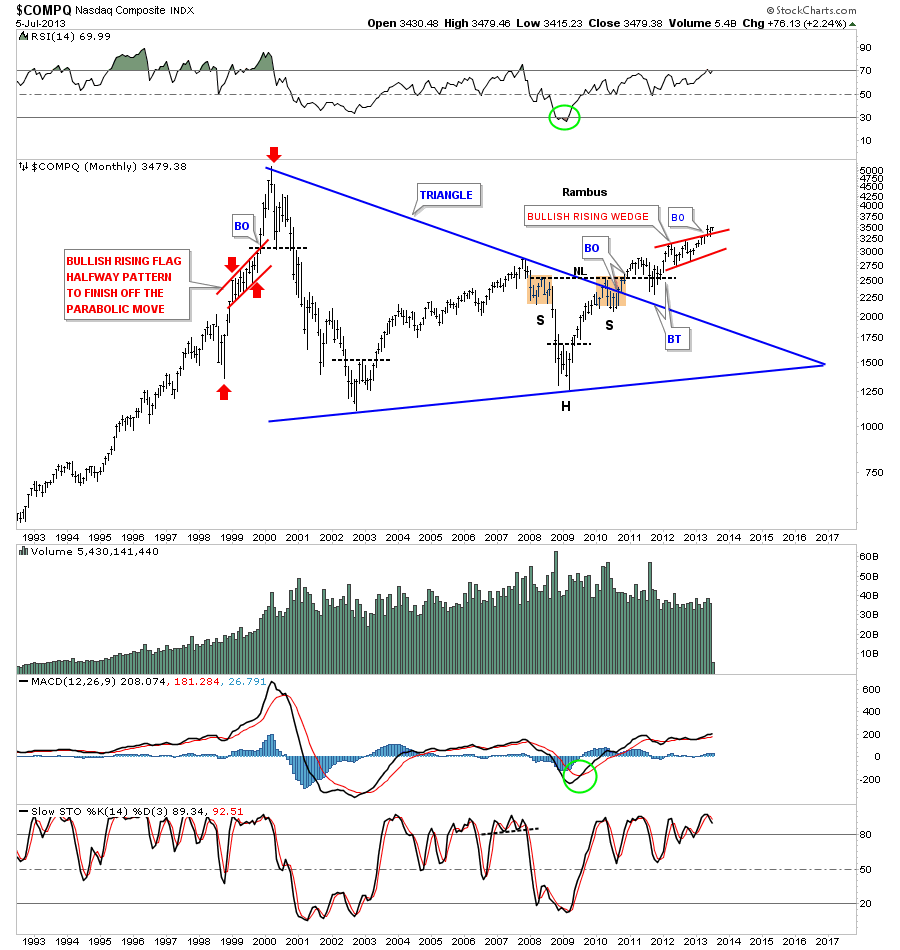
The next chart is the COMPQ that also shows a bullish rising wedge that has broken out and has been in backtest mode for the last month or so. It looks like it is trying to breakout from the red bullish expanding falling wedge that is sitting on the top rail of the blue bullish rising wedge which is normally a bullish setup.

The COMPQ monthly.

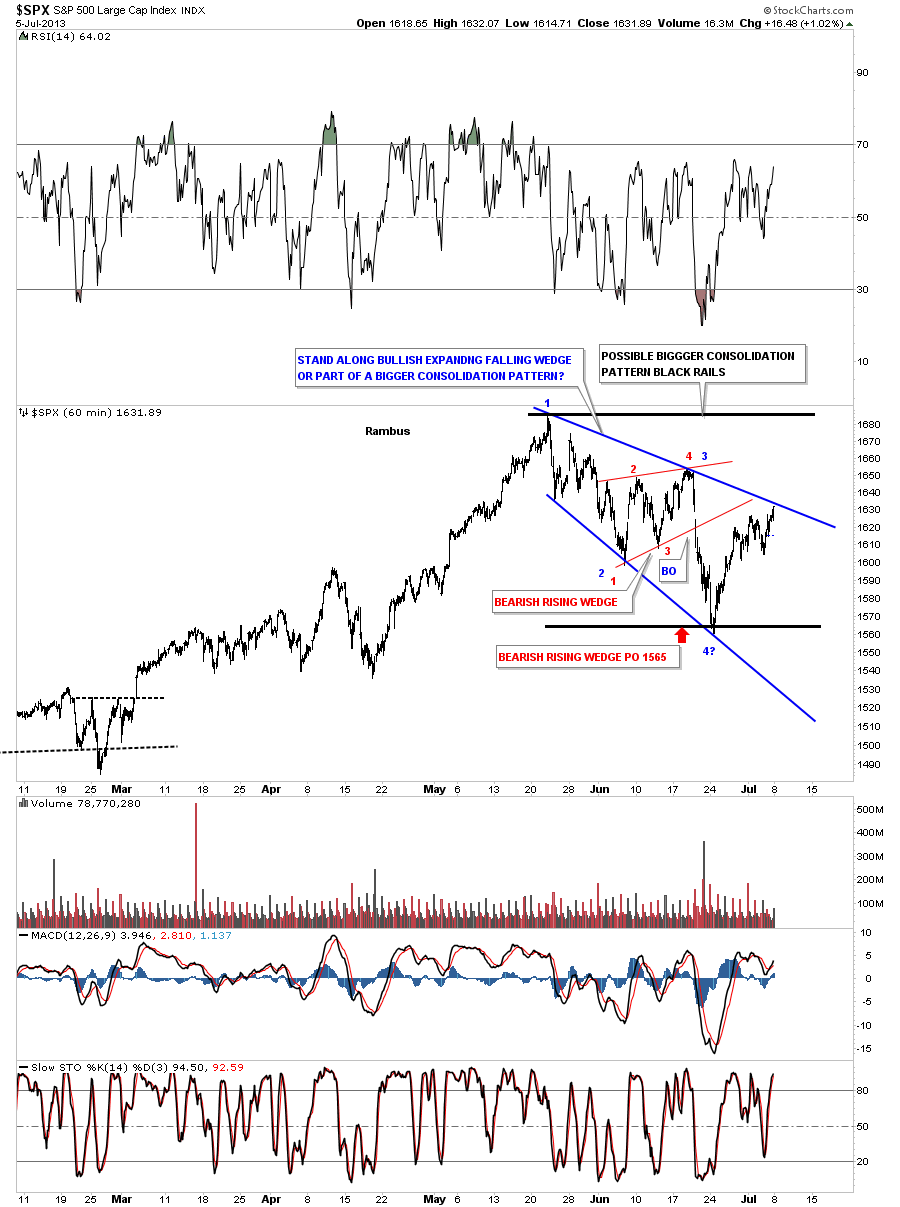
Below is a 60 minute chart for the SPX I showed you several weeks ago as it was still forming its consolidation pattern. As you can see it closed just below the top rail last Friday.

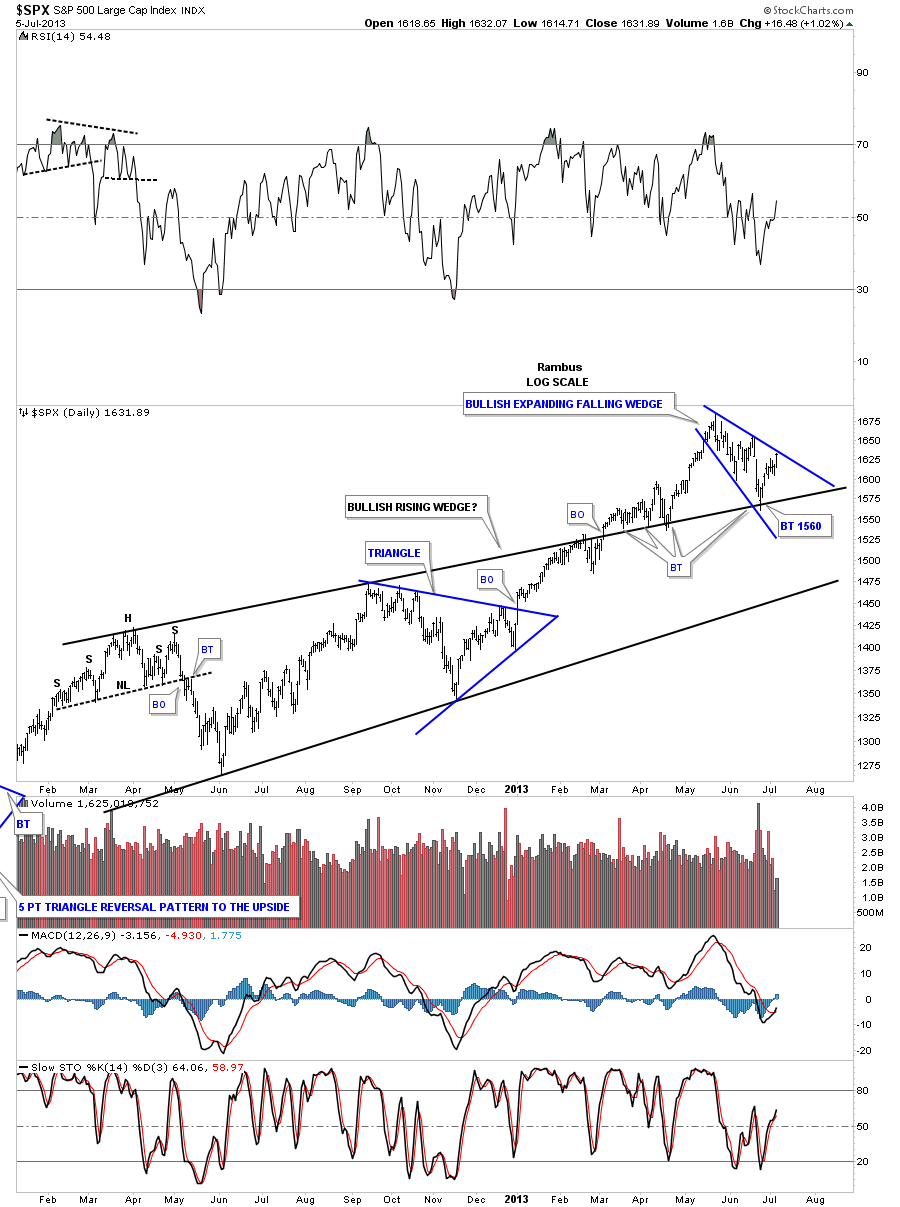
The daily chart shows the bullish rising wedge with the bullish expanding falling wedge as the backtest. If you recall I was looking at 1560 as a potential low on this bar chart. Now it just needs to breakout through the top rail to enter the next leg up.

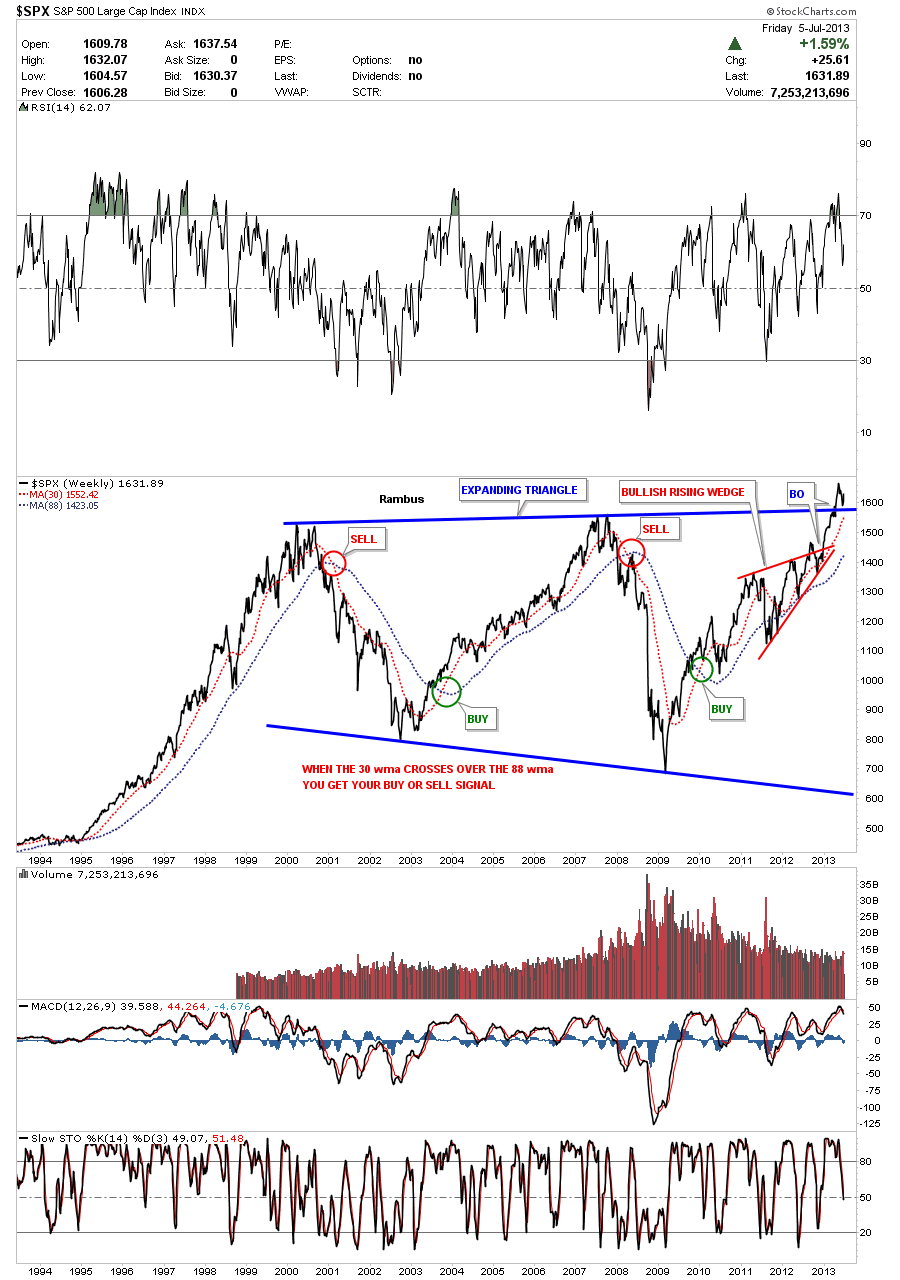
This next chart for the SPX is a weekly line chart that shows the breakout of the 13 year expanding flat top triangle. The backtest here comes in at 1580 or so which has already been tested. Again, as long as the top blue rail holds support nothing is broken and we have to follow the price action where ever it leads us.

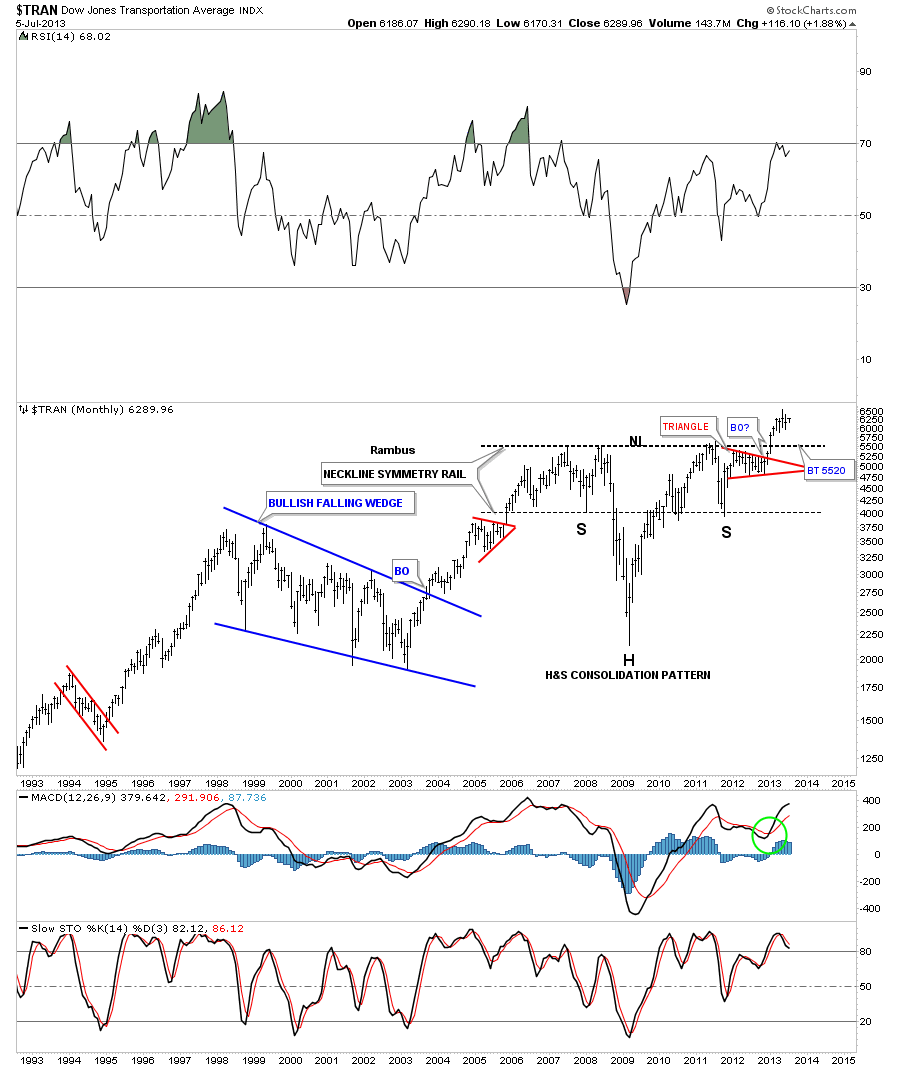
The next chart shows a beautiful H&S consolidation pattern for the transportation index that broke out 6 months or so ago. Nothing is broke here either.

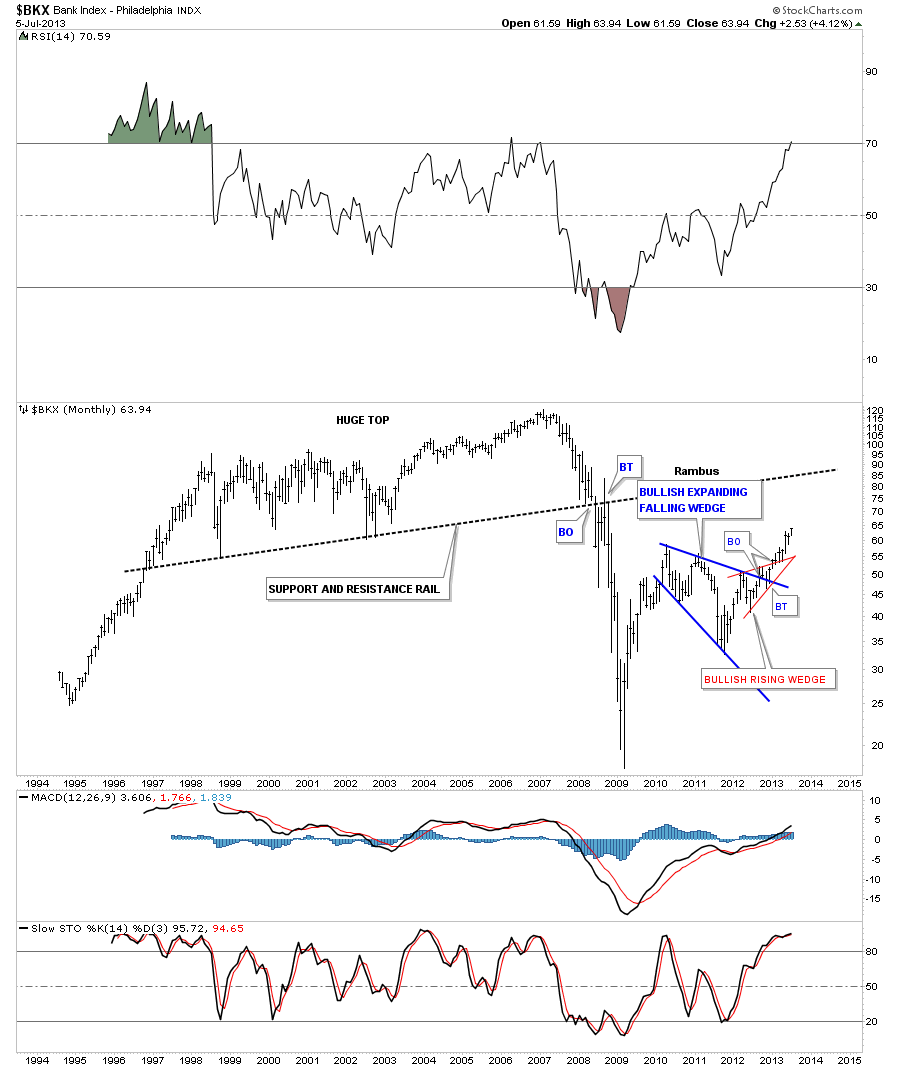
Next I want to update you on some of the indexes that Ive been showing you once a month or so that are still in a bullish mode. The BKX, banking indexes, is still moving as expected after breaking out from the blue bullish expanding falling wedge followed by the red red bullish rising wedge. Note the 11 year support and resistance rail that gave anyone watching this index a huge clue that when the price action broke below the S&R rail a top was in place. You never know for sure how the move down would unfold but with such a big top in place you knew it couldnt be good.

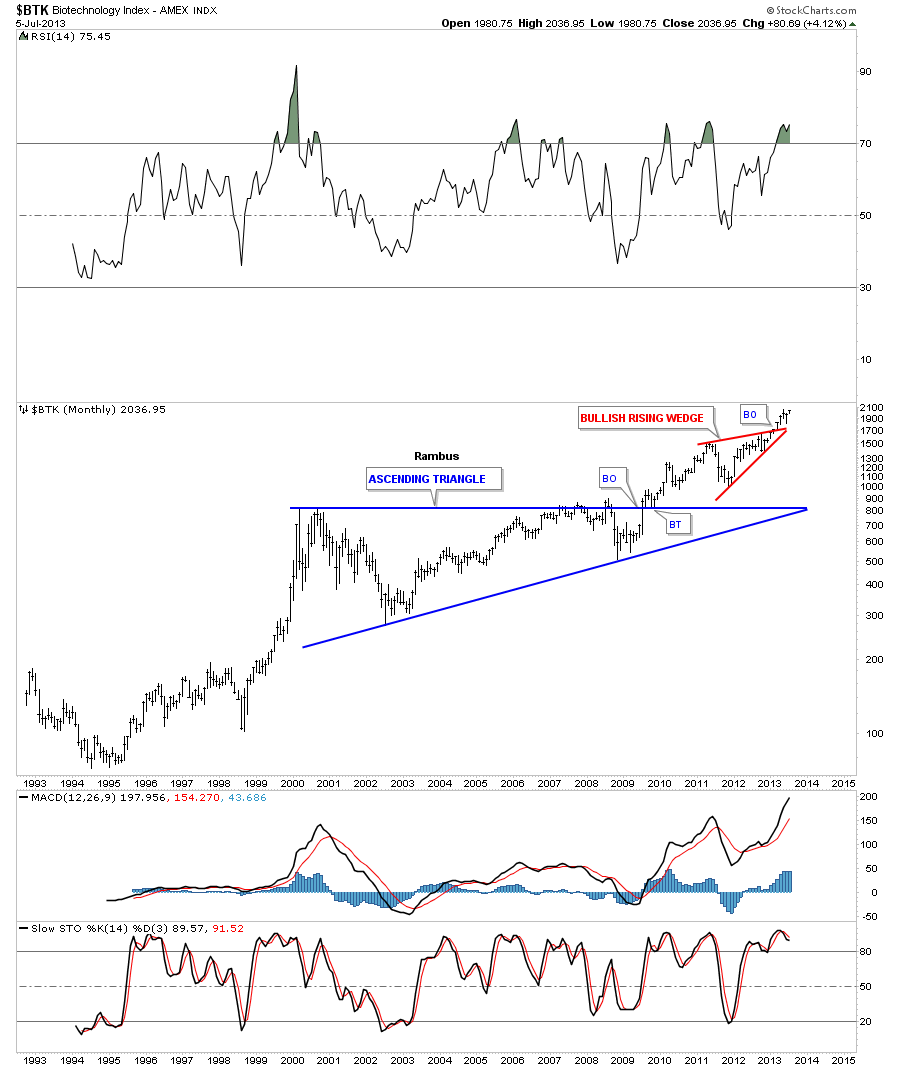
The BTK, biotech index. is still trading above its red bullish rising wedge I showed you when it broke out. Are you beginning to see a theme here with all the bullish rising wedges in play?

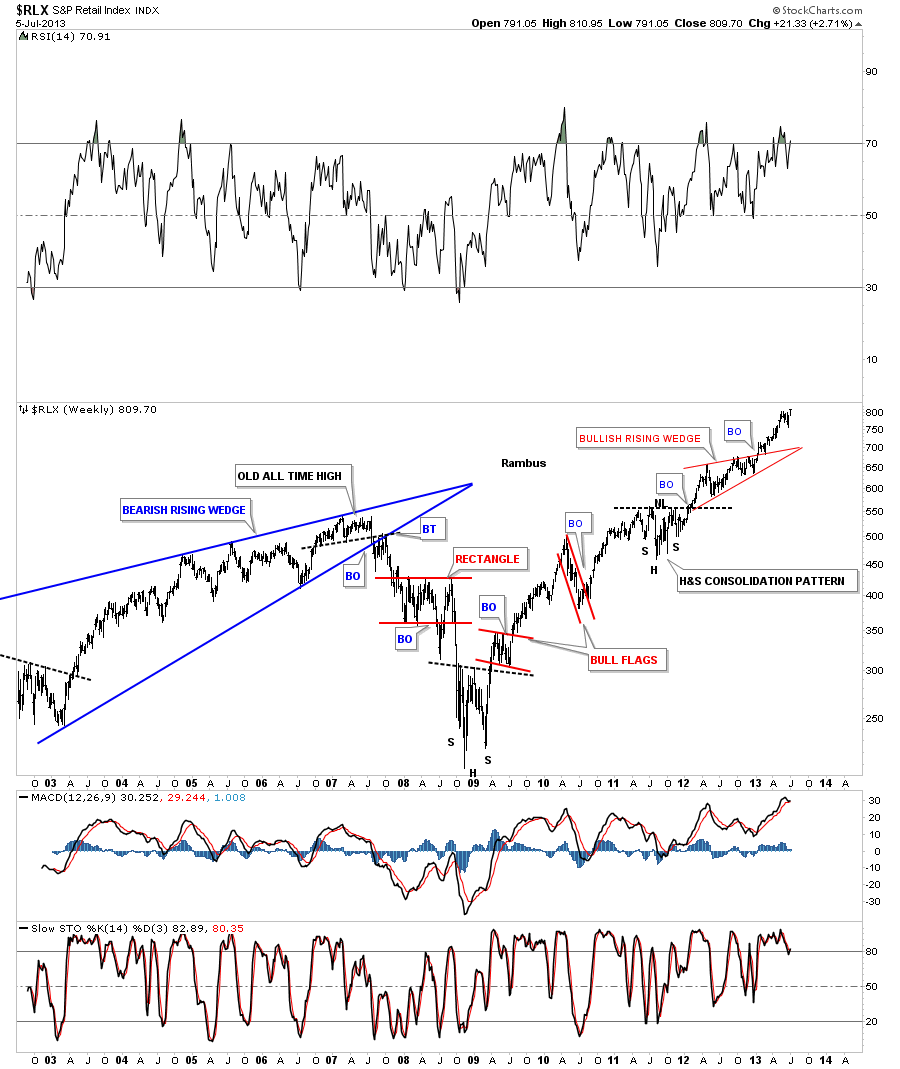
The RLX, retail index, is hitting new all time highs by the looks of this weekly chart. I would think this would have to be bullish for the stock markets. Also another bullish rising wedge that are built in fast moving markets.

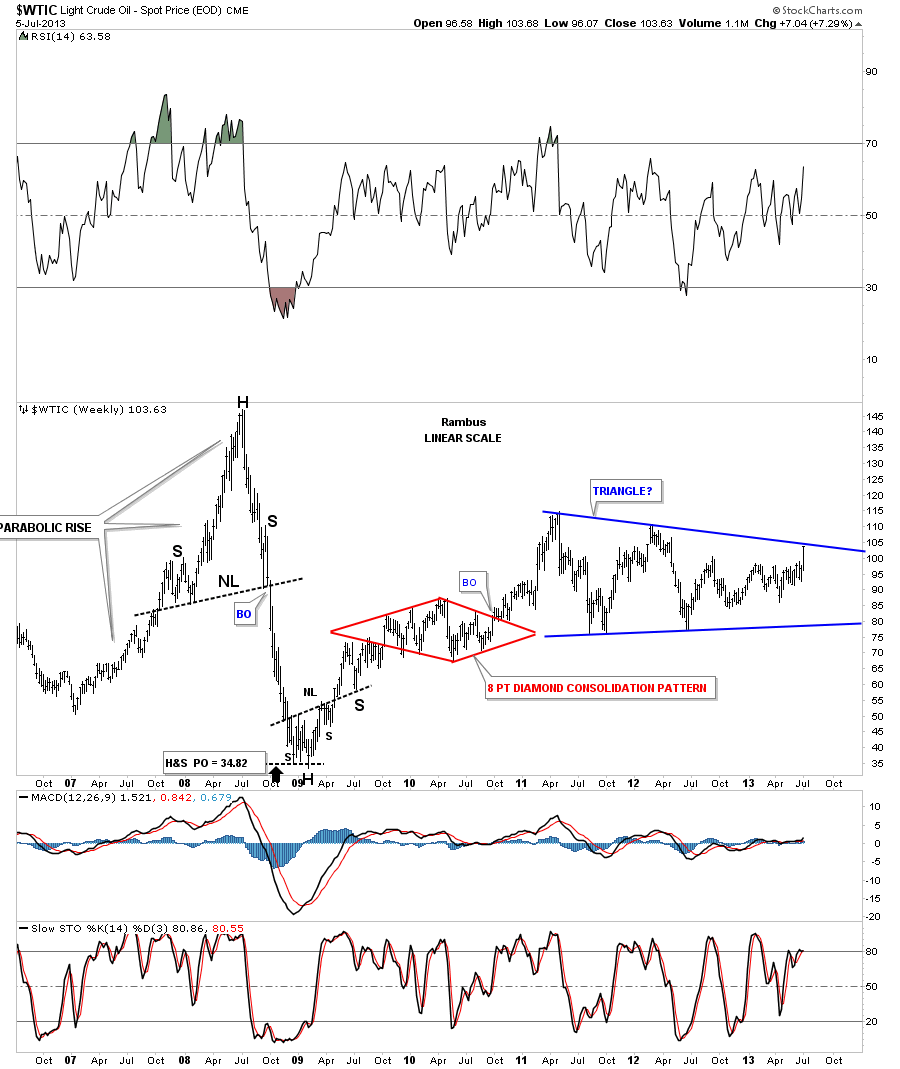
Oil is at a critical juncture right here. Its testing the top rail of the bigger triangle pattern. The moment of truth is now for oil.

Its getting late and I need to get this posted. I hope everyone had a fun filled 4th of July. I know I did. All the best
Rambus
Editors Note :
Free Trial www.rambus1.com
-- Posted Tuesday, 9 July 2013 | Digg This Article | Source: GoldSeek.com


