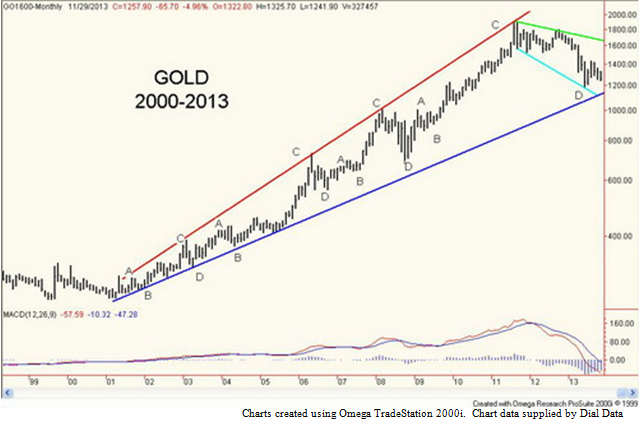
In case anyone is wondering, the long-term bull for gold remains intact. However, it sure doesnt feel like it. The daily trend is down, the weekly trend is down and the monthly trend is down. So how can the long-term bull remain intact? It is based on the long-term uptrend line from the 2001 lows near $250. Thus far, the steep correction that got underway in September 2011 has not broken the uptrend line. But it is testing it.
The long and steep correction in gold since September 2011 has been strange to say the least. Eric Sprott the founder of Sprott Asset Management LP and a well-known gold investor was asked recently How did we miss the top of the market in 2011? Why wasnt someone pounding the table to sell precious metals and precious metals equities? Erics response was With the benefit of hindsight, anyone can say that we all should have been selling in 11. But we stayed in because the facts at the time seemed indicative of more growth, not a peak and subsequent decline.
I held a similar view at the time and continued to hold that view through the next 15 months of a back and forth correction that ranged roughly from $1,550 to $1,800. The Fed ended QE2 in June 2011. The stock market reacted by going into a bit of a free fall in August 2011. Gold did not fall at least initially. Gold kept going up even as the stock market fell. Gold made a top on August 23, 2011 then put in a mini-plunge before rebounding back to make a secondary slightly higher top on September 6, 2011. What followed was a nasty plunge into October 2011. QE3 was announced on September 13, 2011 shortly after gold topped. But gold still fell. Many of us believed another round of QE was bullish for gold and that after a correction gold would resume its upward path. Gold put in a strong run-up towards $1,800 into February 2012 then following another pullback another strong run-up towards $1,800 was seen into October 2012. Gold did not return to the highs of August/September 2011 but appeared up until that time to be forming a classic ABCDE type of symmetrical triangle correction. In hindsight, was something more at play?
Then came April 12, 2013 and someone offered 400 tonnes (some say 500 tonnes) of June gold futures at the open of trading. It was paper gold, not physical but it didnt matter; the market panicked. The market has not recovered since. Some have suggested that it was the request for the return of gold held at various central banks that triggered the sell-off. The first request was made on August 24, 2011 by Venezuela for its gold back from the Bank of England as well as smaller amounts held in Canada and the US. In total, it was roughly 200 tonnes of gold. The gold was apparently delivered. The request for the return of the Venezuelan gold coincided with the top in gold seen on August 23, 2011. At the time, it was not clear that the two events might have been connected.
The second request came from Germany in January 2013 when they asked for 300 tonnes of their gold back that was being held primarily at the NY Fed. The Germans were told it would take seven years to deliver the gold. The gold market was stunned. How could it take seven years if it is held primarily in the vaults of the NY Fed? At best, it is couple of jumbo jets. Unless the gold is not there. This should have been quite bullish for gold. Gold initially drifted. Then came April 12, 2013.
Janet Yellen at her recent Congressional hearings was asked her views on the price of gold. Her response was rather odd. She believed that no one had a good model of what the fundamental value of gold is or should be, but that certainly it is an asset that people want to hold when theyre very fearful about potential financial market catastrophe or economic troubles. . . . When there is financial market turbulence, often we see gold prices rise."
I say that was an odd response given that most every central bank in the world including the Federal Reserve holds gold as a reserve asset right alongside US Treasuries and other sovereign securities. The US still holds the worlds largest reserves of gold. While some central banks especially European ones reduced their gold holdings in the 1990s and in the early years of the current century more recently central banks had once again become net buyers of gold. Russia and China have been the leaders but many others especially some Asian countries have been adding to their gold reserves. What was different during the 1990s and has continued to date is that a number of central banks leased gold held in their vaults to the bullion banks. It is generally believed that the leased central bank gold was subsequently sold into the market and the proceeds invested in higher yielding securities. This became known as the gold carry trade.
Gold, silver and platinum are all headed for their first annual loss since the precious metals made their final lows in 2001. Not even 2008 the year of the financial crash saw precious metals decline. One of the prime reasons given for the decline has been the constant rattling that the Fed will taper QE3 by reducing its monthly purchase program currently at $85 billion a month. The FOMC October minutes released this week once again suggested that the Fed could scale back its purchase program at one of its next few meetings provided this was warranted by economic growth.
The reaction in the markets was probably predictable as the stock market fell, precious metals fell and interest rates rose. That is hardly what the Fed wants to see. It was a strange reaction given that most economists do not expect the Fed to act until after the budget and debt ceiling negotiations are completed in January/February. As well, incoming Fed Chairman Janet Yellen is a well-known dove who has sometimes hinted that the QE program should be expanded. Current Fed Chairman Bernanke is on record saying interest rates (the official Fed rate) should be kept near zero until well after unemployment falls under 6.5%. None of this squares with todays response in the markets. As well, it is only prudent that the Fed might mention that if conditions warranted it that they may taper.
The belief here is, however, that the Fed is caught in a trap of their own making and it is going to be very difficult to end QE3. Some believe that the real reason for QE3 is to continue to allow the banks to bail themselves out of the problems that caused the financial crash of 2008. It is believed that the banks continue to carry billions of dollars of underwater debt in mortgages, other securitized debt instruments and derivatives. Accounting regulations allow them to carry the debt on their books at original values giving the appearance that the banks could be in better financial shape than they really are.
The broader stock market has been on a bull run. The Dow Jones Industrials (DJI), Dow Jones Transportations (DJT), S&P 500 and NASDAQ have all made new all-time highs (nominal). The TSX Composite remains well off its all-time highs primarily due to the yearlong weakness in Golds, Metals and Materials. Other sectors such as the Consumers, Financials and Industrials have made ongoing 52-week highs. The sharp contrast in the markets has resulted in a huge outflow from the material groups and into the broader stock market in 2013. In a classic sense that is the public leaving the weak market at a possible bottom and jumping into the rising market at a possible top.
The collapse in gold prices has seen a huge outflow from world-wide gold backed ETP holdings as tracked by Bloomberg. It is estimated that some 24.6 million ounces have exited ETF products in 2013. On the other side there has been record inflows and purchases in Hong Kong and Shanghai. Many believe there has been a huge transfer of wealth from the West to the East in 2013. Gold related funds have also seen large withdrawals in 2013. These funds have instead been redeployed in other equity and bond funds. Fund companies in the gold and commodity business have shed staff and curtailed operations as a result of the outflow of funds.
COMEX gold stockpiles have seen a huge drop in 2013. Registered gold stocks that are eligible for delivery have fallen from a peak of 3 million ounces to 590 thousand ounces thus far in 2013. It is unknown as to where the gold stockpiles have gone. Even eligible gold stocks that are not available for delivery have fallen in 2013 from a peak of 9 million ounces to 6.6 million ounces. Some believe that given the precipitous drop in registered gold stocks available for delivery that a default could happen at the COMEX.
The huge drop in gold prices in 2013 has made numerous gold mining operations marginal. It is estimated that average costs for numerous gold miners is in the $1,200 to $1,300 range. Many producing gold mining companies have seen their stocks fall to a level that gives very little value to their gold reserves. Some junior mining exploration companies have curtailed operations in order to preserve cash. Few companies are raising the necessary capital required to enhance and expand drilling programs. Some junior exploration companies have closed their doors. Statistics indicate that gold mining production could actually fall in 2014 and with fewer new mines coming on stream, this suggests the potential for a supply squeeze at some point in the future.
JP Morgan Chase (JPM-NYSE) recently settled claims with the US government over its troubled mortgages in paying a record $13 billion fine. The Justice Department noted that this settlement did not absolve JP Morgan or its employees from facing possible criminal charges. The settlement of the troubled mortgages is the latest in a long line of settlements major international banks have made over the past few years with regard to market manipulation in LIBOR, currencies, energy and metals.
There is currently an investigation into numerous large banking institutions including JP Morgan and Goldman Sachs for currency-market manipulation. Yet when one raises questions about manipulation in the gold market, gold market participants are accused of being conspiracy theorists. As noted 400 tonnes of gold futures (worth roughly $20 billion at the time) was offered into the market at the open of trading on April 12, 2013. The reason for the huge unprecedented short sale and who was behind it remains a mystery.
Some believe the Fed itself may have been behind the sale while others suspect a bullion bank. There have been rumours that a bullion bank and maybe more than one was in trouble at the highs of September 2011 because of short positions in physical gold. The repatriation of the Venezuelan gold may have triggered a panic amongst the bullion banks particularly if they were short physical gold. As a result, they may have been unable to deliver on leases with central banks who could have asked for their leased gold back to deliver to countries such as Venezuela. By pushing the price of gold down with a huge short sale would allow the bullion banks to replace their short physical gold position at considerably lower prices.
Gold appears to be in a huge rare bullhorn pattern since 2001. The labeling (ABCD) comes from the Aden Sisters. The market appears to still be in the D wave decline that could still see gold fall to new lows closer to $1,100. It is also possible that the wave up from the June 2013 lows was the A wave and this is the B wave of a new series of ABCD. A break to new lows under $1,183 would, however, end any thought of that pattern and shift the focus to the potential completion of the D wave down.
If the bullhorn pattern is correct, however, then once this current correction is over gold could embark on a new bull up move. The reasons for holding gold have never changed. The debt levels of the western economies continue to grow and all the major western economies (the US, the Euro zone and Japan) appear to be committed to QE in an attempt to reflate their economies. Their efforts thus far have at best resulted in lethargic slow growing economies leaving them vulnerable to future economic shocks. Unemployment remains high particularly in the Euro zone. Talk of the taper is just that talk. The reality is there has been little in the economic numbers to encourage an easing of the current program of QE.
It has been a long difficult year for those in the gold and materials market. High negative sentiment suggests that the market could soon be at a turning point. As well the proximity to major long term support also suggests that the market could well be close to a turning point. This may not prevent the market from falling further in the short term. Potential objectives could be nearby at $1,225 but gold could also fall to $1,150 and even near $1,100 in a worst-case scenario. Short term a close above $1,280 would be positive but close above $1,350 may suggest that the final low is in. The long term fundamentals remain positive while the bullhorn chart is suggesting that low could soon be at hand.
TECHNICAL SCOOP
CHART OF THE WEEK
Charts and commentary by David Chapman
26 Wellington Street East, Suite 900, Toronto, Ontario, M5E 1S2
The information and opinions contained in this report were prepared by MGI Securities. MGI Securities is owned by Jovian Capital Corporation (Jovian) and its employees. Jovian is a TSX Exchange listed company and as such, MGI Securities is an affiliate of Jovian. The opinions, estimates and projections contained in this report are those of MGI Securities as of the date of this report and are subject to change without notice. MGI Securities endeavours to ensure that the contents have been compiled or derived from sources that we believe to be reliable and contain information and opinions that are accurate and complete. However, MGI Securities makes no representations or warranty, express or implied, in respect thereof, takes no responsibility for any errors and omissions contained herein and accepts no liability whatsoever for any loss arising from any use of, or reliance on, this report or its contents. Information may be available to MGI Securities that is not reflected in this report. This report is not to be construed as an offer or solicitation to buy or sell any security. The reader should not rely solely on this report in evaluating whether or not to buy or sell securities of the subject company.
Definitions
Technical Strategist means any partner, director, officer, employee or agent of MGI Securities who is held out to the public as a strategist or whose responsibilities to MGI Securities include the preparation of any written technical market report for distribution to clients or prospective clients of MGI Securities which does not include a recommendation with respect to a security.
Technical Market Report means any written or electronic communication that MGI Securities has distributed or will distribute to its clients or the general public, which contains a strategists comments concerning current market technical indicators.
Conflicts of Interest
The technical strategist and or associates who prepared this report are compensated based upon (among other factors) the overall profitability of MGI Securities, which may include the profitability of investment banking and related services. In the normal course of its business, MGI Securities may provide financial advisory services for issuers. MGI Securities will include any further issuer related disclosures as needed.
Technical Strategists Certification
Each MGI Securities technical strategist whose name appears on the front page of this technical market report hereby certifies that (i) the opinions expressed in the technical market report accurately reflect the technical strategists personal views about the marketplace and are the subject of this report and all strategies mentioned in this report that are covered by such technical strategist and (ii) no part of the technical strategists compensation was, is, or will be directly or indirectly, related to the specific views expressed by such technical strategies in this report.
Technical Strategists Trading
MGI Securities permits technical strategists to own and trade in the securities and or the derivatives of the sectors discussed herein.
Dissemination of Reports
MGI Securities uses its best efforts to disseminate its technical market reports to all clients who are entitled to receive the firms technical market reports, contemporaneously on a timely and effective basis in electronic form, via fax or mail. Selected technical market reports may also be posted on the MGI Securities website and davidchapman.com.
For Canadian Residents: This report has been approved by MGI Securities which accepts responsibility for this report and its dissemination in Canada. Canadian clients wishing to effect transactions should do so through a qualified salesperson of MGI Securities in their particular jurisdiction where their IA is licensed.
For US Residents: This report is not intended for distribution in the United States.
Intellectual Property Notice
The materials contained herein are protected by copyright, trademark and other forms of proprietary rights and are owned or controlled by MGI Securities or the party credited as the provider of the information.
Regulatory
MGI SECURIITES is a member of the Canadian Investor Protection Fund (CIPF) and the Investment Industry Regulatory Organization of Canada (IIROC).
Copyright
All rights reserved. All material presented in this document may not be reproduced in whole or in part, or further published or distributed or referred to in any manner whatsoever, nor may the information, opinions or conclusions contained in it be referred to without in each case the prior express written consent of MGI Securities Inc.
The content on this site is protected
by U.S. and international copyright laws and is the property of GoldSeek.com
and/or the providers of the content under license. By "content" we mean any
information, mode of expression, or other materials and services found on GoldSeek.com.
This includes editorials, news, our writings, graphics, and any and all other
features found on the site. Please contact
us for any further information.
Live GoldSeek Visitor Map | Disclaimer
The views contained here may not represent the views of GoldSeek.com, Gold Seek LLC, its affiliates or advertisers. GoldSeek.com, Gold Seek LLC makes no representation, warranty or guarantee as to the accuracy
or completeness of the information (including news, editorials, prices, statistics,
analyses and the like) provided through its service. Any copying, reproduction
and/or redistribution of any of the documents, data, content or materials contained
on or within this website, without the express written consent of GoldSeek.com, Gold Seek LLC,
is strictly prohibited. In no event shall GoldSeek.com, Gold Seek LLC or its affiliates be
liable to any person for any decision made or action taken in reliance upon
the information provided herein.