-- Posted Monday, 2 December 2013 | | Disqus
By Rambus
Its been several months since we took an indepth look at some of the more important currencies in the world. In this Weekend Report I would like to show you some important developments that have taken place that could be signalling a stronger US dollar maybe in the cards. Most of the currencies have been in a prolonged topping or consolidation pattern which some broke down awhile ago and some are still consolidating.
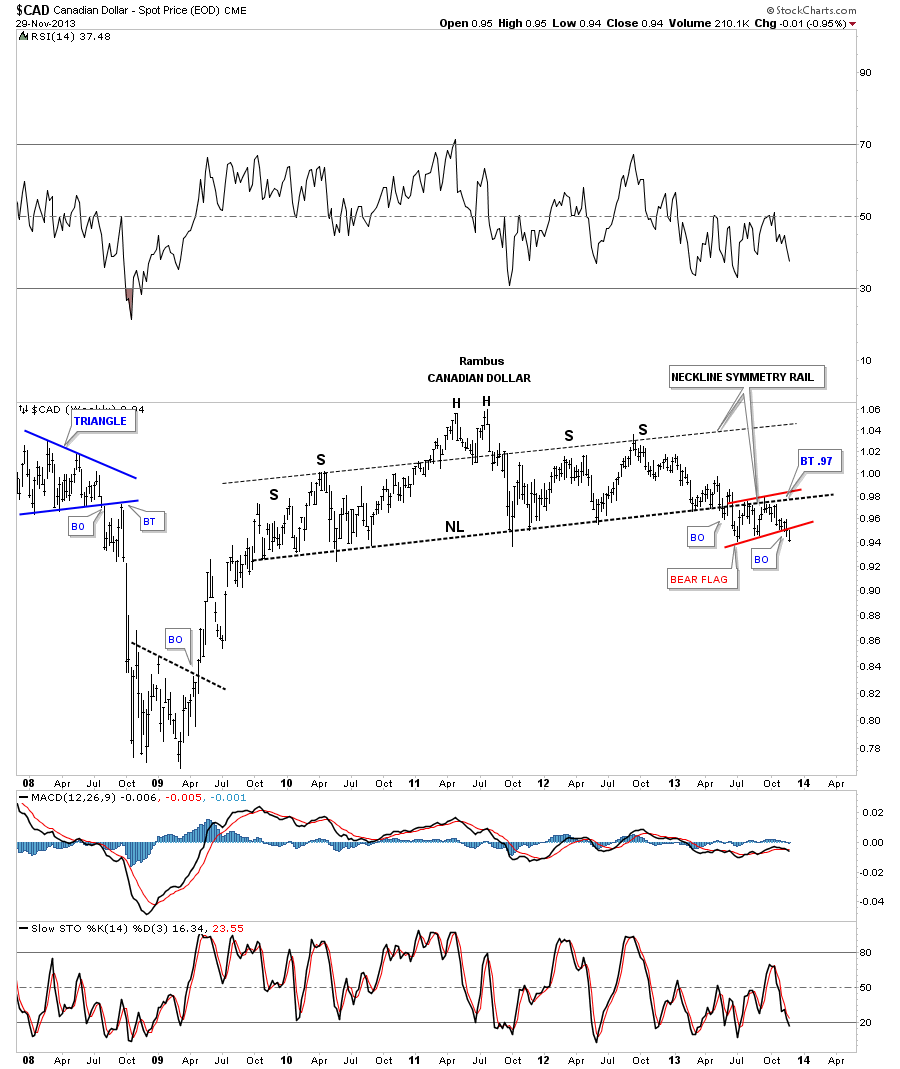
Lets start with the CAD, Canadian Dollar that has been showing a beautiful H&S top formation that broke down in May and has been in backtest mode ever since. The backtest took on the formation of a small red bear flag that finally broke through the bottom rail this past week. The last time I posted this chart I said it was a mirror image of the HUI weekly H&S top, complete with the neckline symmetry rail, that showed us the height for the right shoulder. Like the HUI this is a very large topping pattern that is going to be in play for sometime to come.

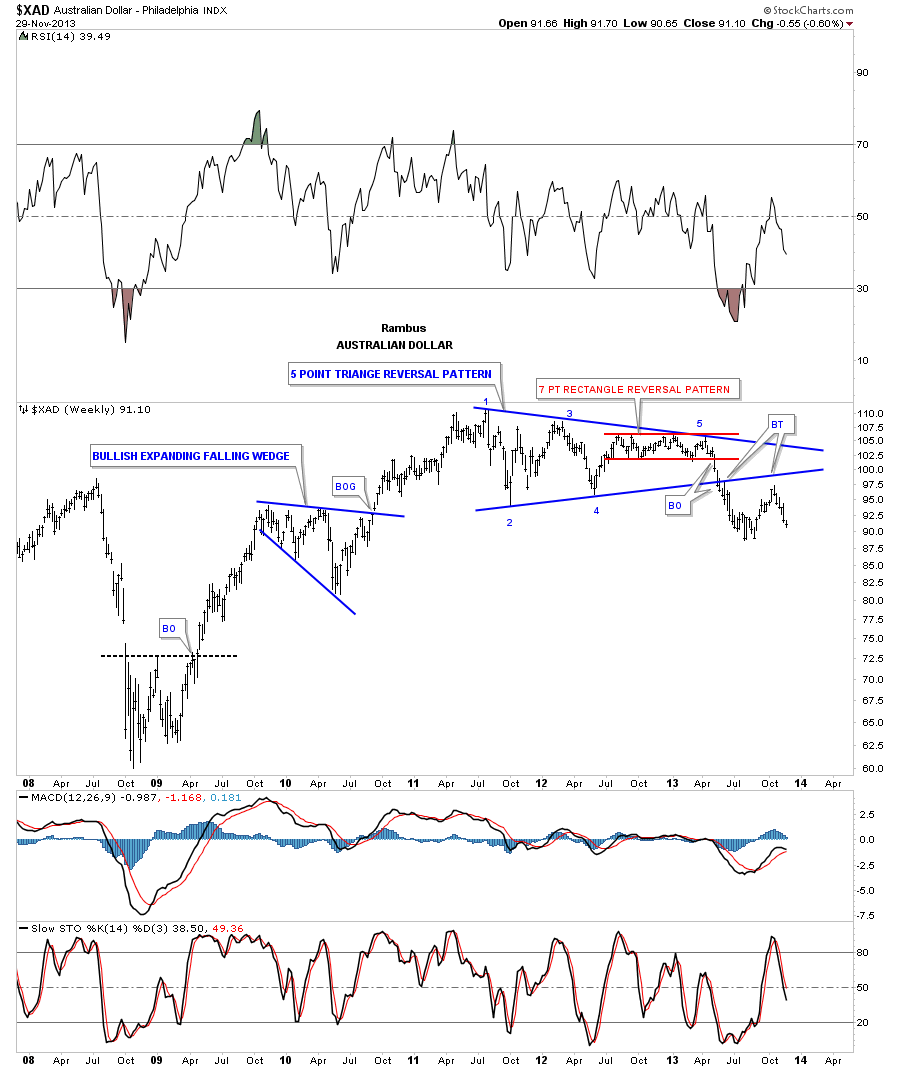
The XAD, Australian dollar, formed a very nice five point triangle reversal pattern that broke out to the downside in May of this year. Our first big clue that the XAD would break down was the completion of the red 7 point rectangle that formed out toward the apex of the 5 point triangle reversal pattern. As you can see on the chart below, even though you have a nice clean breakout, the backtesting process can take some valuable time to complete. This can be frustrating to live through but it doesnt change the outcome of what that very large triangle reversal pattern represents. Which is a big top.

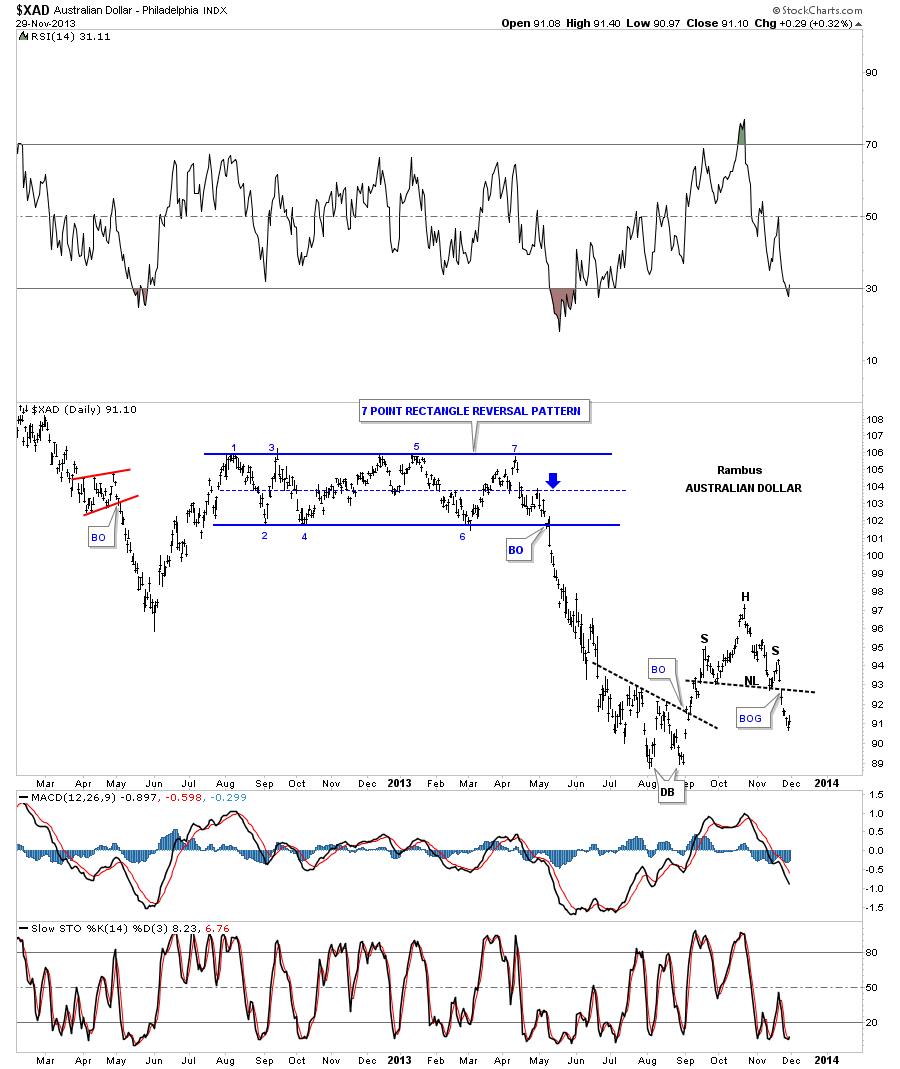
Before we move on lets look at the daily chart for the XAD that shows the beautiful 7 point rectangle reversal pattern. Also note the little H&S that broke out this week signalling the little counter trend rally is now reversing course.

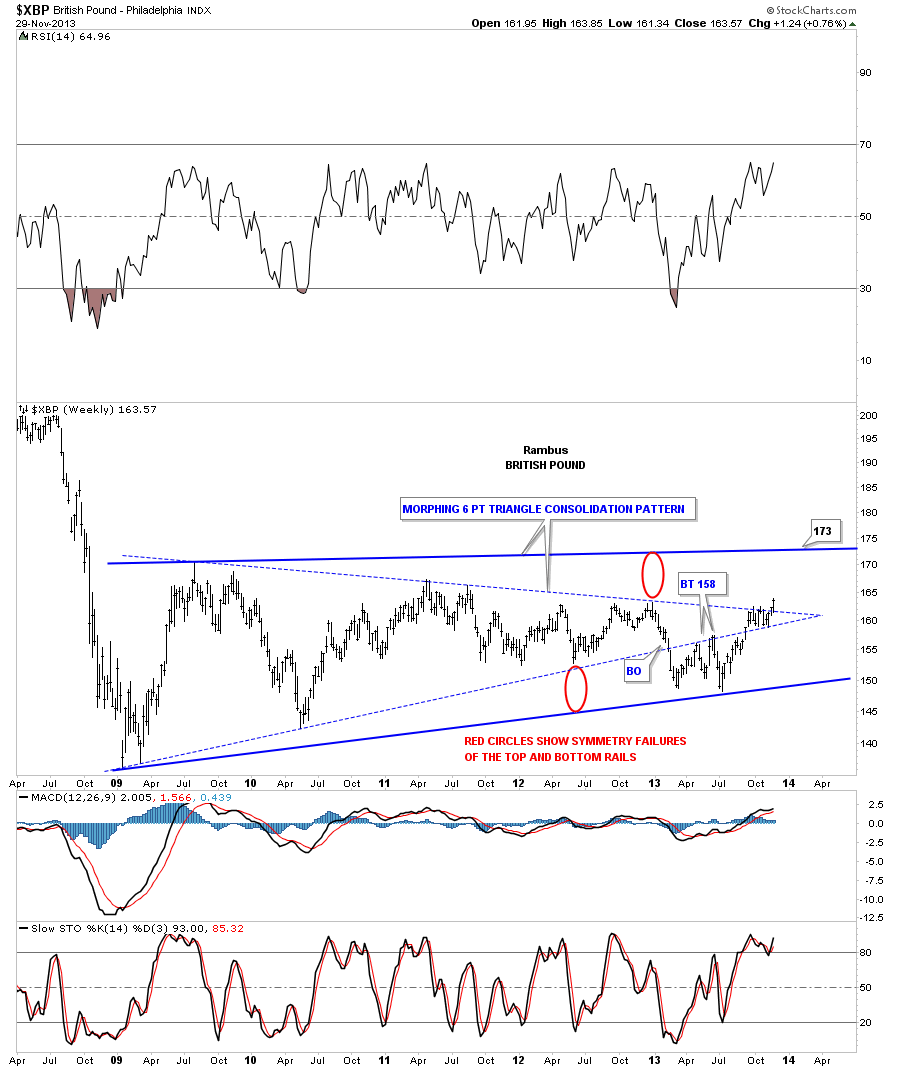
The XBP, British Pound, looks like its morphing into a bigger triangle. The blue dashed trendlines shows the original triangle that had a nice clean breakout through the bottom rail and then the backtest at 158. Once the price action traded back above the bottom blue dashed rail that negated the breakout. As you can see the price action has been chopping very tightly within the apex of the original blue dashed triangle, and then broke out to the topside. The red circles shows you where I would expect the top blue solid rail to be place if this triangle is morphing into a bigger triangle. I showed you this in regards to the Yen awhile back.

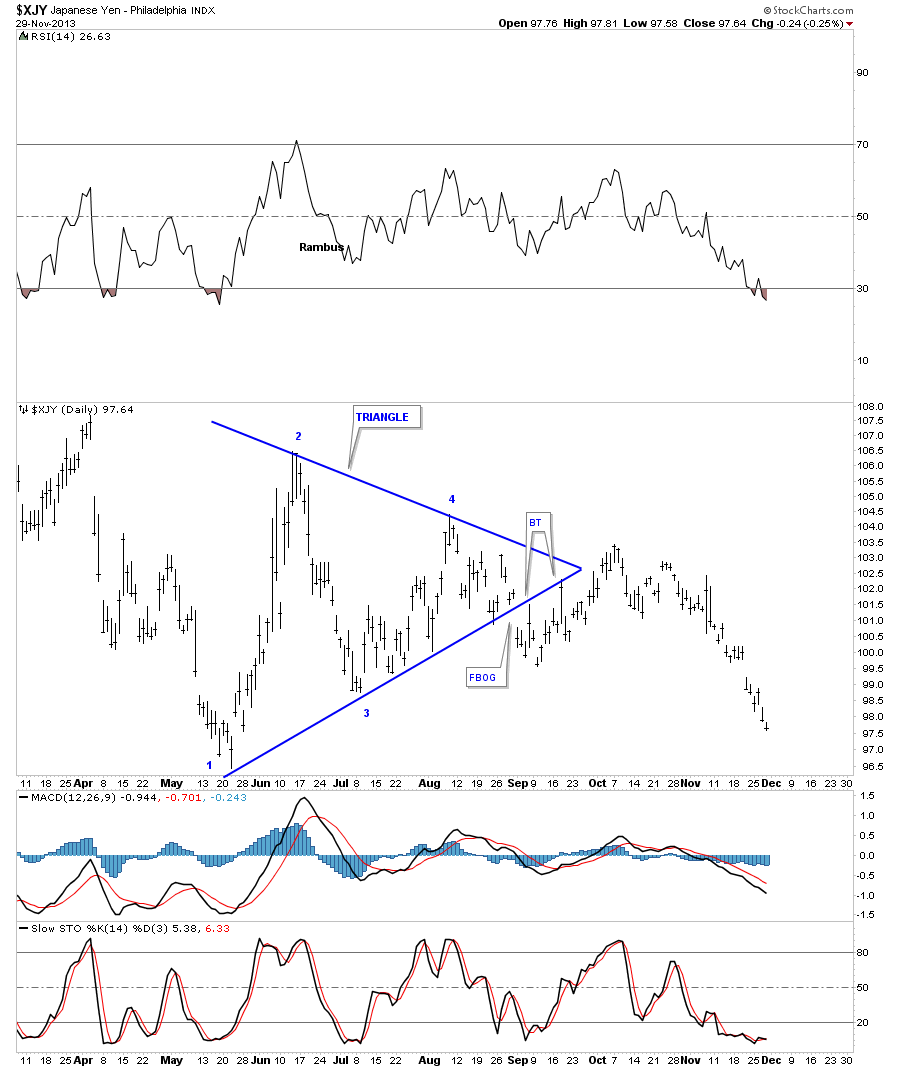
While were on the subject of morphing triangles let look at the Yens morphing triangle and see how it turned out. First, the original triangle on the daily chart. Note the big breakout gap and the two backtests to the bottom rail that looked perfect.

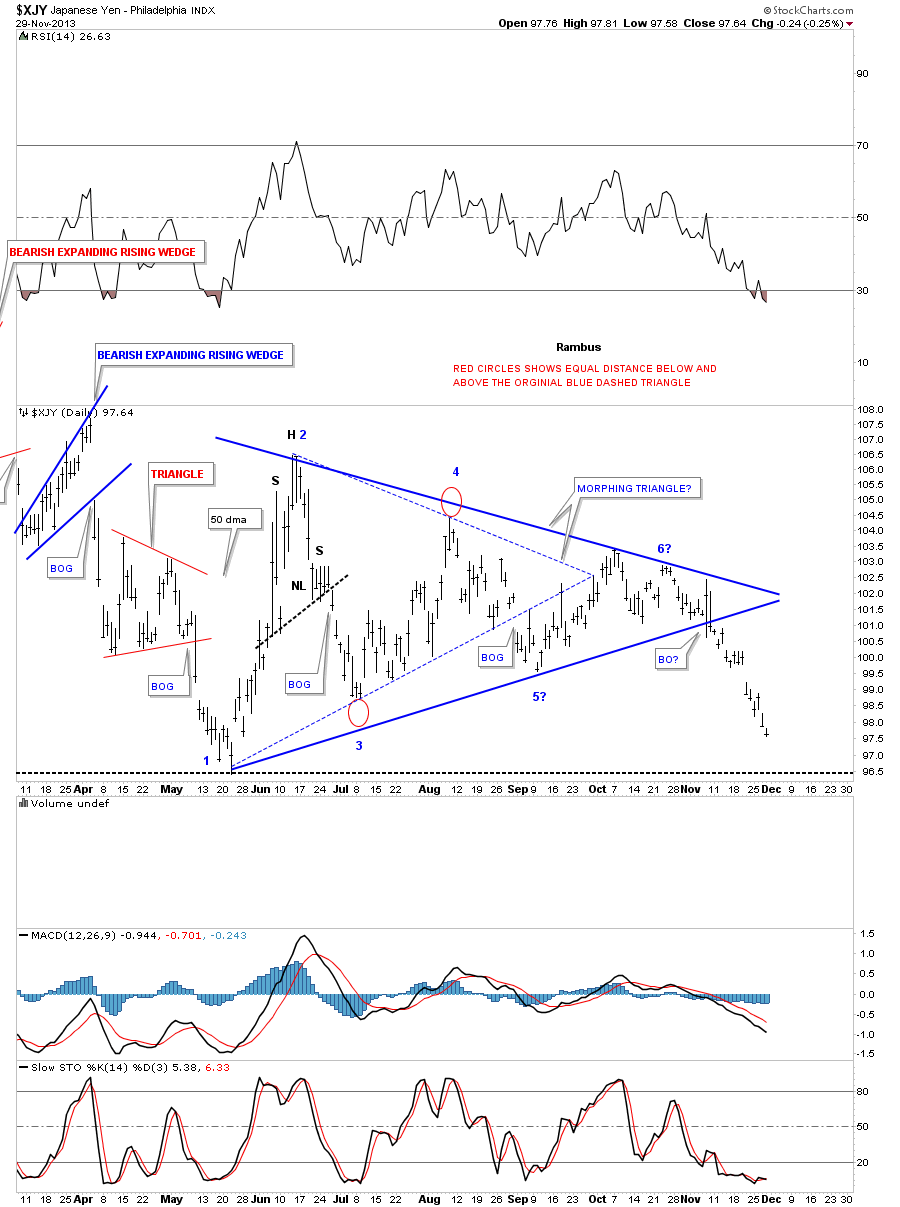
This next chart for the Yen shows how I used the red circles to expand the original blue dashed triangle. Its not a perfect science but normally when you readjust the bottom rail many times the top rail will need to be adjusted by the same amount. Its a symmetry thing. As you can see the top solid rail only morphed about half of the red circle for its high and then the price action reversed back down breaking through the new solid blue rail signalling the triangle was complete. Note the last two long bars that formed at the apex of the new solid blue triangle. That was the final gasp before the triangle finally broke down.

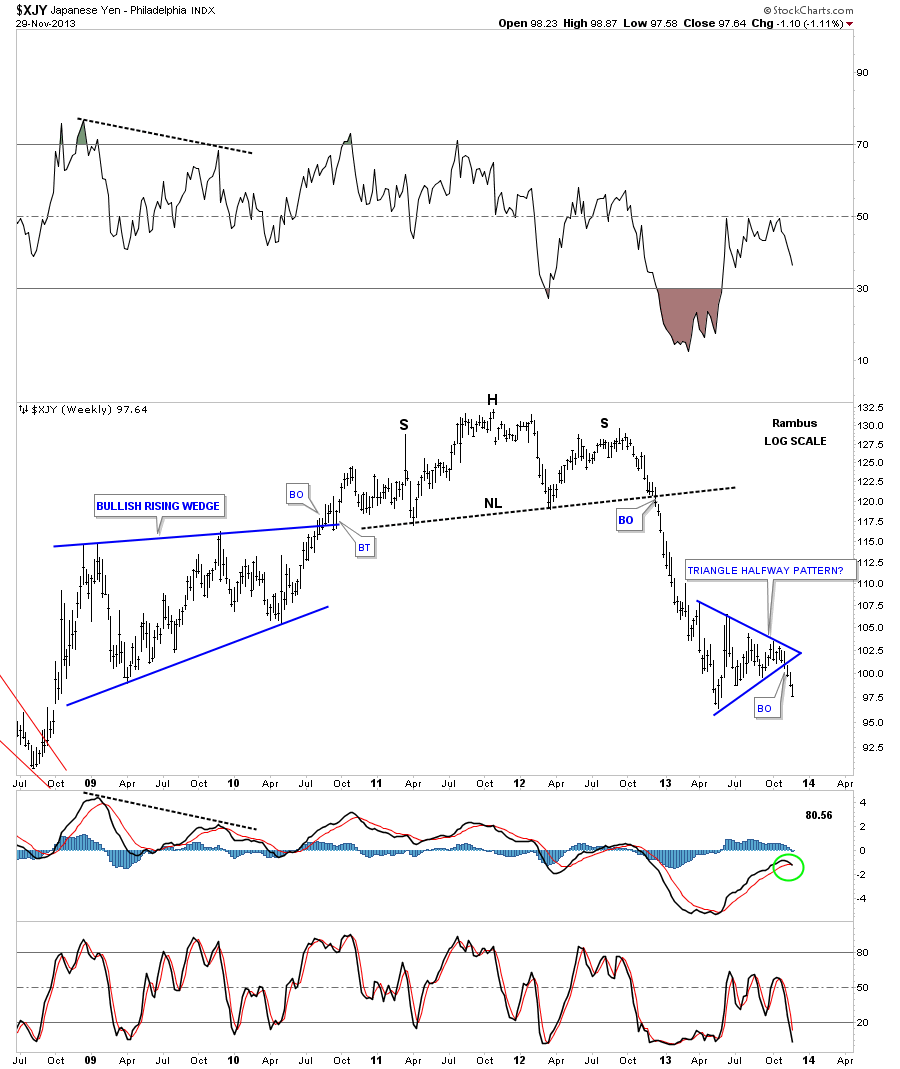
Lets look at a few more charts for the Yen as gold seems to be following the Yen closer than the euro. The Yen made a beautiful H&S top before it broke down that led to a near vertical move lower. Our morphing triangle on the daily chart above shows you why that triangle is so important to the overall big picture. Note the near vertical move down from the breakout of the H&S top into the Blue Triangle. Many times how a move takes place going into a consolidation pattern, a similar move will occur when the price action exits the consolidation pattern. As you can see the Yen has now completed its third week in breakout mode in a near vertical move. Im viewing the blue triangle as a halfway pattern until something tells me differently. This just maybe a coincidence but silver has now traded three weeks below its Diamond consolidation pattern.

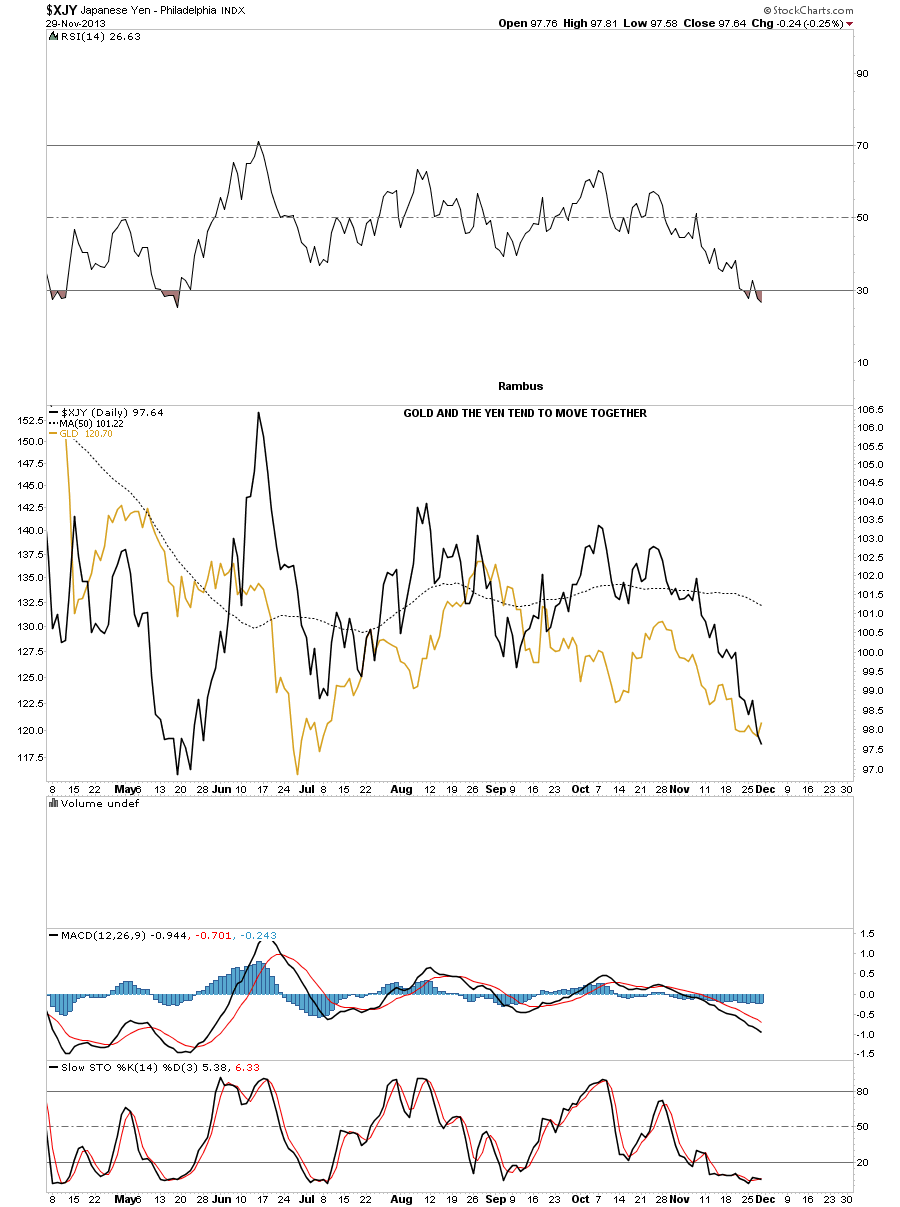
Below is a comparison chart where Ive overlaid gold on top of the Yen. As you can see we are getting a better correlation then if you overlaid gold on top of the euro.

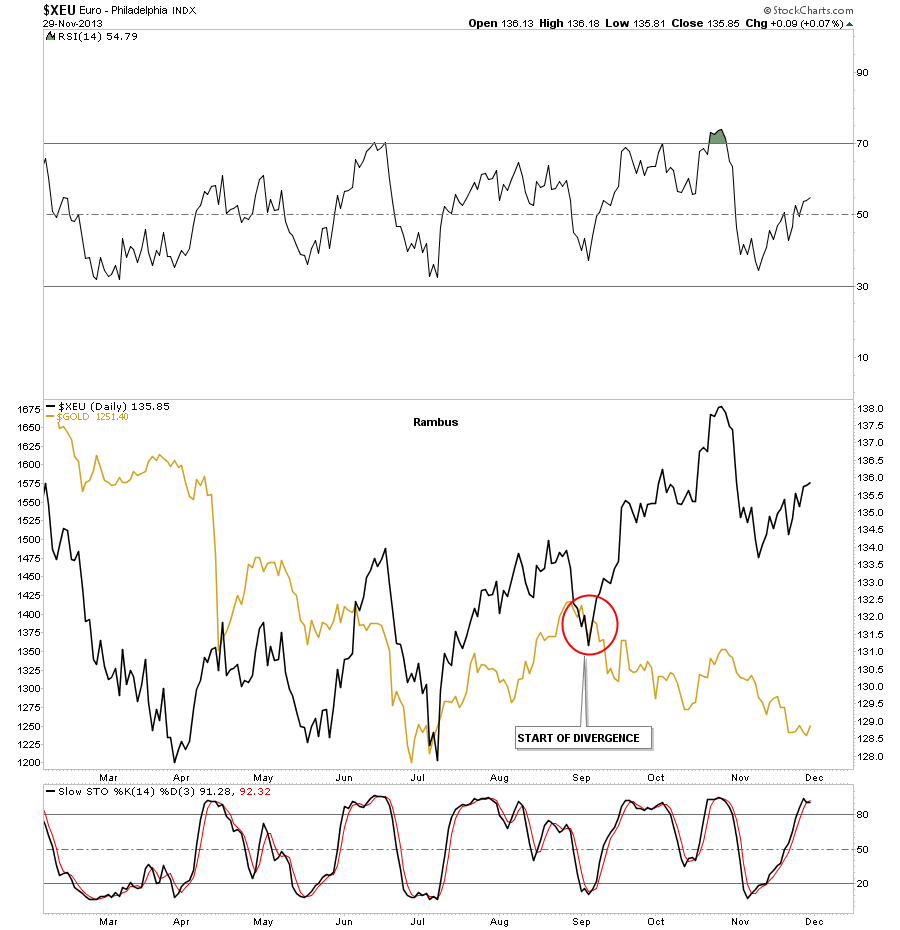
On the chart below Ive overlaid gold on top of the euro that shows a very strong negative correlation starting in September of this year. Up until that point they moved fairly close together.

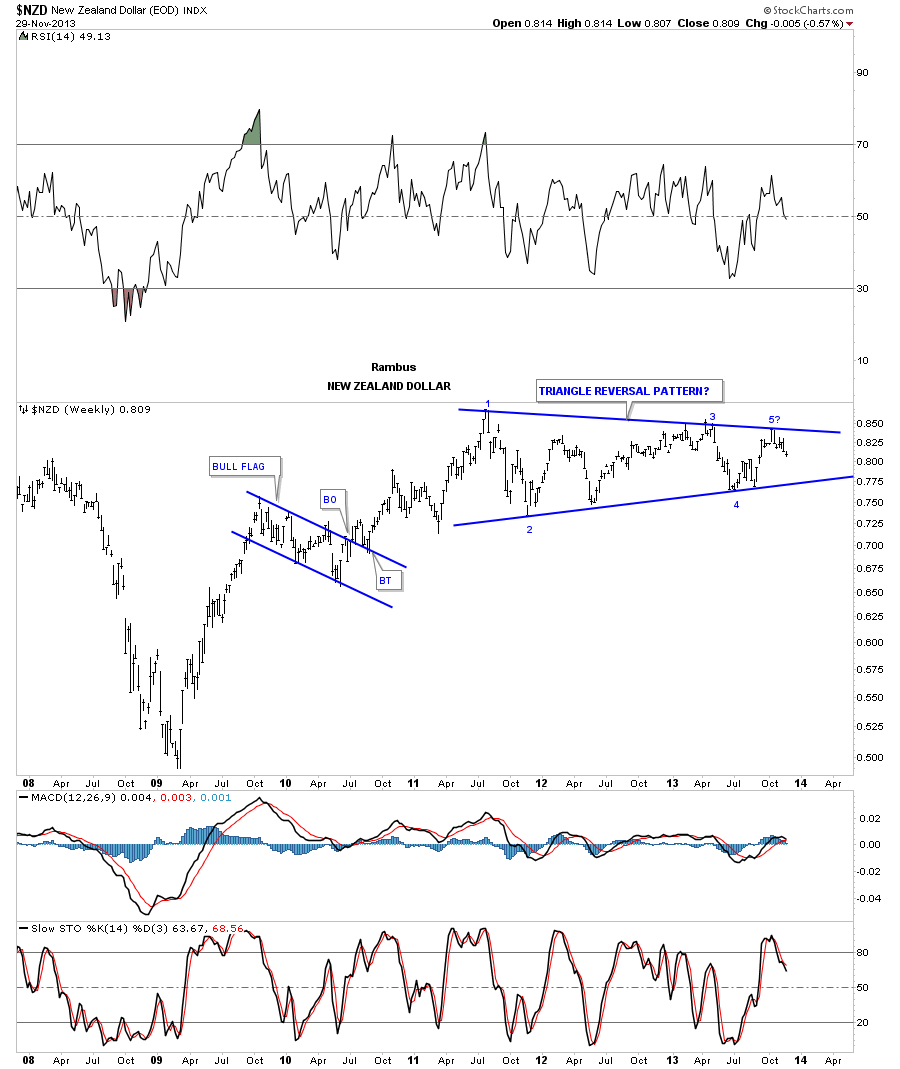
The NZD, New Zealand Dollar, rallied up to the top blue rail of a now possible 5 point triangle reversal pattern. The pattern wont be complete until the price action touches the bottom rail again. So the pieces of the puzzle are still being put in place that will eventually confirm to us what kind of triangle it will be.

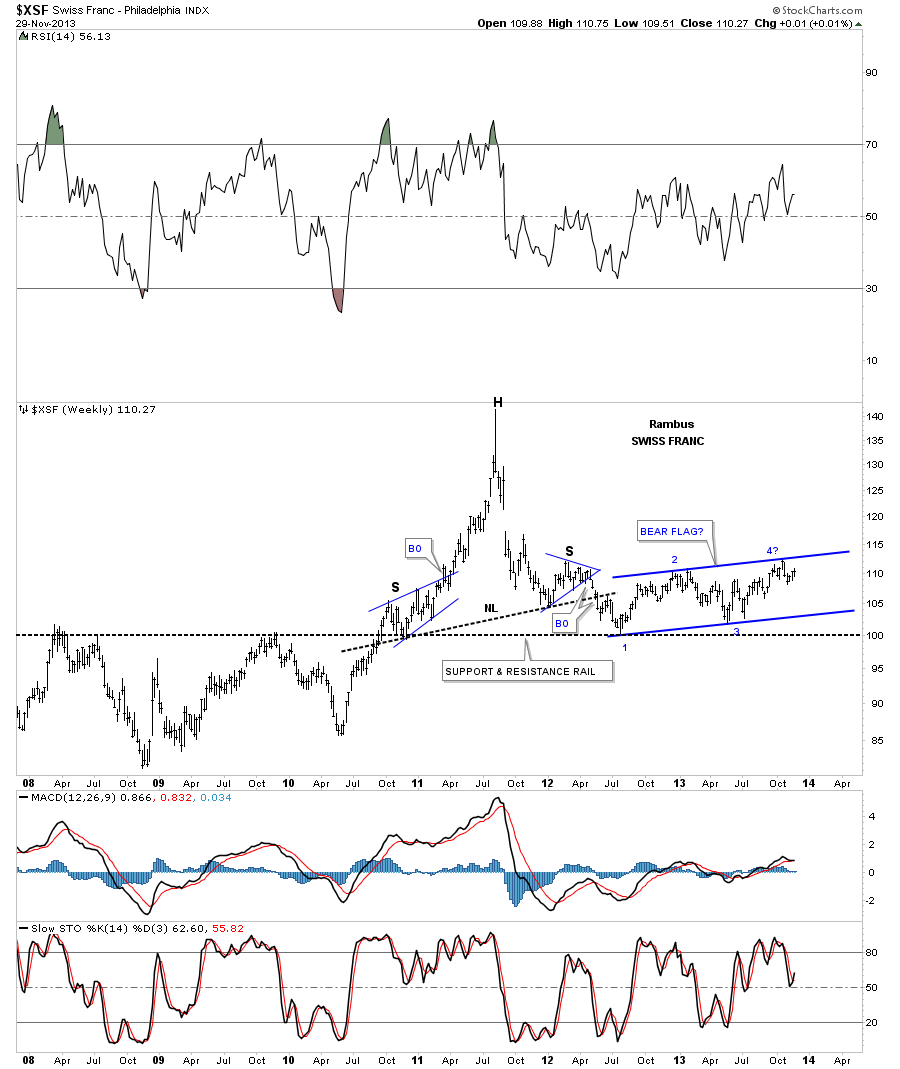
The Swiss Franc was one of the first currencies to top out and in a big way. It went parabolic into its ultimate peak before it reversed symmetry all the way back down to the black dashed support and resistance rail at 100. Since hitting the big support and resistance rail at 100 the Swiss Franc has been building out what looks like a huge blue bear flag. It still has alot of work to do but as long as the price action stays below the top rail it is what it is.

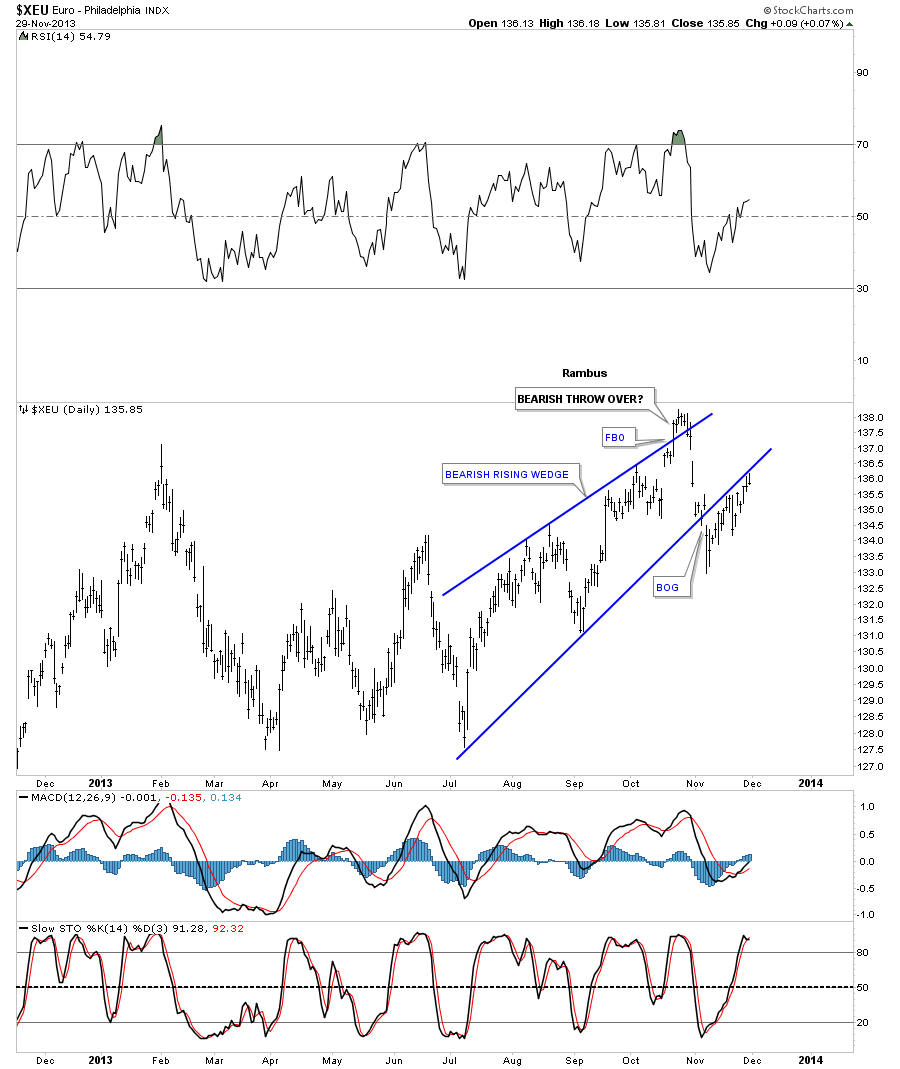
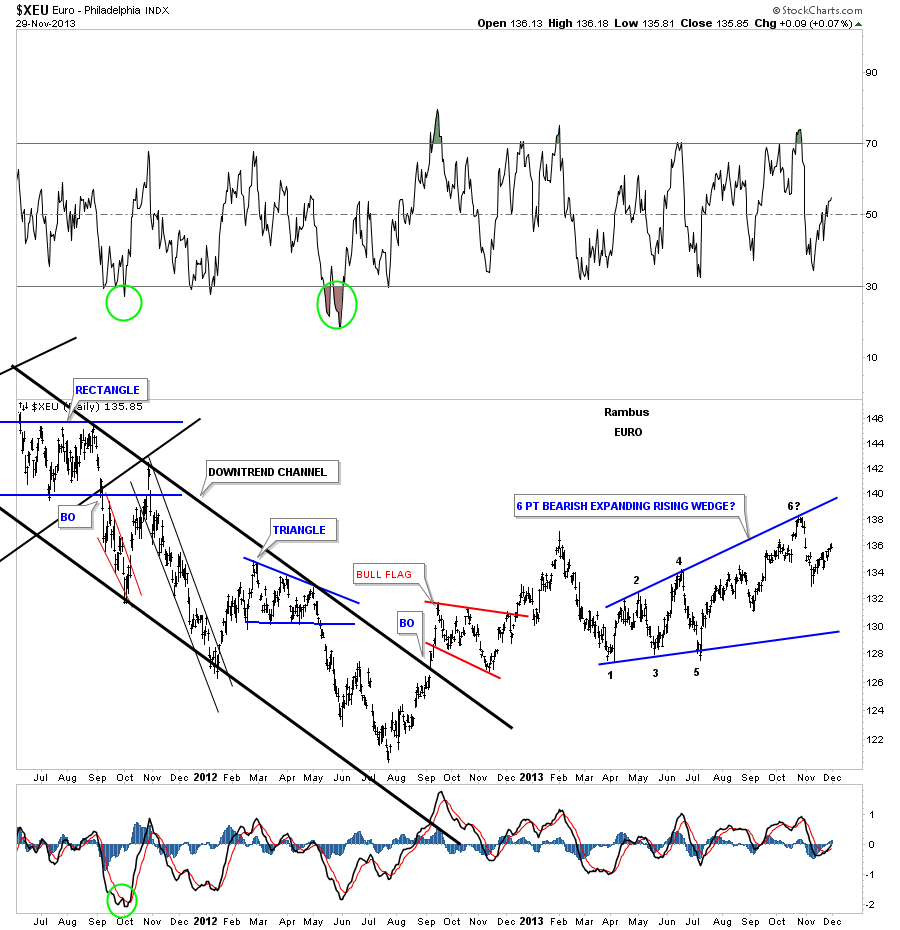
Lets now look at the euro that has been one of the stronger currencies out there. This daily chart shows how the euro broke down below the bottom rail of a bearish rising wedge. Its not uncommon, with a wedge pattern, that the price action can rally for a prolonged period of time just below the bottom rail of the rising wedge. As you can see it has been testing the underside of the bottom blue rail for close to a month now. A close back inside the rising wedge will negate this pattern. So far the bottom blue rail has held resistance.

This two year daily chart for the euro shows a possible 6 point bearish expanding rising wedge that is still a work in progress. This pattern seems the most logical one to me but until its complete I have to remain neutral on the euro.

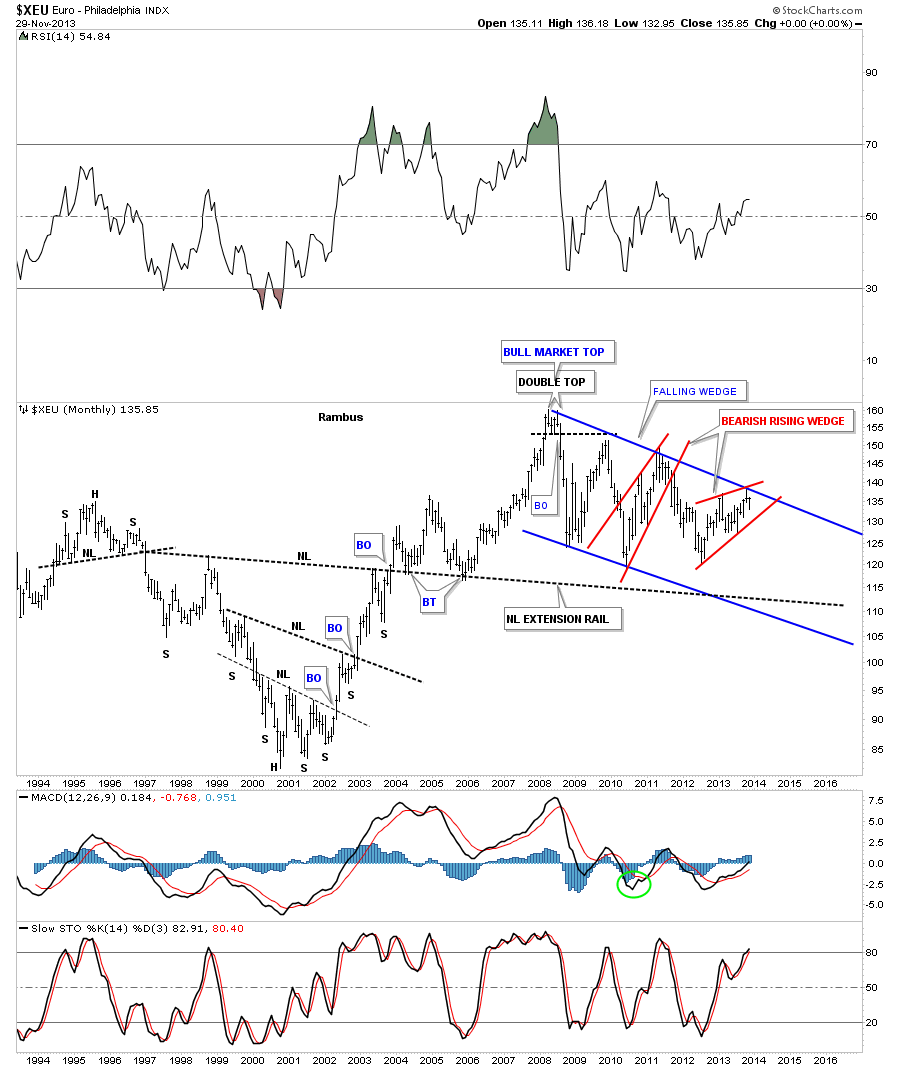
The long term monthly chart for the euro shows a possible red bearish rising wedge forming within the much bigger blue falling wedge.

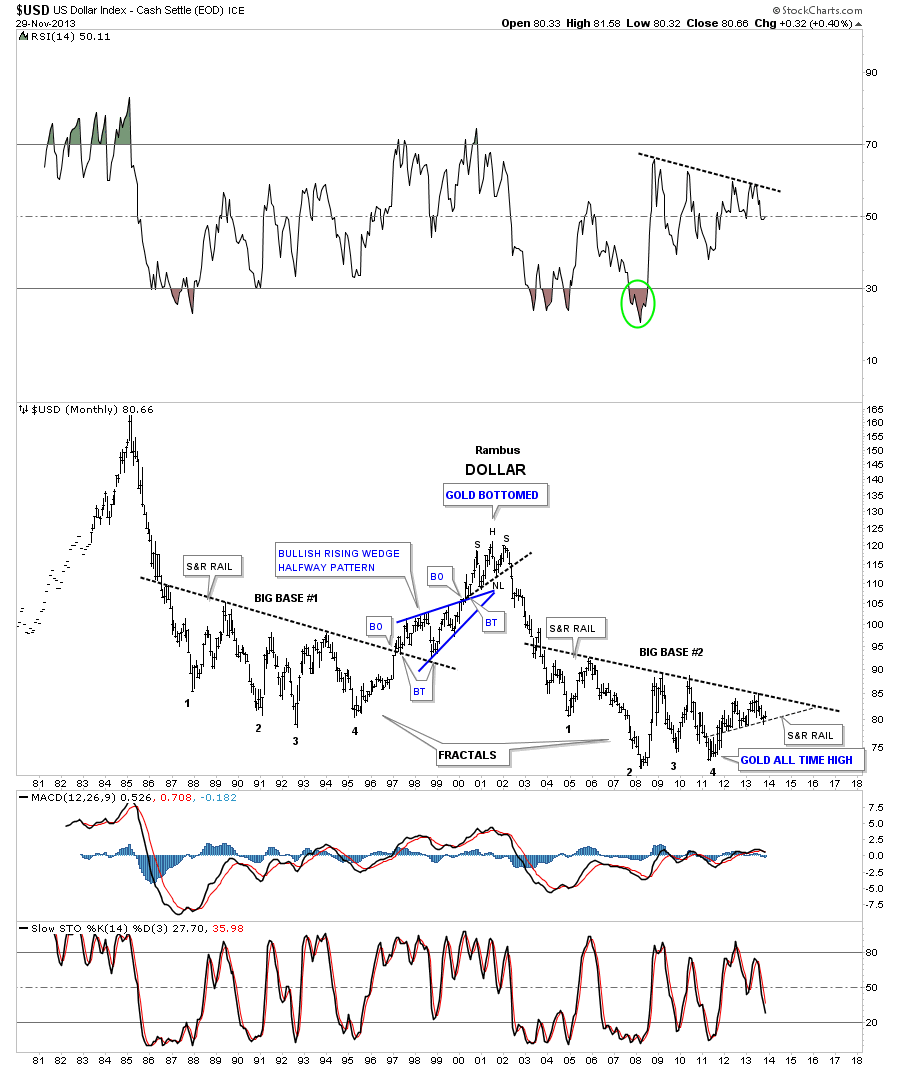
The last chart I would like to show you is the long term monthly chart for the US dollar that is showing it trading between two converging rails. The month of October showed the US dollar cracking below the thin support and resistance rail for just a short period of time, before it managed to climb back above it, putting the US dollar back to neutral. There are a lot of short term charts for the US dollar I could show you but for me this is the most important chart to focus on as there is less noise to contend with.

As a whole the currencies seem to be topping out in the big picture. Some have already completed their breakouts and backtests while others are still trading within their topping patterns. The US dollar seems to marking time just chopping around not doing much of anything at the moment. At some point the trend will reassert itself and there will be little doubt as to which way the US dollar is headed. In the mean time we just need to have some patience and wait for some further developments in the other currencies to help guide us along. All the best
Rambus
http://rambus1.com/
-- Posted Monday, 2 December 2013 | Digg This Article | Source: GoldSeek.com


