-- Posted Monday, 9 December 2013 | | Disqus
By Steve St. Angelo, SRSrocco Report
Not only is there a battle going on between the East and West when it comes to increasing physical gold reserves, there's also a gold production war taking place amongst these same nations.
Something quite extraordinary took place in 1997 which very few investors are aware. This was the year that the West peaked in overall gold production. Even though the world will hit a new record of global mine supply in 2013, the combined total of the top Western gold producing countries are still way off their highs set in 1997.
It took a great deal of effort and several decades, but the Eastern gold producers have beaten their Western competitors by a wide margin. If we look at the top 3 Western gold producing countries since 1988, we can see an important trend:

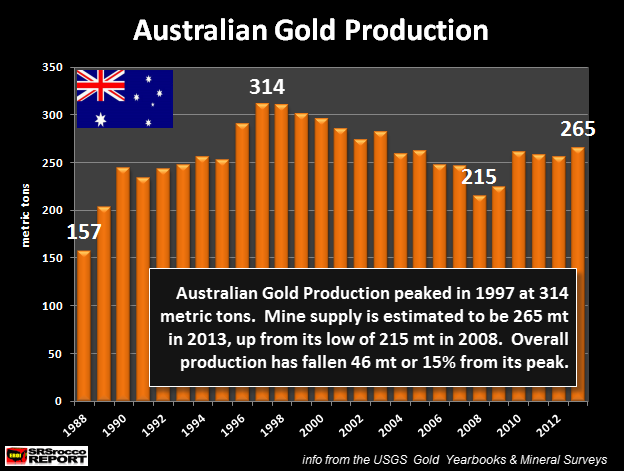
Australia, the top Western gold producer peaked in 1997 at 314 mt (metric tons) and declined until it hit a low of 215 mt in 2008. In the past five years, Australian gold production has steadily increased and is estimated to reach 265 mt in 2013.
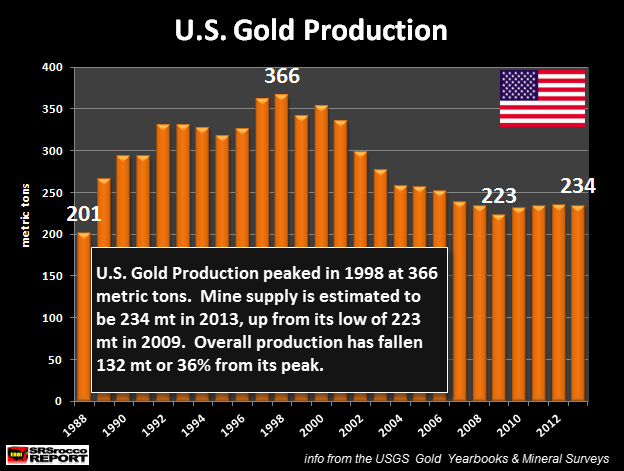
The United States has a similar historic production trend with Australia.

Gold production in the U.S. increased substantially from 201 mt in 1988 to 366 mt in 1998 -- the year it peaked. Just like Australia, domestic gold production in the United States continued to decline after its peak and hit a bottom of 223 mt in 2009. Its production has risen slightly over the past few years and is forecasted to be 234 mt in 2013.
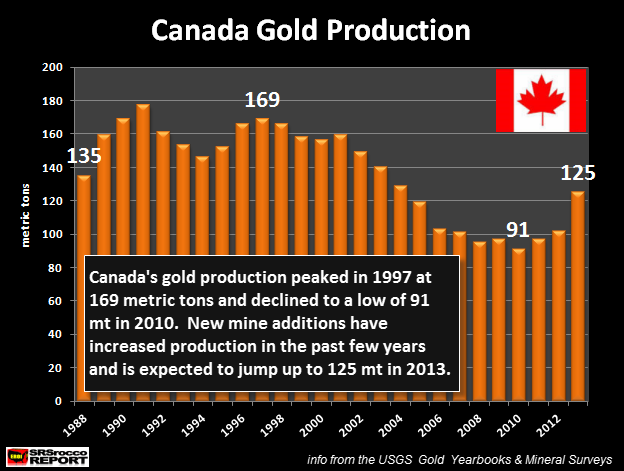
Canada comes in at number three of the top Western gold producers. Even though Canada had a higher peak of 177 mt in 1991, its second peak of 169 mt in 1997 is more relevant when we factor the overall peak in the top Western countries.

After Canada's recent peak in 1997, its domestic gold production declined significantly to only 91 mt in 2010. Actually all three Western countries had the same pattern -- increase-peak-decline-increase. Canada has actually increased its production the most of the three from its low in 2010. Canada is up 37% since 2010, Australia is up 23% since 2009, and the U.S. has increased 5% since 2009 (Note: these percentage gains are based on the estimated production in 2013).
Now that we have seen the top Western gold mining countries, let's look at the top 2 Eastern gold producers.
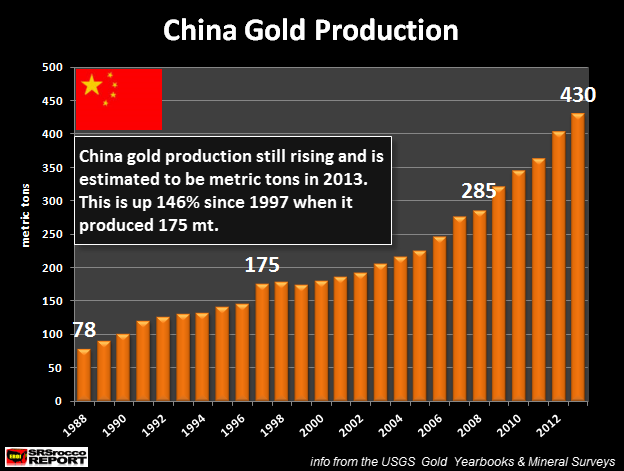
There is no surprise that China is ranked as number one in global gold production. And of course, it's the top Eastern producer as well.

China's gold production has increased a whopping 146% from 78 mt in 1988 to a forecasted 430 mt in 2013. As we can see, China has not yet peaked in its domestic gold production. However, at the rate they are currently producing their reserves, I would imagine their peak will more than likely occur within the next several years.
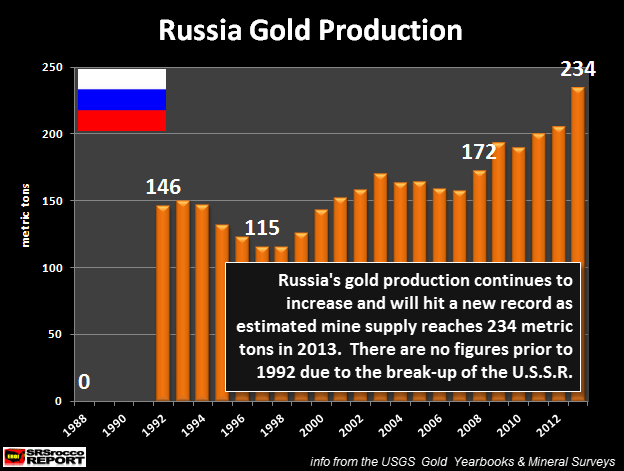
Russia is the second largest Eastern gold producer who like China shows no sign of peaking.

Russia has no production figures prior to 1992 due to the break-up of the Soviet Union. After the U.S.S.R broke apart, gold production declined to a low of 115 mt in 1997 down from 146 in 1992. As soon as Russia got back on its feet, it began the long hard task to rebuild and grow its domestic gold mining industry.
In a bizarre irony, Russia's gold production bottomed the very same year the top 3 Western producers peaked. Regardless, Russia has continued to increase its gold production and if its present trend continues (first 8 months 2013 = 156 mt) this year, it will reach a whopping 234 mt in 2013 -- possibly overtaking the U.S. for the number three spot in the world.
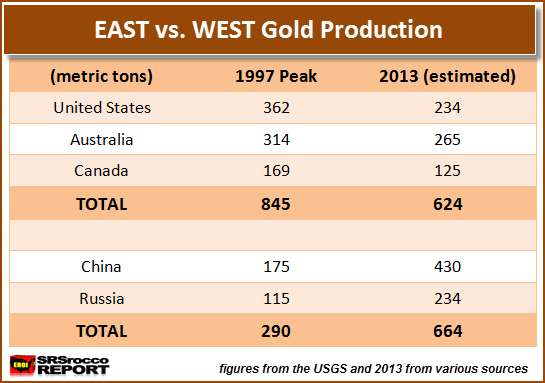
Now that we have seen the gold production figures from each of these countries, this is the result when we divide them by EAST vs WEST:

The year the top 3 Western gold producers peaked (1997) they had a combined total of 845 metric tons. However, China and Russia's mine supply was only 290 mt.... 552 mt less than their Western counterparts.
But, if we look at what is to take place this year, we see a much different picture. Total gold production from the United States, Australia and Canada is estimated to be 624 mt in 2013, 26% less than their peak in 1997. On the other hand, China and Russia will actually surpass the West with an estimated 664 mt in 2913 -- a 129% increase compared to 1997.
So, what we have here is two of the top Eastern countries surpassing three of the top Western nations. The evidence clearly shows the East has now won the war on increasing its gold production over the West by an estimated margin of 40 mt.
It almost seems as if this has been the plan for quite some time. Not only have China and Russia become the largest Eastern Bloc gold producers, they have also accumulated a great deal of gold in their central bank vaults while the West has exported a large percentage of their gold supply.
The Collapse of the South African Gold Production
I wanted to include two of South Africa's gold mine supply charts because it provides a sober reality on how geological limits can impact production in a big way. South Africa is one of those countries that has two political foundations, 1) its Western history of being ruled by the British & Dutch, and 2) its current Eastern relationship as one of the BRICS, a more Eastern organization.
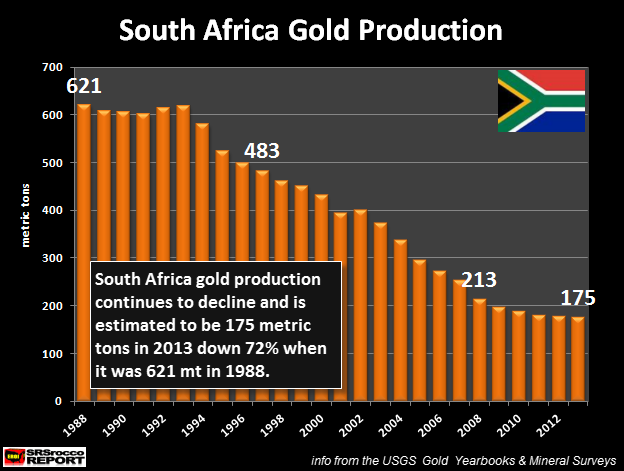
South Africa was the leading gold producer in the world up until the turn of the 21 st century. However, their one time gold resource bounty has now been exploited and their global production rank has fallen to the fifth spot.

South Africa's gold production has continued to decline from 621 mt in 1988 to only 175 mt (estimated) in 2013. This turns out to be an amazing 72% fall in gold output in 24 years.
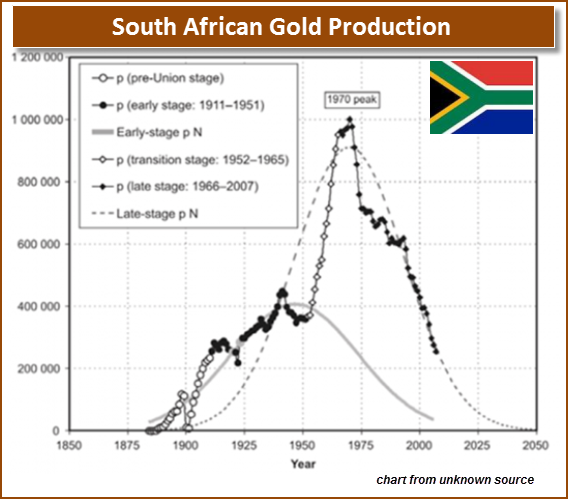
While this does seem like a huge decline during this time period, if we were to look at their production data going back until 1970, it's even much worse:

In the chart above, we can see that South Africa peaked in global production at a staggering 1,000 mt in 1970. This is indeed an amazing feat as no other country in the world has come close to producing half this amount in a given year.
Here are the Peak Production Years for these 6 countries:
South Africa (1970) = 1,000 mt
United States (1998) = 366 mt
China (2013 - no peak) = 430 mt
Australia (1997) = 314 mt
Russia (2013 - no peak) = 234 mt
Canada (1991) = 177 mt
The four Western gold producers (USA, Australia, Canada and including South Africa due to its history as being controlled by the British & Dutch) have already peaked in gold production while the top Eastern countries (China & Russia) are still in an upward trend.
The gold story will become more interesting in the future when the global financialization of debt with derivatives comes crashing down. Those who hold the most gold at this time, will be in much better shape than those who leased it out for a temporary paper gain.
Lastly, I came across this article on Mineweb yesterday that gave me a good laugh. Not only are there uneconomic oil resources in the world hyped as future supply, it is also true with gold. A Canadian geologist had this to say this about his own industry and supposed gold resources:
There used to be an old joke in university that geologists were engineers who couldnt do math. Sometimes I wonder if this isnt true when I see resource models for gold deposits with grades less than 1 g/t gold (or equivalent grades for other elements) in some inaccessible northern frontier area with no infrastructure or lying under 100 metres or more of till. This isnt an orebody; its a shareholder-funded science project that didnt work out.
NOTE ON GOLD PRODUCTION FIGURES: In obtaining these annual gold production figures, I had to access different USGS Gold Year Books. These figures are revised in newer additions, so there may be small differences in some of the annual production figures -- but not much. Furthermore, the USGS only provided data up until 2011, so the figures for the last two years were acquired from various sites.
Updates for the Q3 2013 Top Primary Silver miners adjusted-income break even will be coming out this week at the SRSrocco Report.

-- Posted Monday, 9 December 2013 | Digg This Article | Source: GoldSeek.com


