-- Posted Monday, 30 December 2013 | | Disqus
By Rambus
Rambus Chartology has been focusing on the Precious Metals for the most part as that is where the most compelling Chartolgy has been.
But tonite I would like to switch gears and visit a different sector which is looking very interesting to say the least.
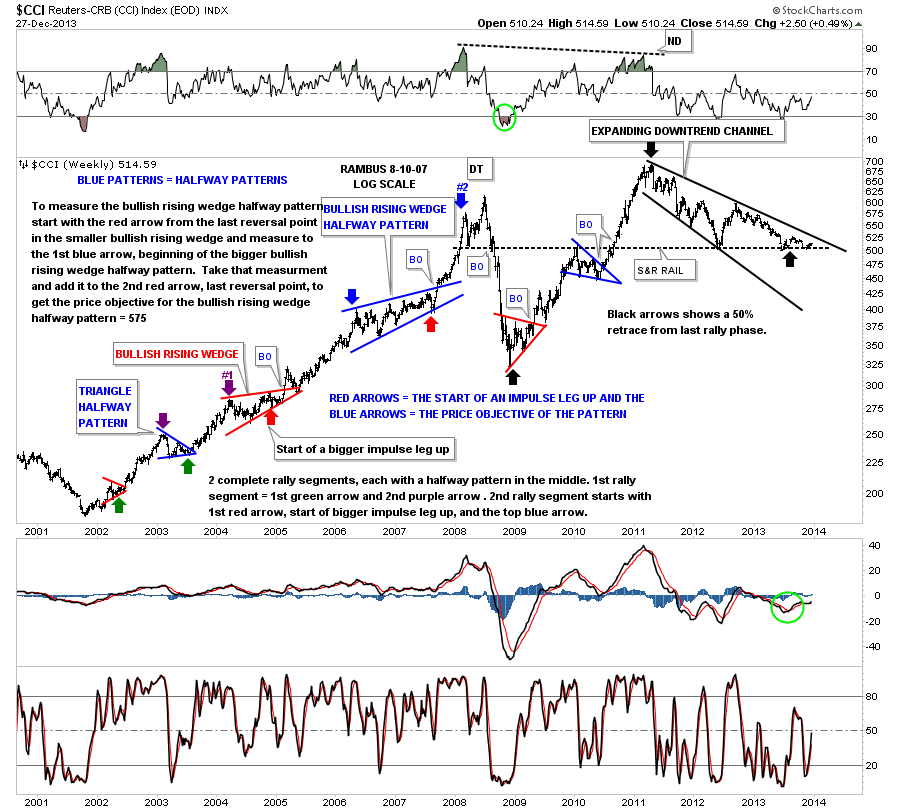
About every two or three months or so I do a post on the Basic Materials sector just too keep an eye one what is happening there. It has been somewhat mixed for the most part but it now seems to be gaining some momentum. As you know Ive taken a couple of position related to the area recently. I tried the shippers a month or so ago but got stopped out on a hard backtest but I could see the potential starting to build for this undervalued area. The latest bout of strength still hasnt shown up in the CCI commodities index as it has been flat lining on top of a long term support and resistance rail that goes all the way back to 2007. So far the CCI has corrected 50% of the move off the 2008 low which it has been holding for some time now.

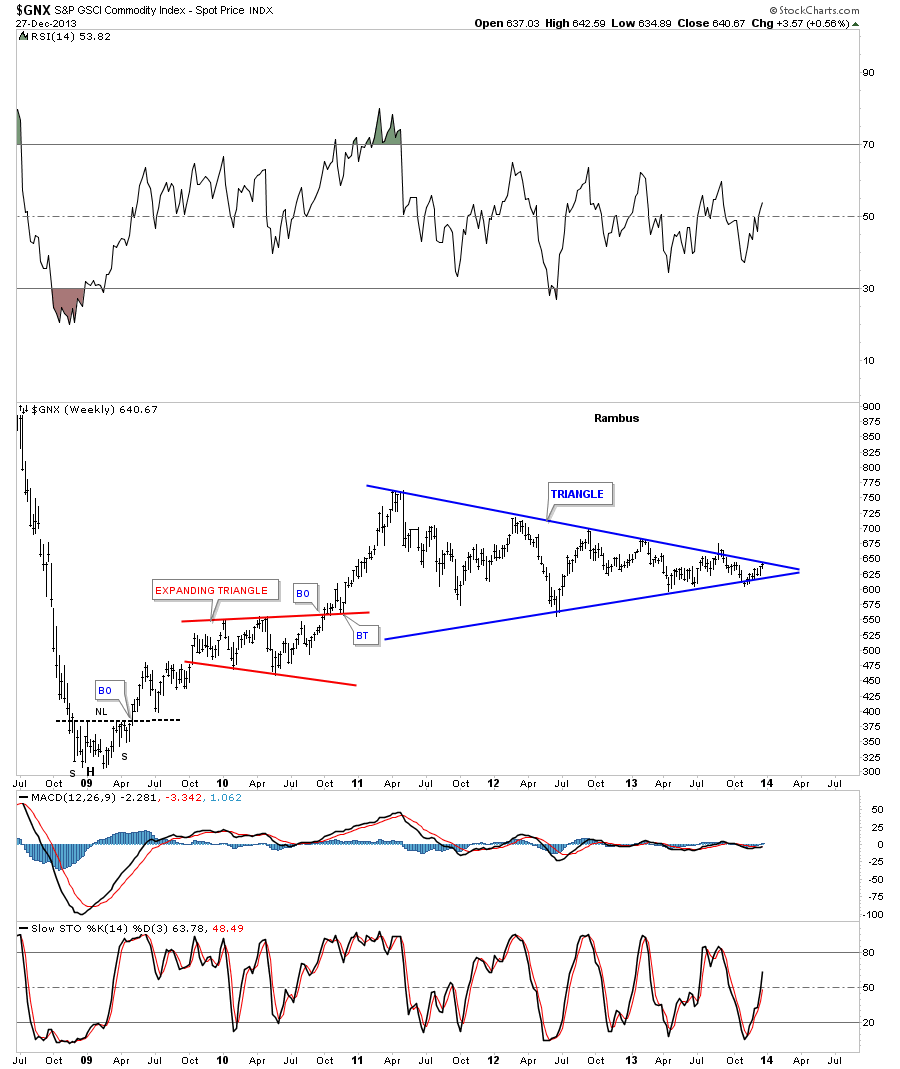
The GNX is still trading inside a big blue triangle that maybe getting close to breaking out. That top blue rail has five touches on it so we know its hot.

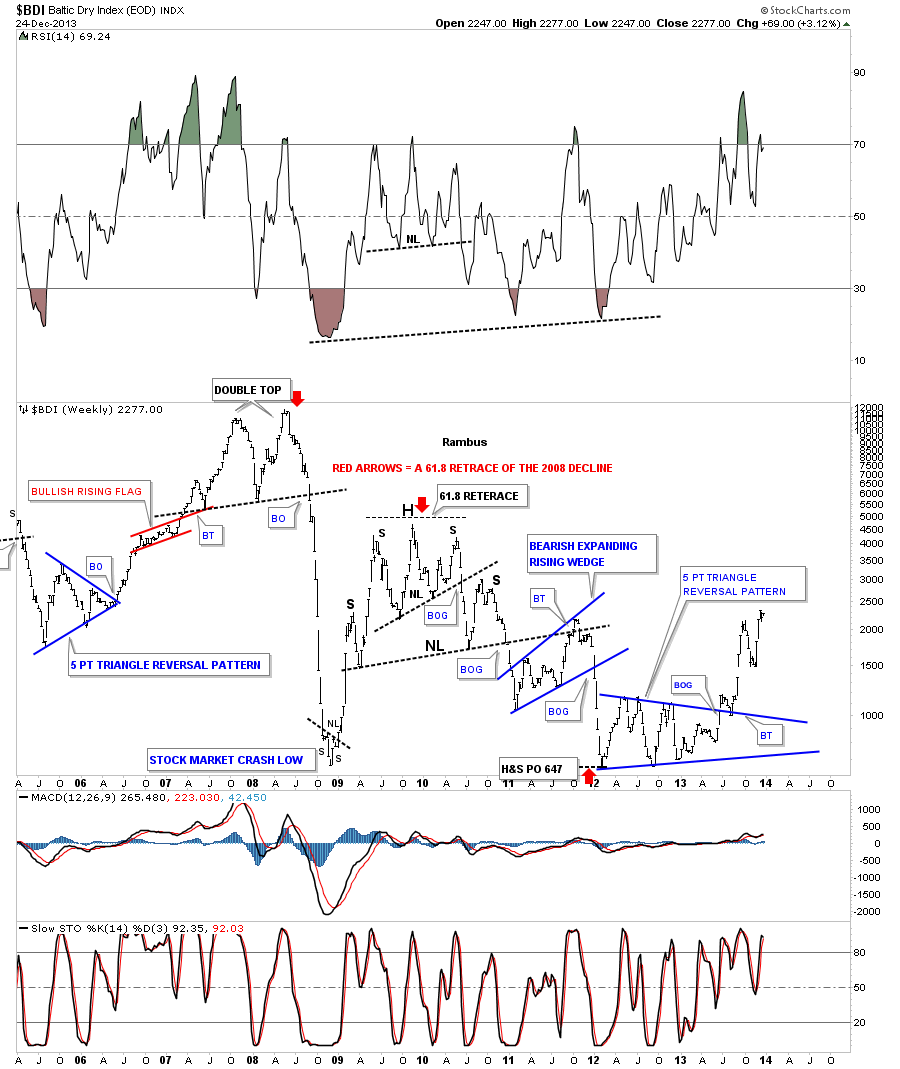
The Baltic Dry Index was the first real good indicator that the basic materials stocks were finally bottoming and a potential decent rally was beginning. As you can see it produced a nice five point triangle reversal pattern as its bear market low complete with a backtest.

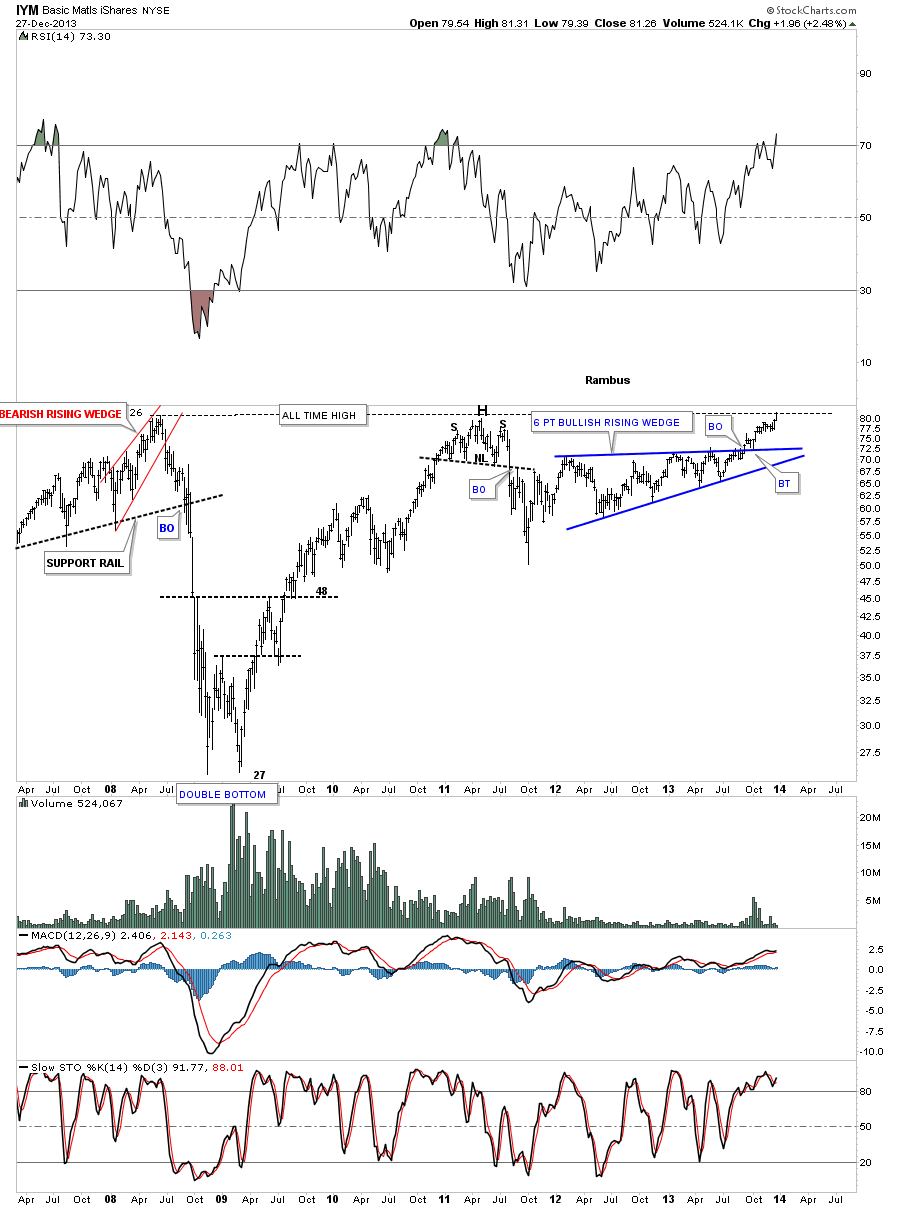
There are several etfs out there that track the basic materials sector. One of my favorite ones is the IYM that is now just testing its all time highs going all the way back to the 2008 high. Its built out an almost two year blue triangle that has broken out and had its backtest. As you can see the price action is sitting right on the all time high, black dashed horizontal rail, at the top of the chart. Regardless of what we think of the fundamentals we have to respect the strength in this sector.

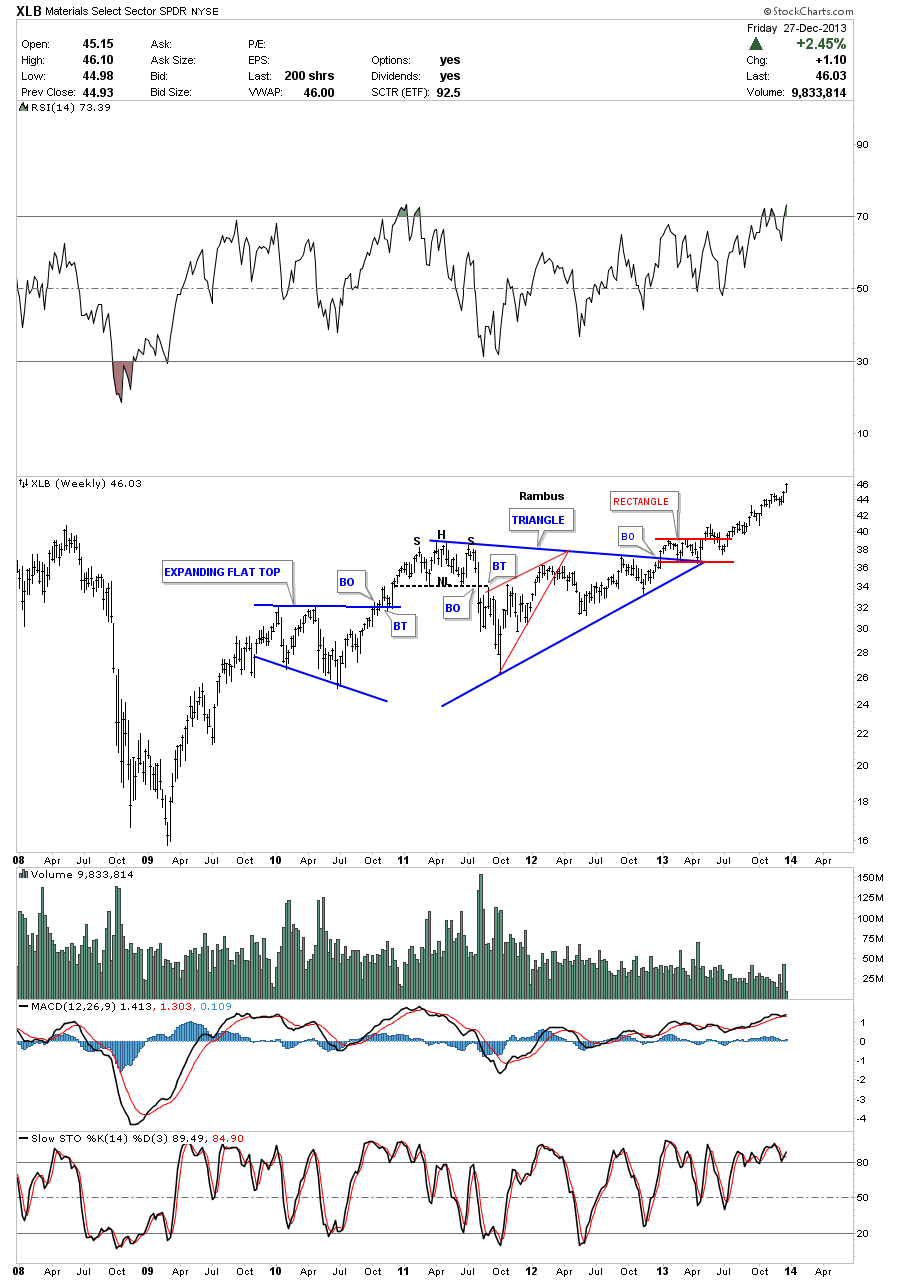
Another etf that tracks the basic materials sector is the XLB.

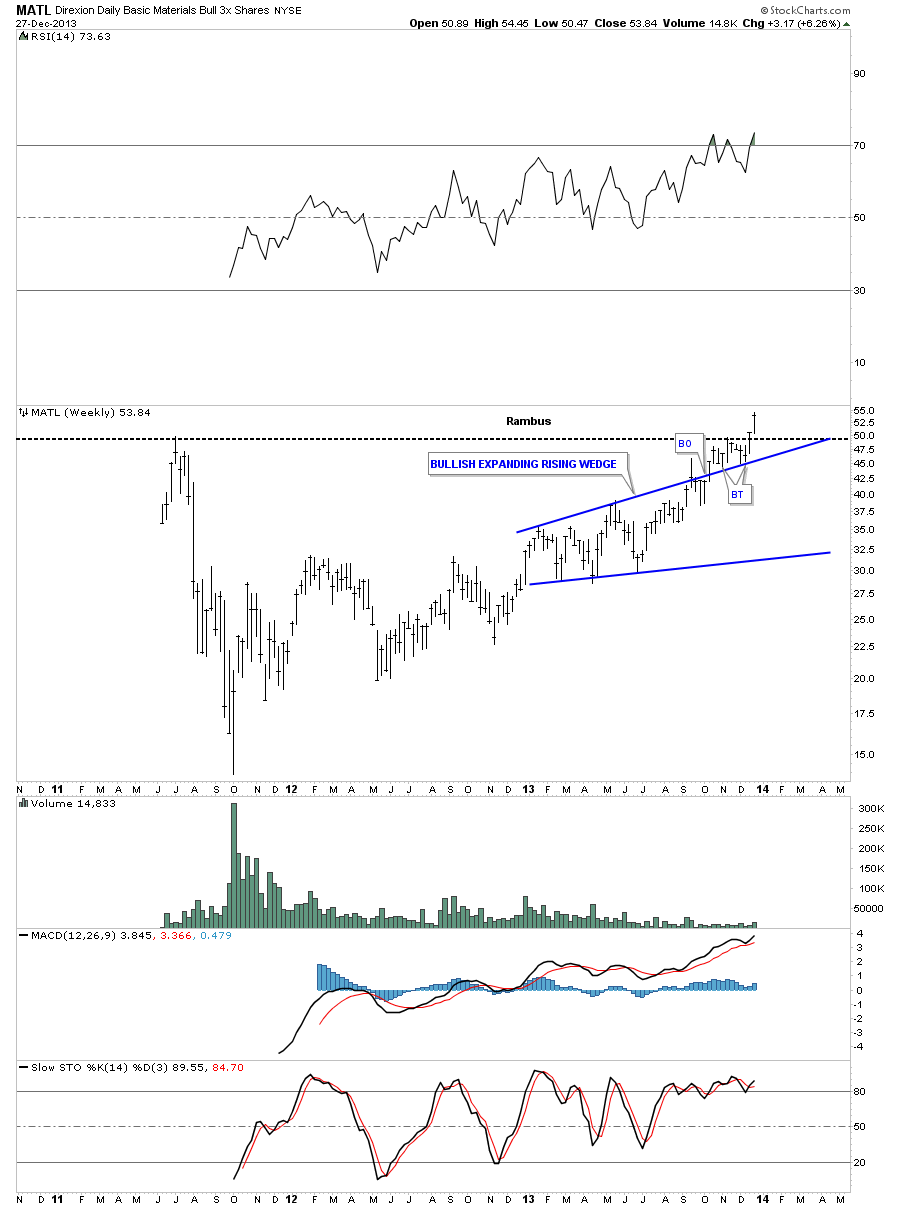
Below is a weekly 3 X bull etf for the basic materials sector, MATL, that closed the week at a new high for this stock. It has very light volume though.

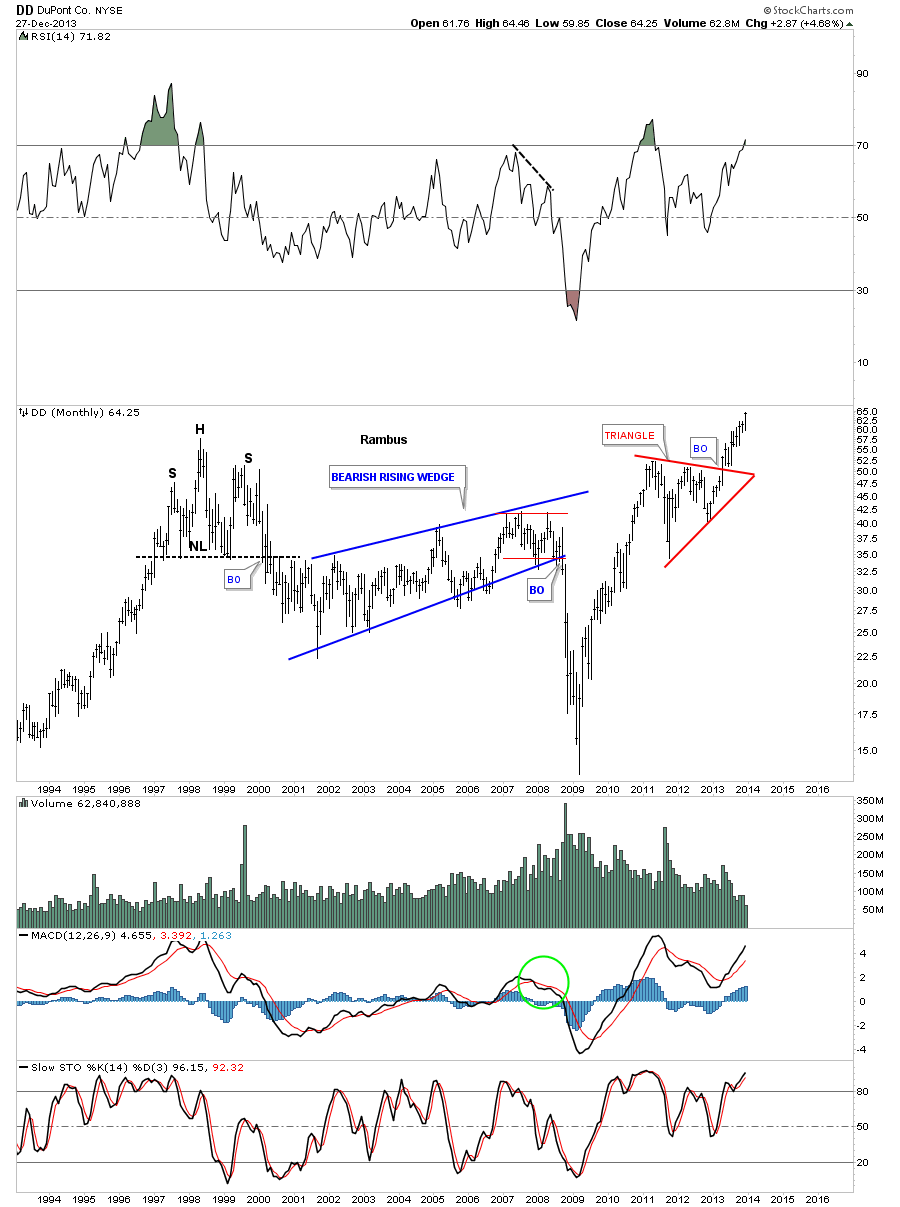
Lets now look at some of the stocks that makeup this sector as some of them are part of the Dow Jones. DD is a big part of the Dow Jones and shows why the Dow is still making new highs. On the monthly chart below you can see a beautiful red triangle that broke out sometime ago and is currently in an impulse leg higher making new all time highs.

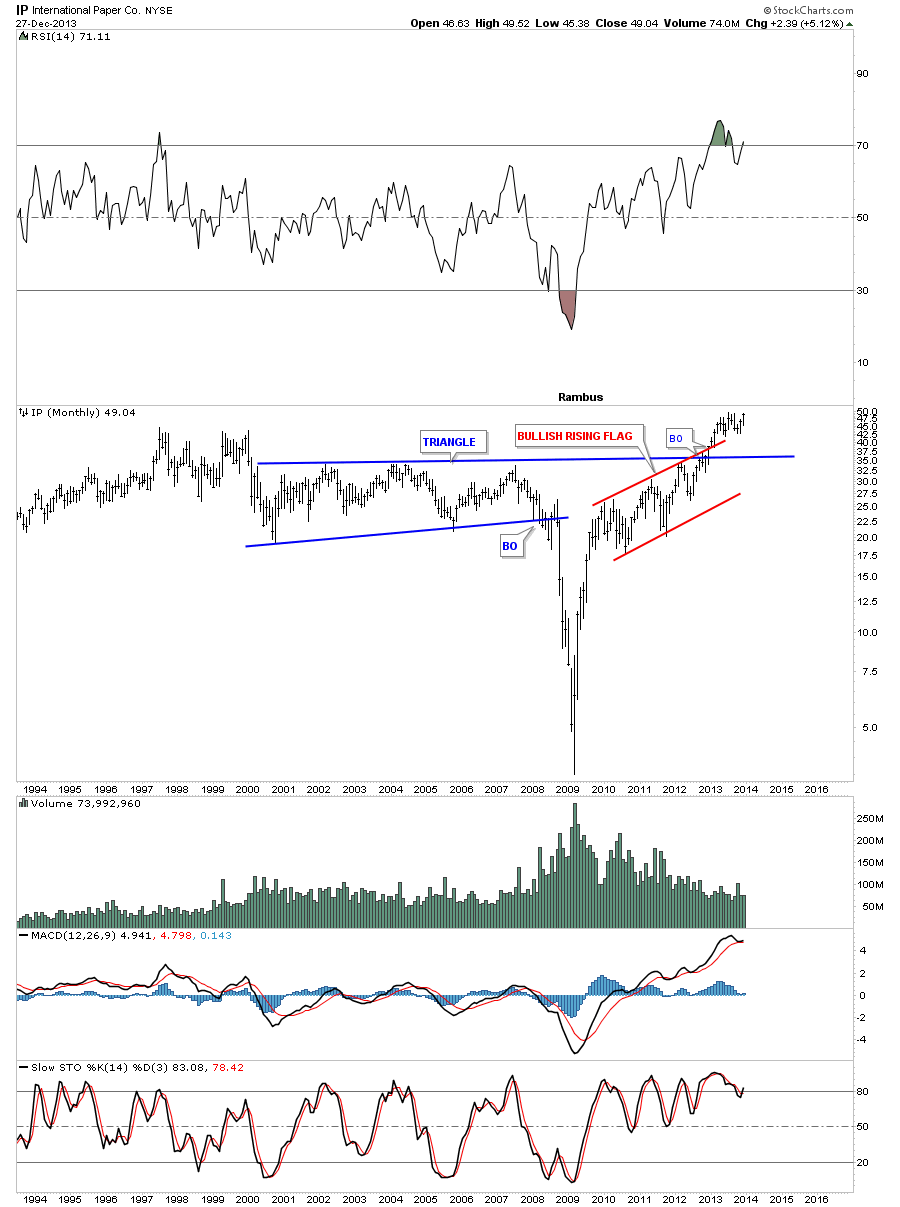
The monthly chart for IP shows its trading at all time highs.

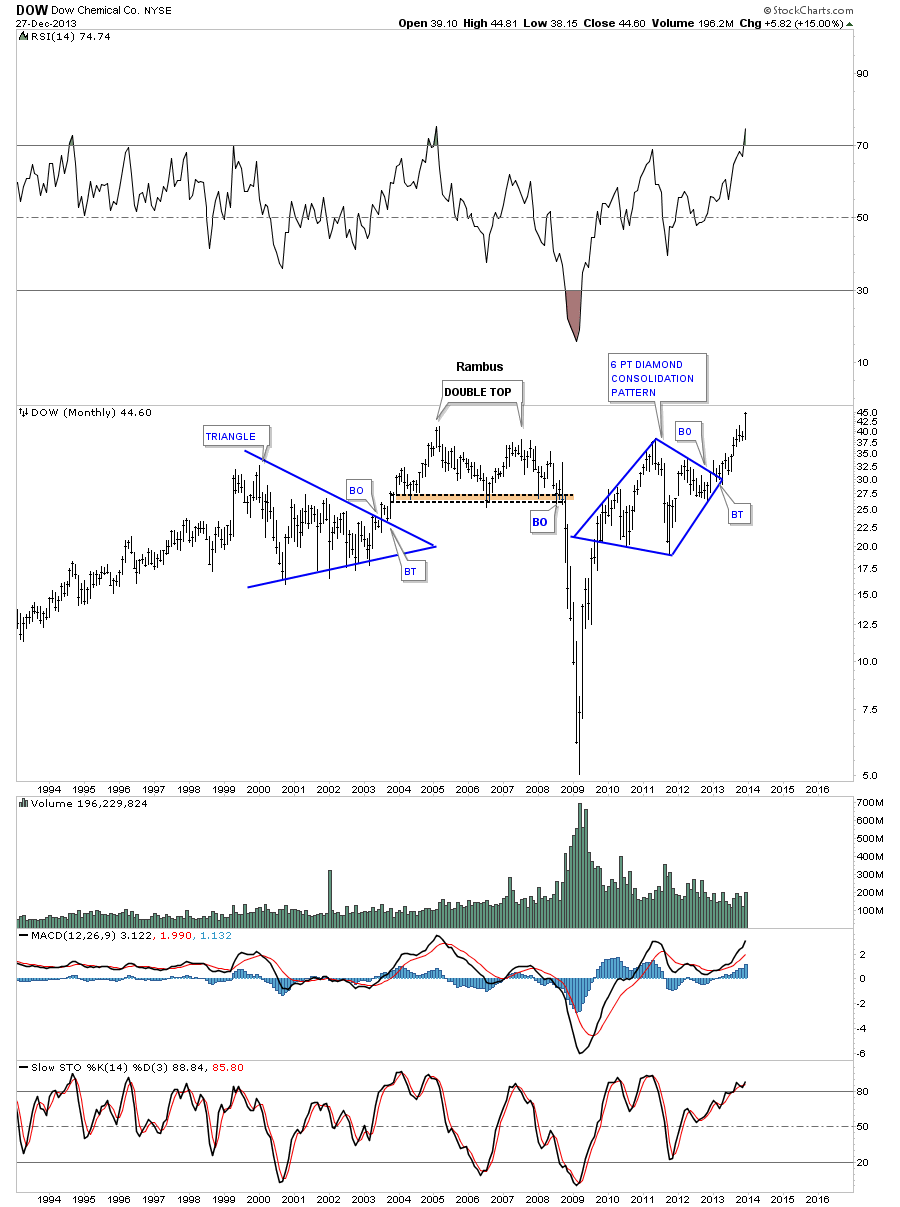
Dow Chemical is going to close out the month of December at new all time highs.

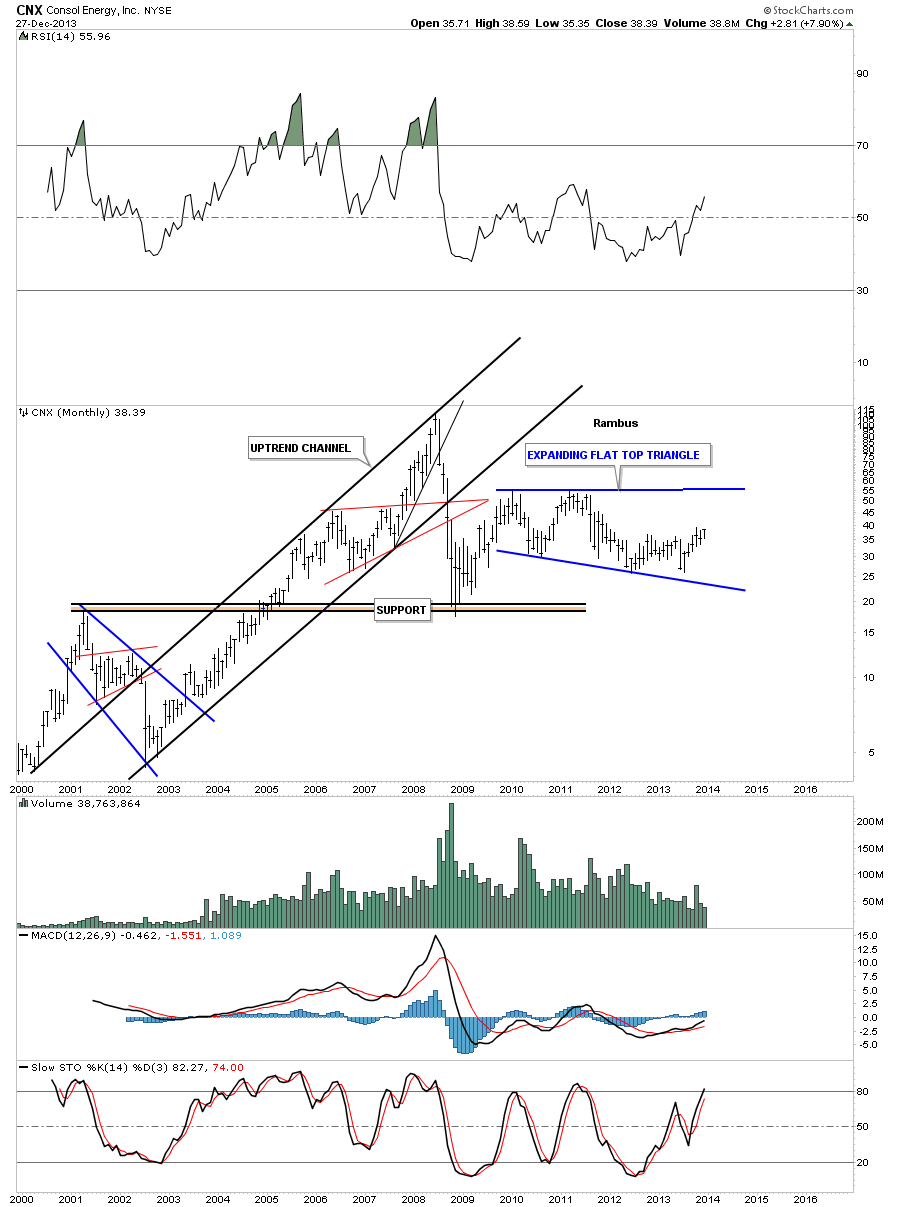
CNX is still well below its all time high but it looks like it could be forming a flat top expanding triangle.

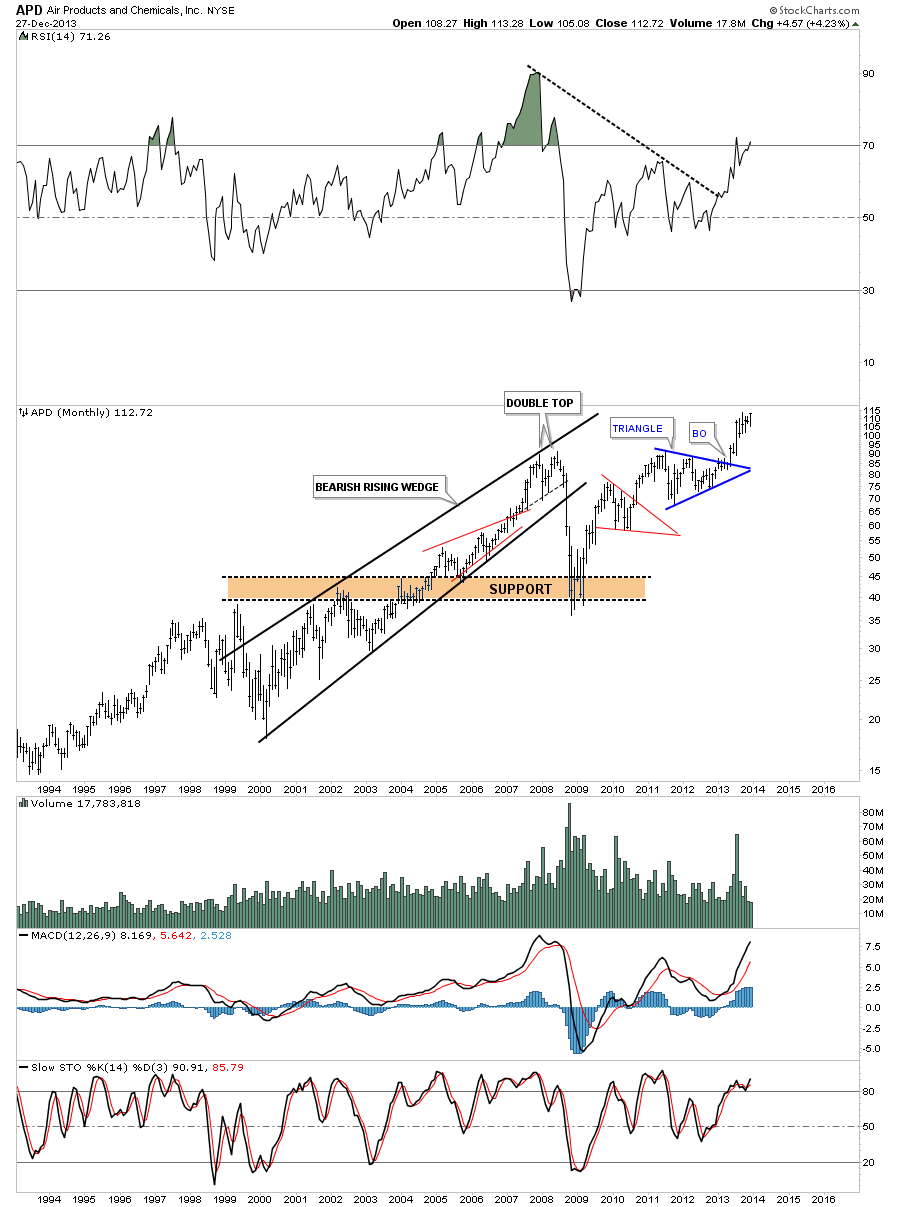
APD is breaking out to new all time highs.

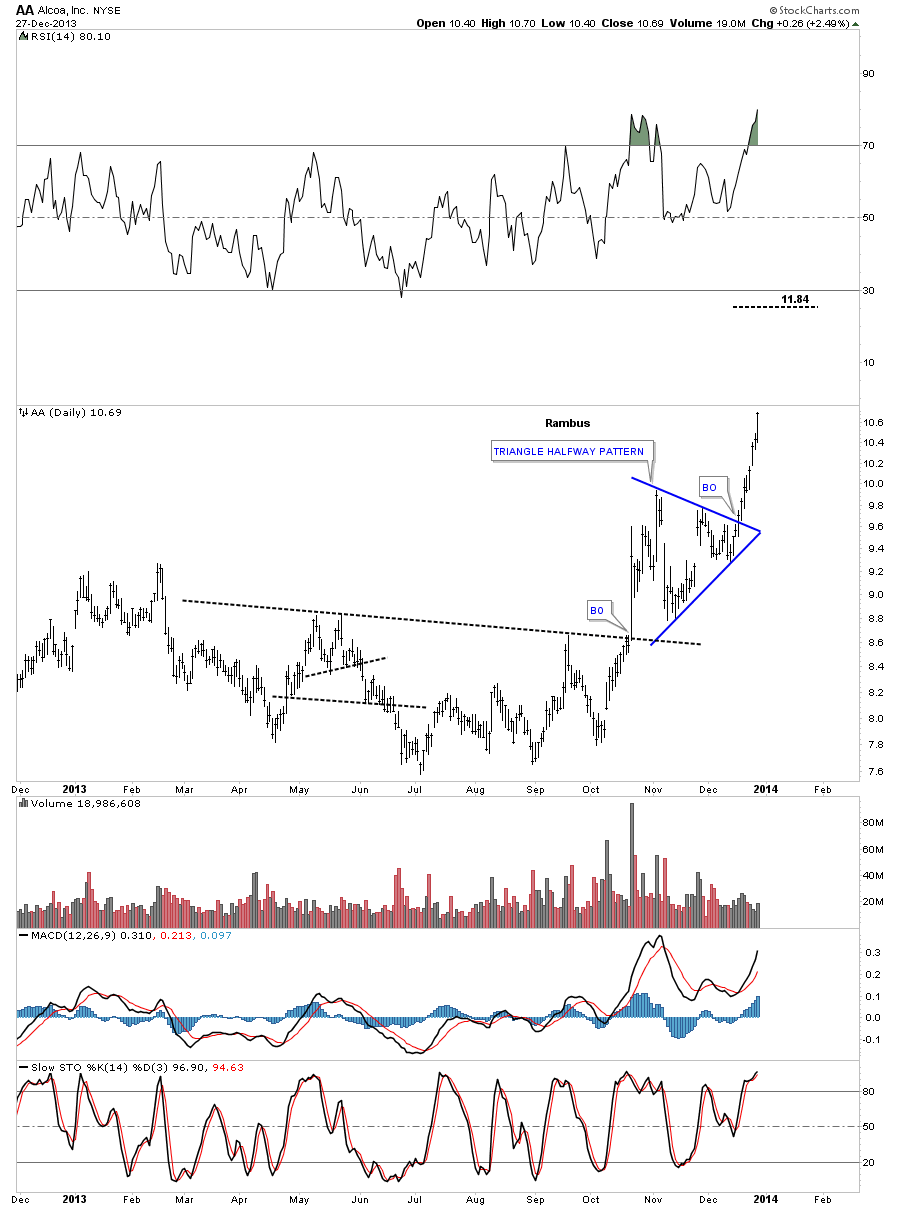
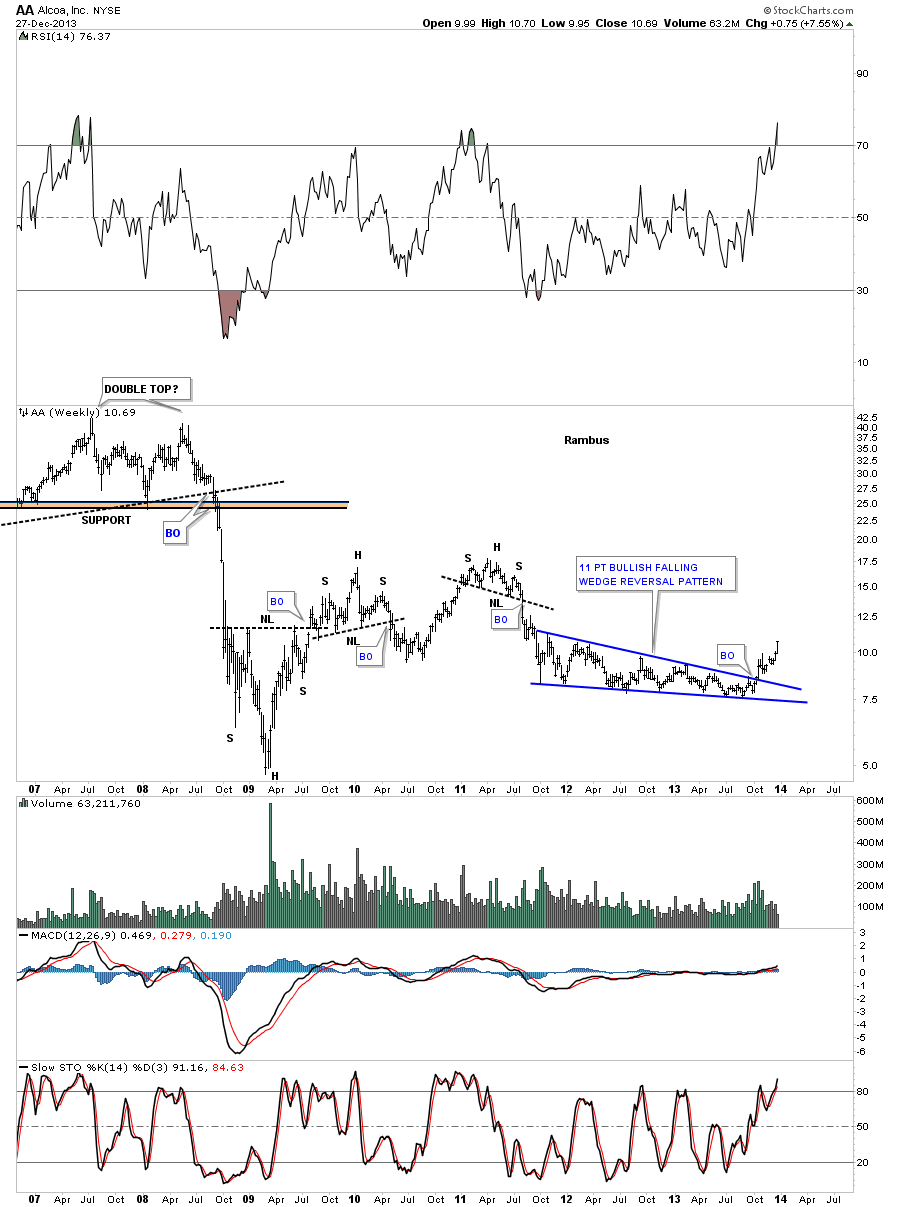
AA is another stock that has recently broken out of a blue triangle consolidation pattern.

The weekly look for AA shows there is still a lot of room to move higher for this stock. It created an 11 point bullish falling wedge reversal pattern to end its decline.

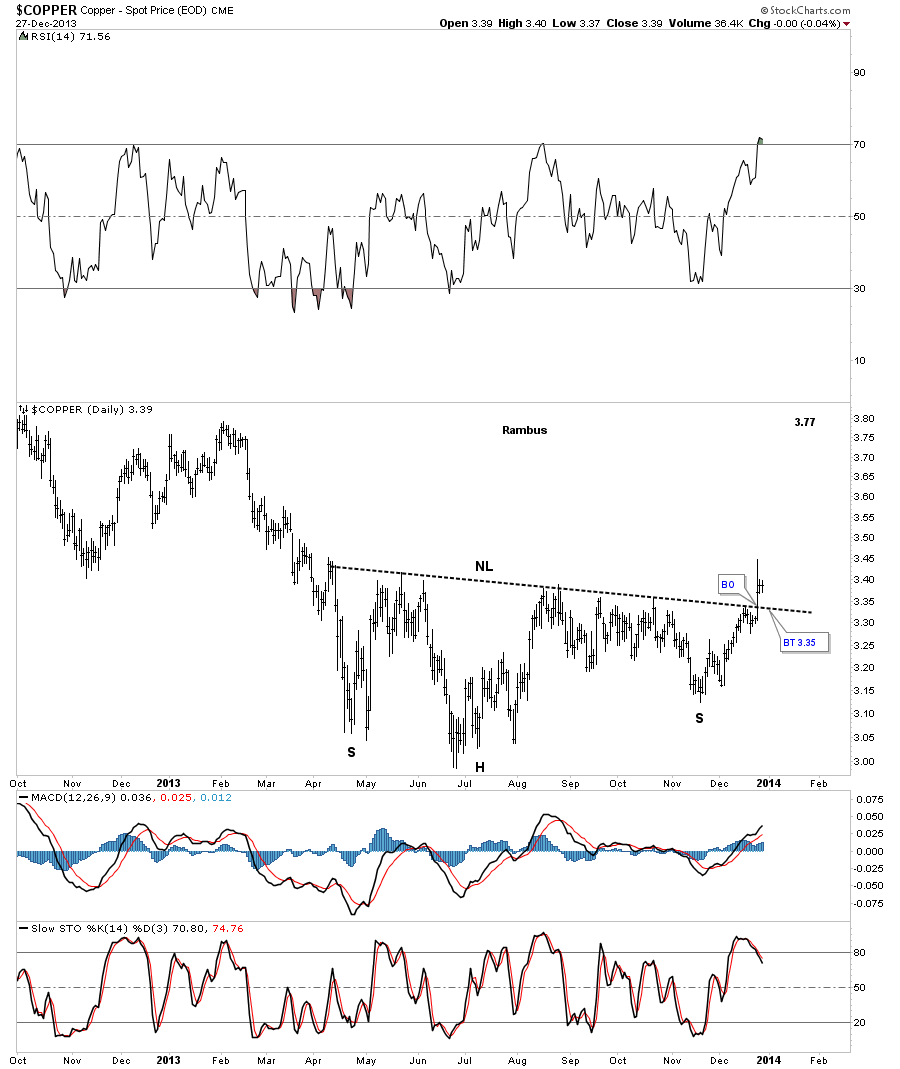
There are several areas in this sector that have yet to really takeoff and are still undervalued. Theres an old saying that states, how copper trades so does the stock market. This means if copper is strong so should the economy and vise a versa. I think copper finally showed its hand this week after breaking out if a nice eight month inverse H&S base. Its been lagging the Dow Jones for quite sometime but maybe its getting ready to play catchup.

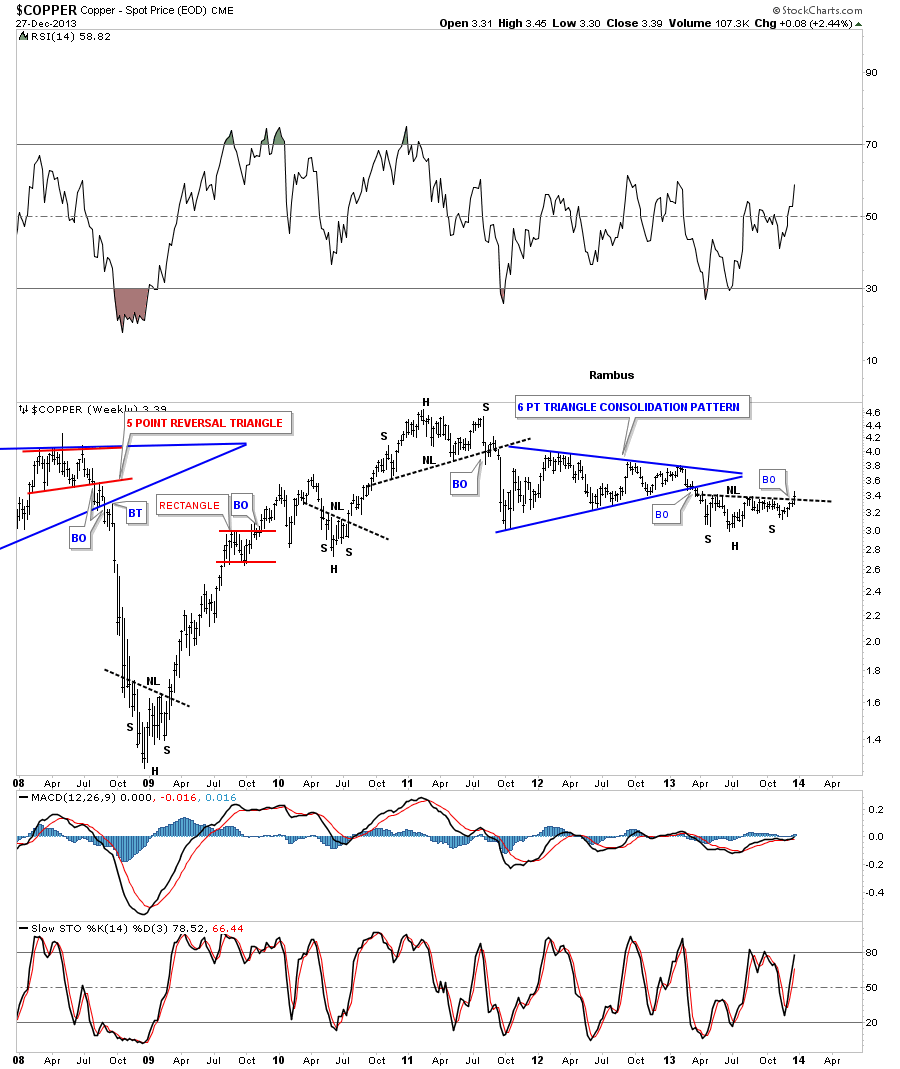
The weekly look at copper shows just how weak its been since topping out in 2011. It built a beautiful 6 point blue triangle consolidation pattern but so far has failed to follow through to the downside. Note the small inverse H&S base on the lower right hand side of the chart that is the same inverse H&S base that I showed you on the chart above. This could be a very important development.

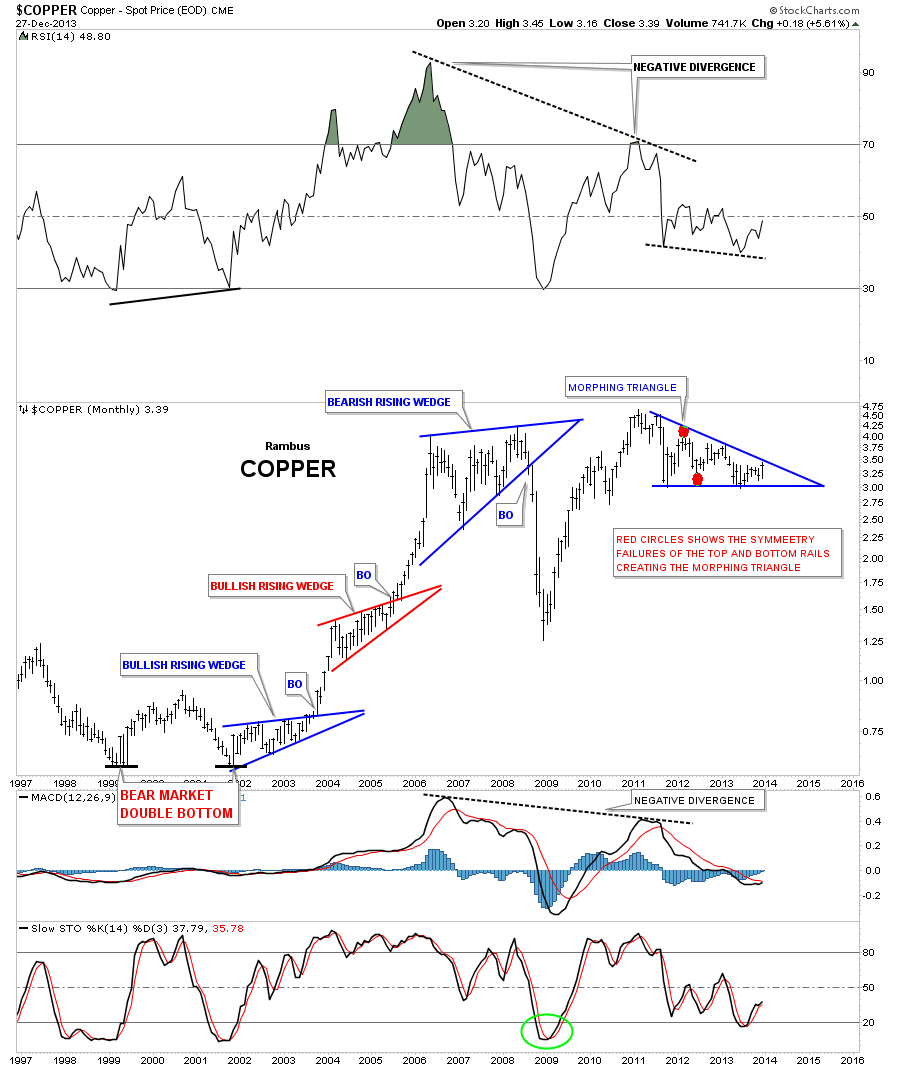
As I have shown you many times in the past, a triangle can morph into a bigger triangle, that doesnt change the direction of the move, but just creates a bigger triangle. The monthly chart below shows how copper is morphing into a bigger triangle. Note the two red circles that shows the failure of the top and bottom rails that is creating the bigger blue triangle consolidation pattern.

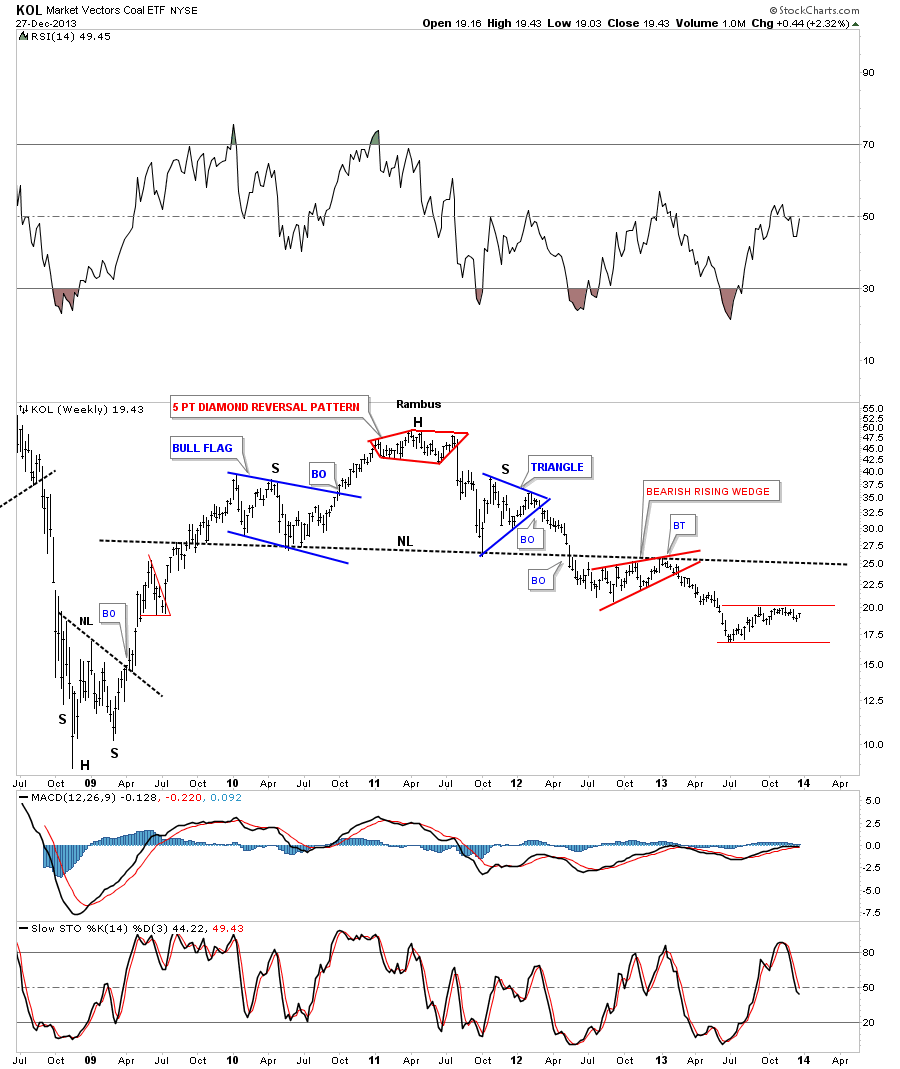
Coal is probably the weakest area inside the basic materials sector. It built out a beautiful H&S top with a blue triangle just above the neckline and red bearish rising wedge just below the neckline. This is usually a bearish setup. As you can see KOL, the coal etf, is basically trading in no mans land at the moment.

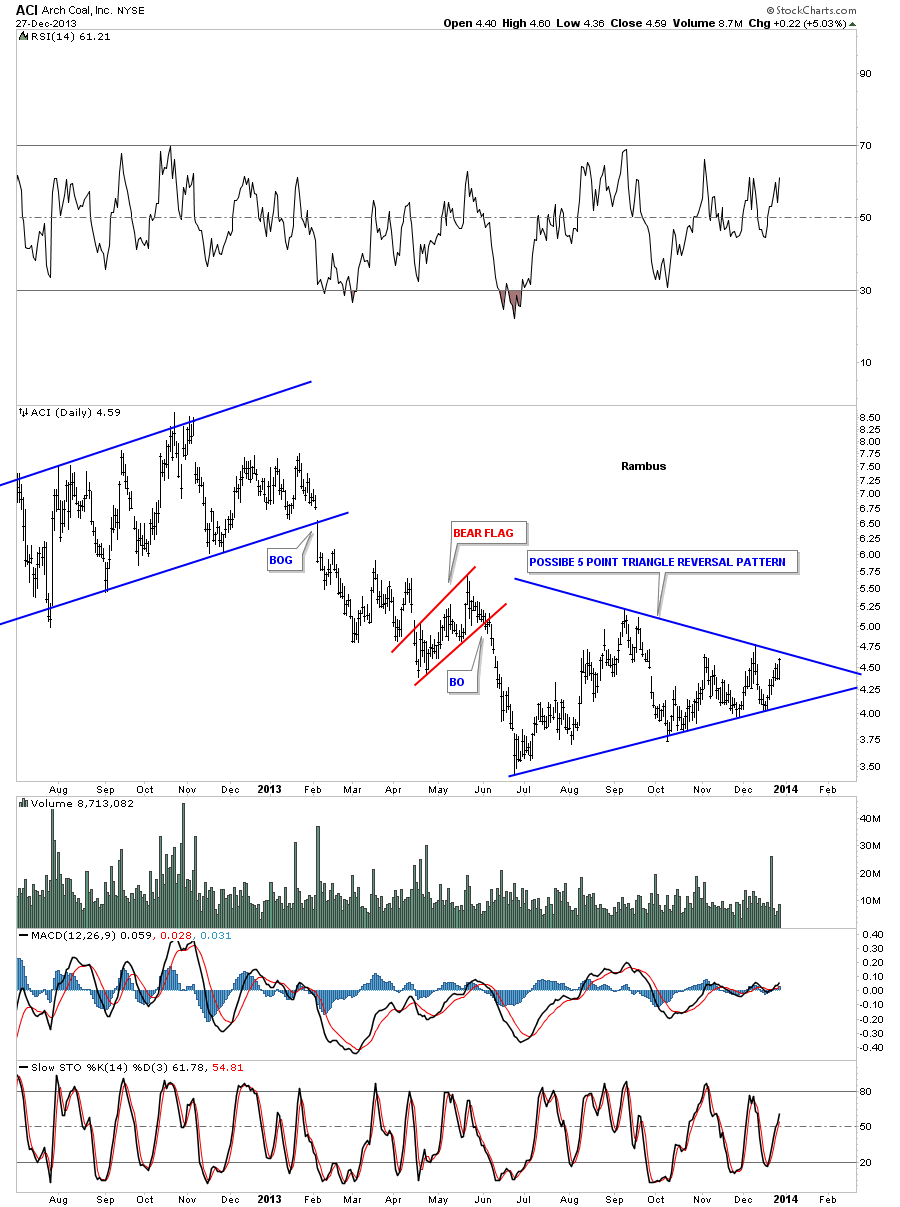
Even though the KOL, coal etf, is trading sideways there is a coal stock, ACI that is close to breaking out of a 5 point blue triangle reversal pattern to the upside. This stock looks like a very good bargain in here for the next year or two if it takes out the top blue rail.

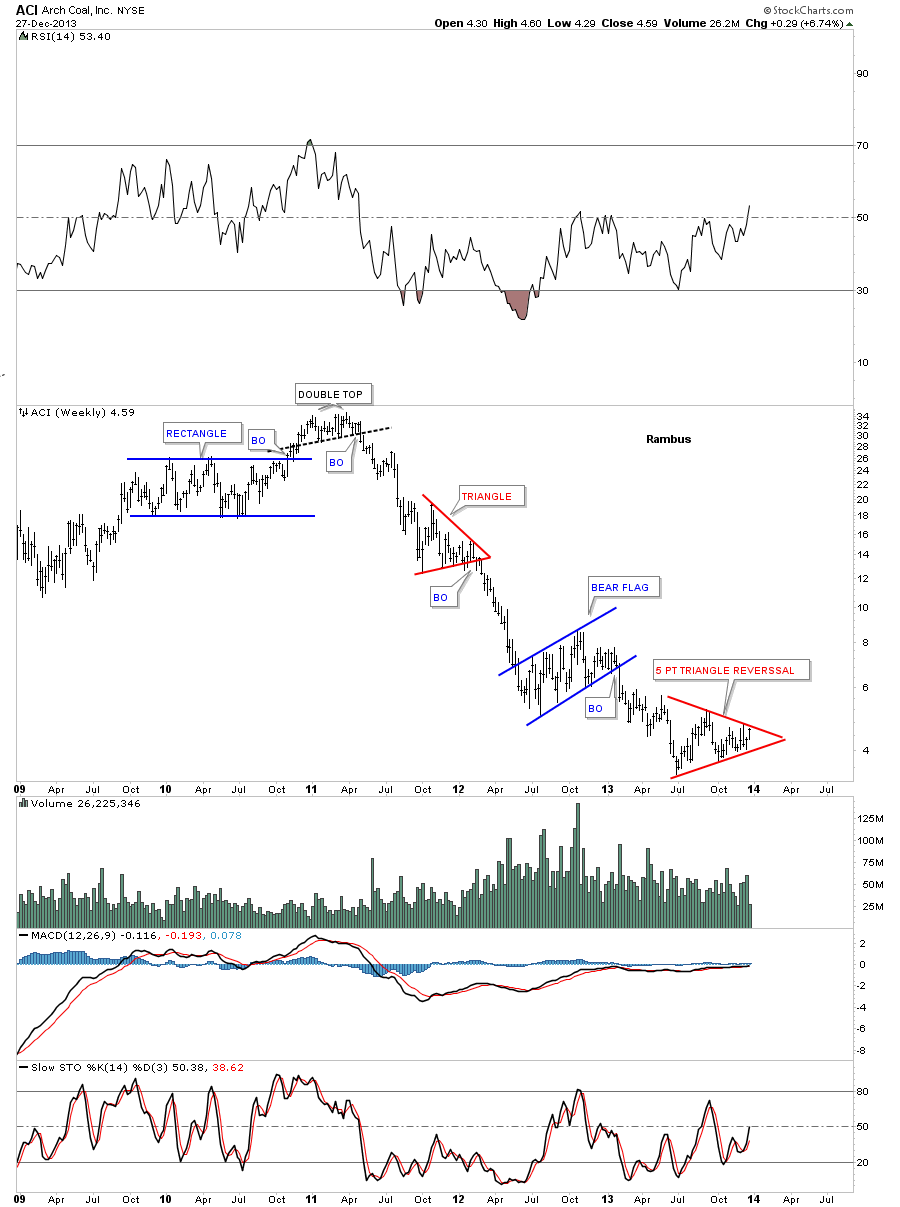
The weekly chart for ACI shows why it could be such a great bargain down here. Buy low and sell high applies to this stock. As you can see its been in a three year bear market with one consolidation pattern forming below the next. Now we may see a 5 point triangle reversal pattern forming at the bottom. This is a perfect Chartology chart of a bear market, complete with a topping pattern and hopefully a bottoming pattern with consolidation patterns that make up the bear market.

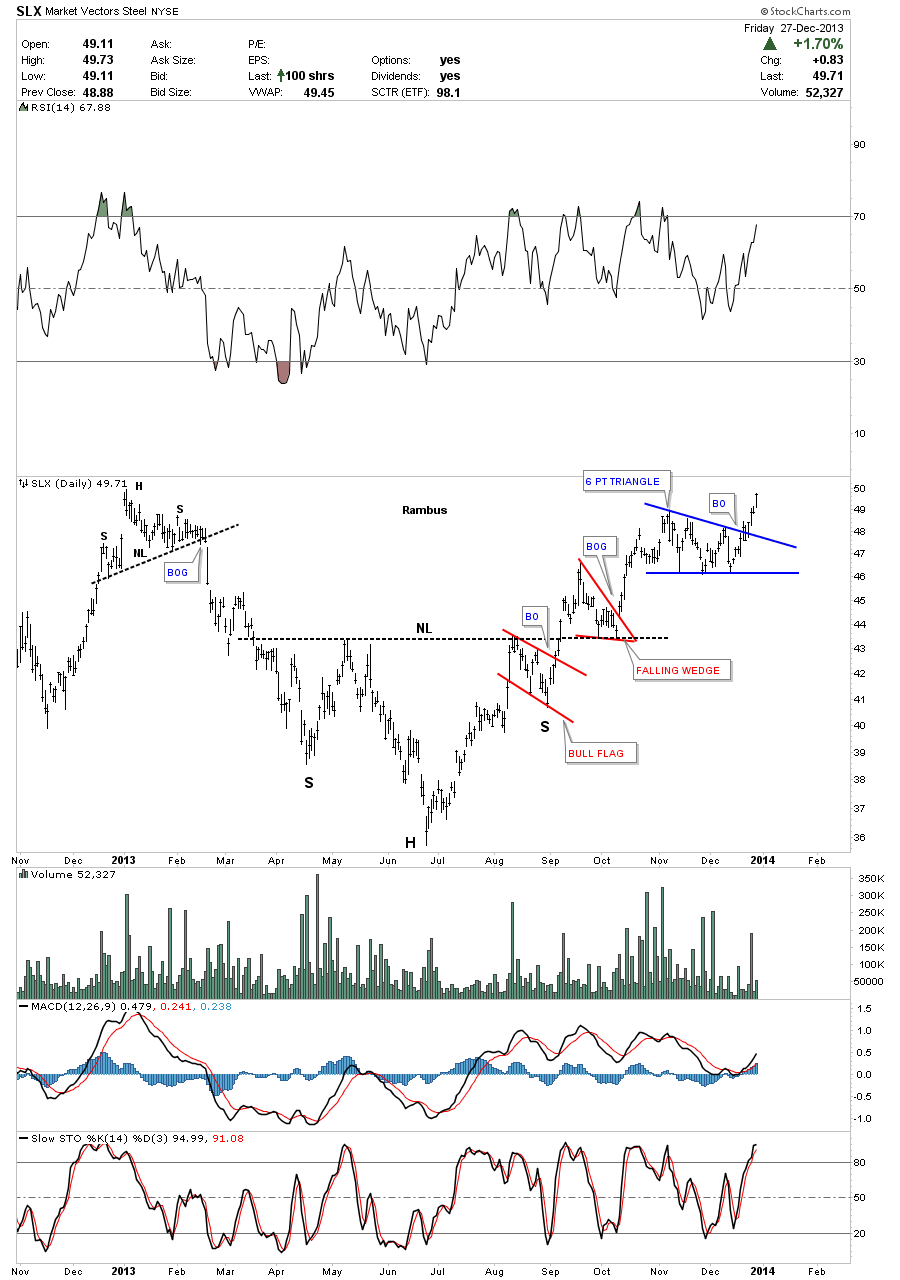
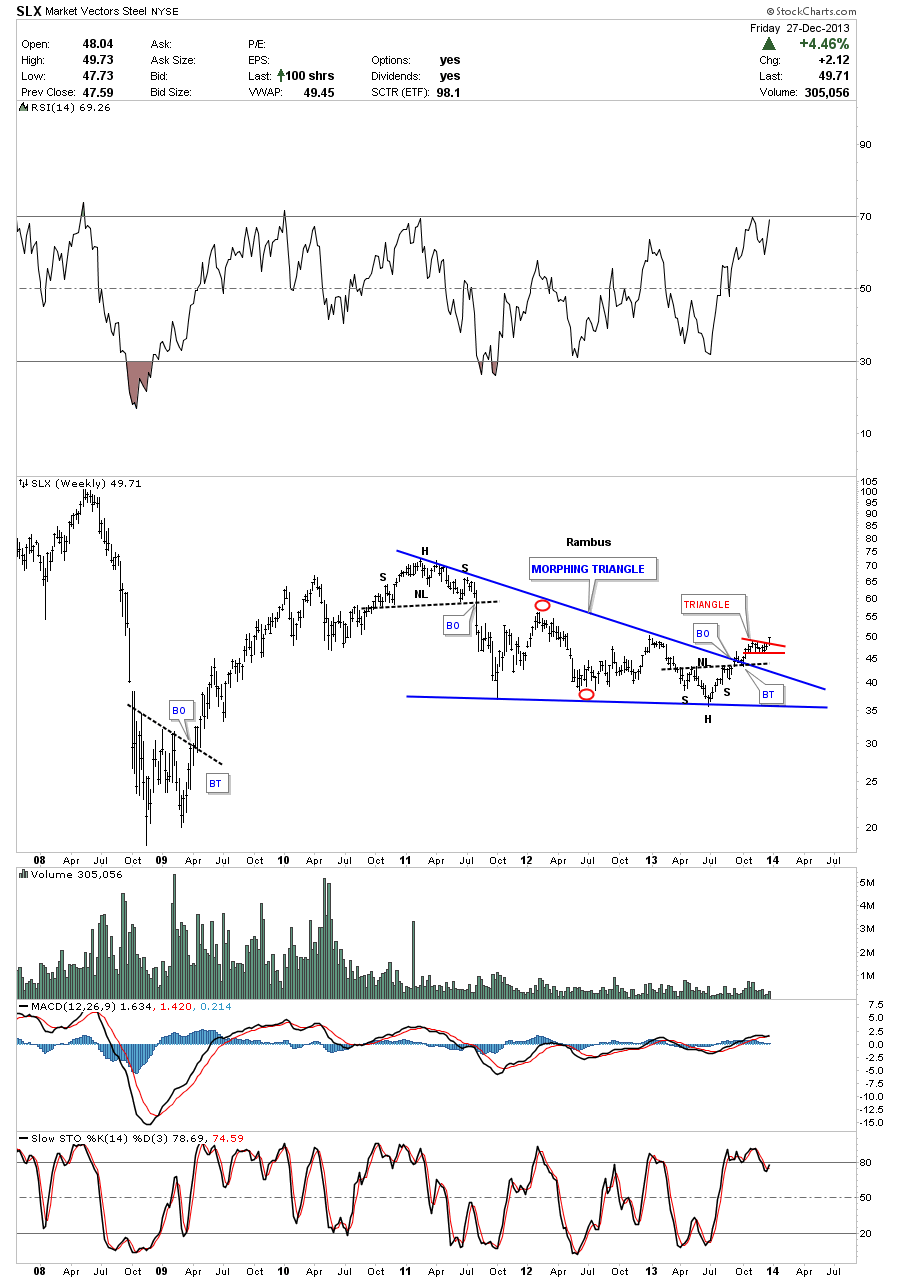
I believe the hottest area in the basic materials sector right now are the steel companies. First lets look at the SLX which is the steel eft. I have to admit Ive been watching this rally taking place for sometime now and never pulled the trigger. Its been building out some very nice chart patterns that have shown this etf to be in a bull market. Note the nice inverse H&S bottom followed by the red bull flag that formed just below the neckline and the red bullish falling wedge that formed just above the neckline. As I have shown you in the past, when you get a consolidation pattern that forms just below the neckline and then one that forms right on top of the neckline this is almost always a bullish setup. As you can see the SLX broke out of a 6 point blue triangle last week.

When looking at the daily chart above it looks like we already missed the big move up but when you look at the weekly chart you can see the rally is just really getting started. Just like the copper chart I showed earlier that had a morphing triangle, SLX also has the same morphing triangle as shown by the red circles. These morphing triangles can be very aggravating as they will give you a false buy and sell signal. When the price action doesnt follow through after the breakout that is when you start to take into consideration that the triangle maybe morphing, Its still valid only it will be just a bit bigger than previously thought. Most give up on these types of patterns but I find them very useful when its all said and done.

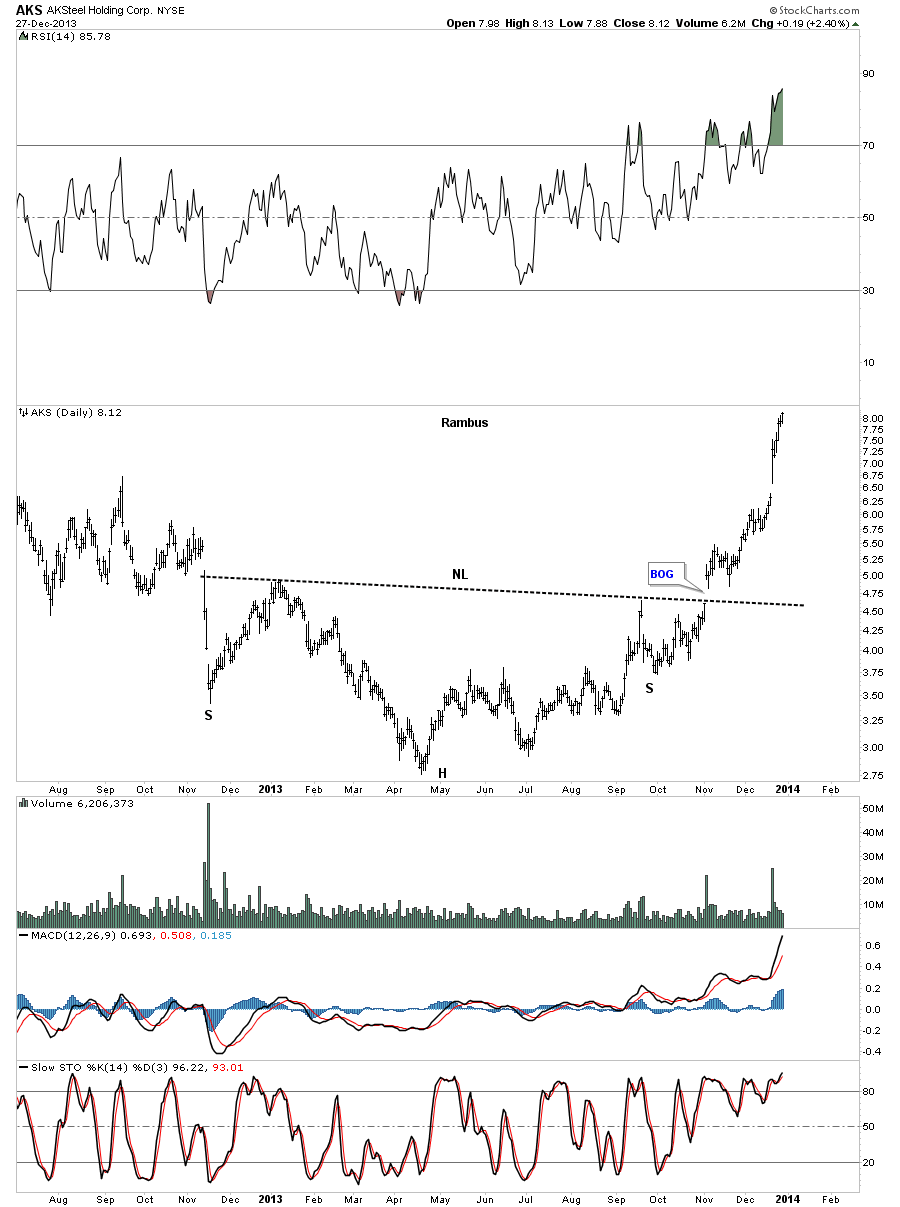
Lets now look at some individual steel stocks that are showing some strong moves taking place. Of all the steel stocks I follow AKS has probably been the strongest. You can see it had a nice inverse H&S bottom that completed with a big breakout gap. It hasnt hardly stop to rest yet.

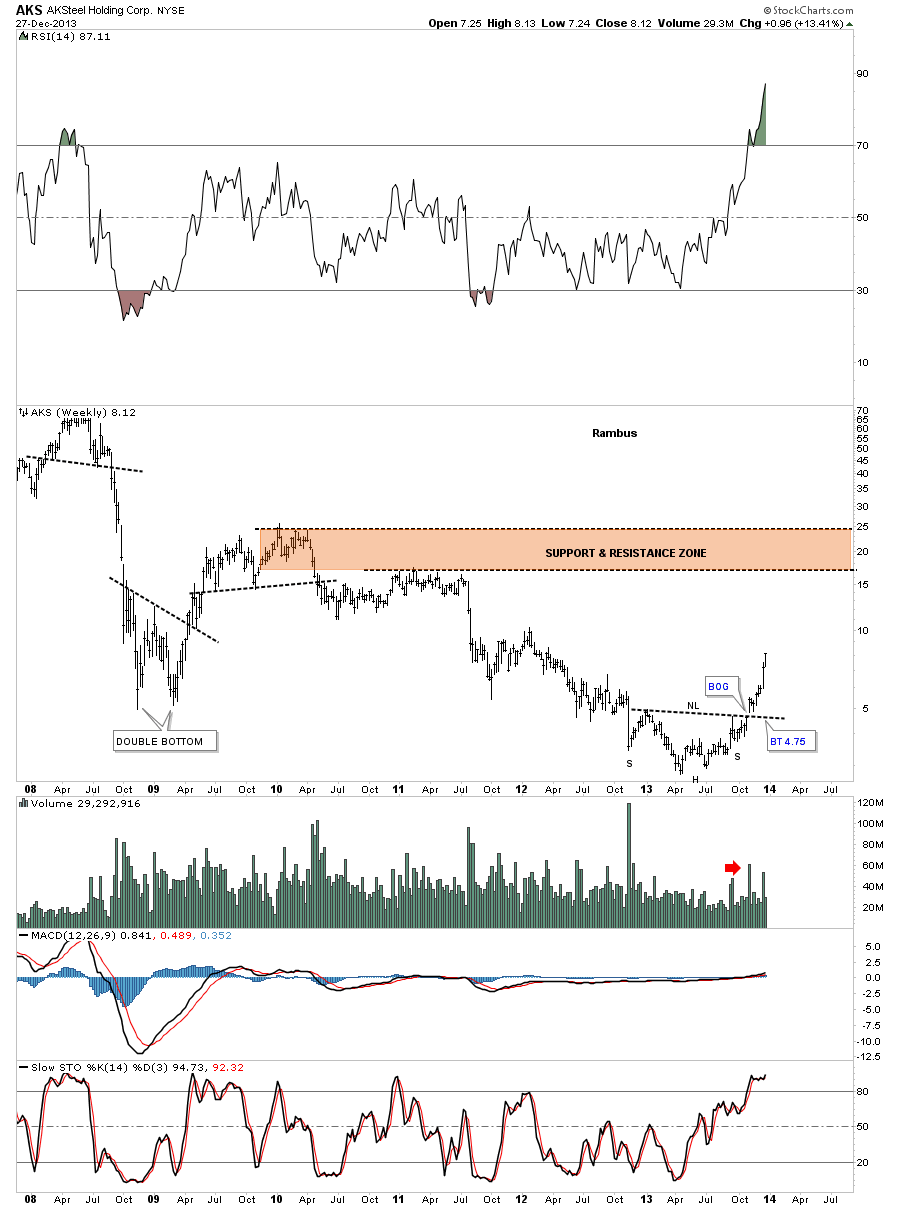
The weekly chart for AKS shows there is still a lot of upside potential left in this stock. At some point it will start to form a good consolidation pattern and thats when it will be time to pounce.

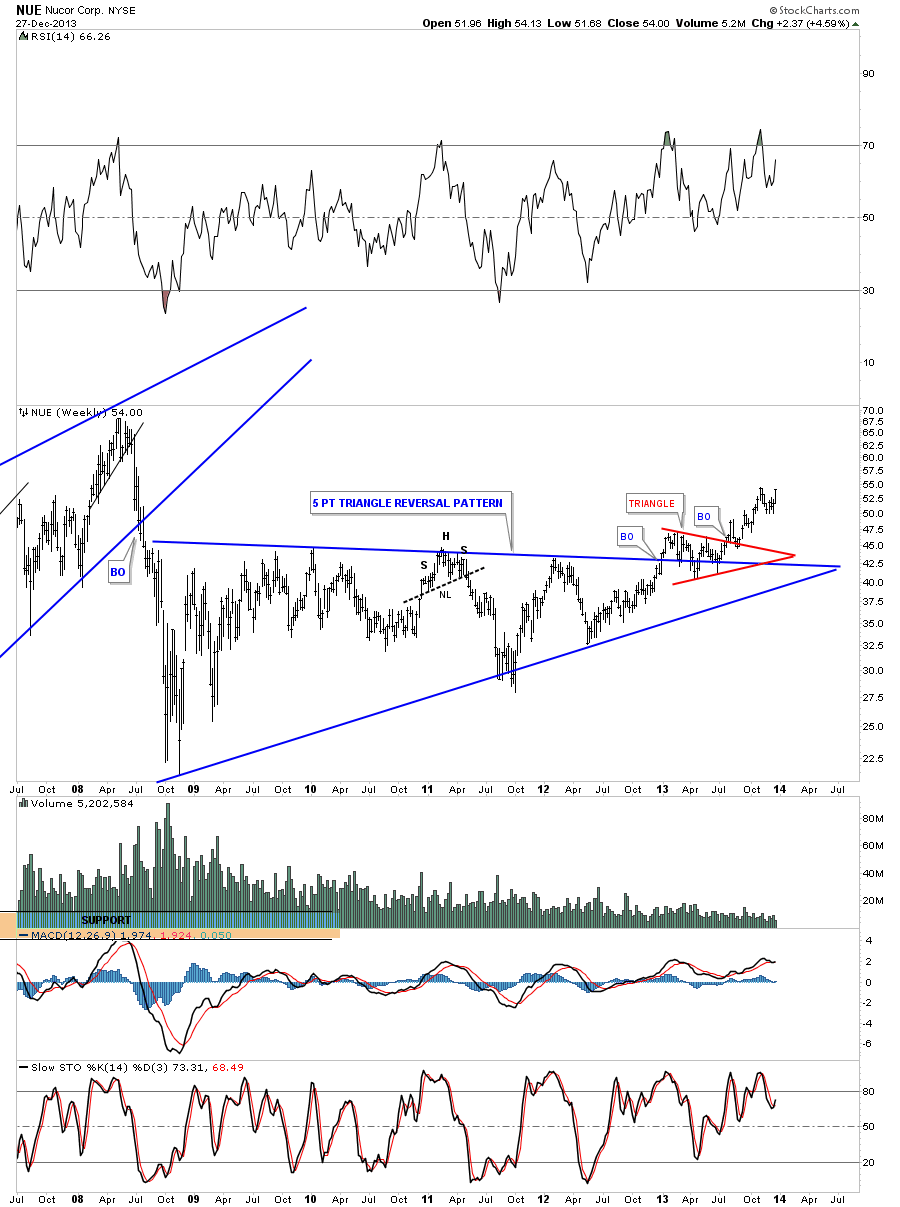
NUE has been one of the strongest steel stocks as shown by the weekly chart. Note the red triangle that formed right on the top rail of the blue triangle. This was a bullish setup.

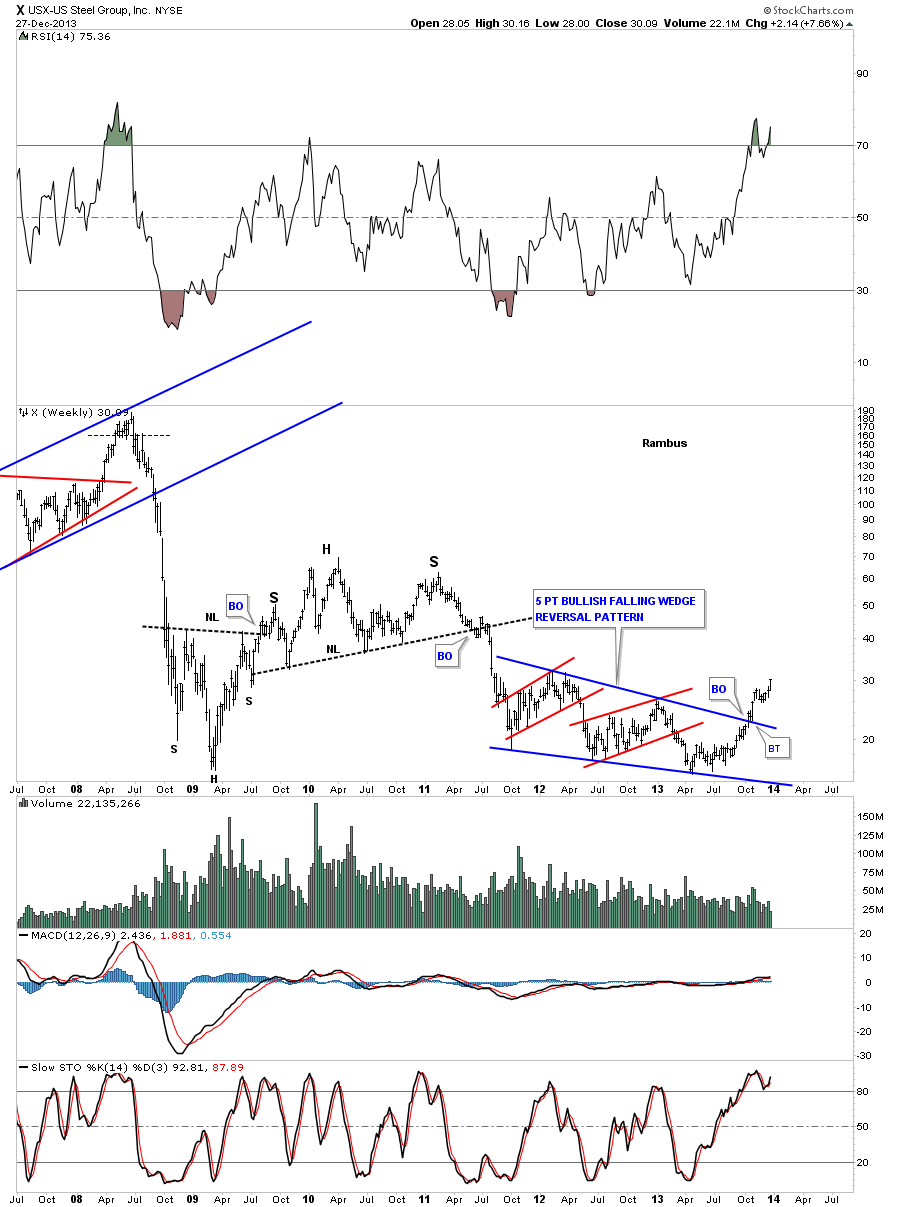
The last chart I would like to show you is a weekly look at US Steel that put in a five point bullish falling wedge reversal pattern to the upside. As you can see there is a huge potential for this stock.

The basic materials sector is telling us that there is truly a global recovery taking place at the moment. How long this recovery lasts is anybodies guess. The shippers have been confirming this for sometime now and we cant ignore what the charts are telling us. Its never just black and white as there are always cross currents running through the markets that can make them difficult to read sometimes. With Chartolgoy on our side we can keep on top of the changes even though the fundamentals might not agree with what the charts are saying. It looks like there are some good bargains in this sector that we can take advantage of if we can keep a clear mind. All the best
Rambus
http://rambus1.com/
-- Posted Monday, 30 December 2013 | Digg This Article | Source: GoldSeek.com


