-- Published: Friday, 17 January 2014 | Print | Disqus

Welcome to 2014.
One of the questions well be dealing with this year will be whether or not gold will have positive performance or not. Last year gold was amongst the worst financial performers of the year. However, thats not saying much as commodities as a whole did poorly. In fact when compared to the performance of stock indices, not many investments did as well. Yes there were overall gainers other than stocks such as real estate and WTI Crude Oil for example. The point Im making is that theres no getting away from the fact that gold was simply a terrible investment for 2013.
Can gold drop another set of double digits this year? Yes it can but because its starting 2014 at a much lower price, the impact wont be as great as in 2013.
Golds making a new contract lows on the last trading day of 2013 probably set the stage for the rally thats taken place since December 31st. I say this since reallocation of tracking funds, which are funds that track certain complexes, often takes place in the first two weeks of the New Year. The two most popular commodity tracking funds are the S&P-Goldman Sachs Commodities Index and the Dow Jones UBS Commodities Index. Funds that want to be long gold for the New Year generally establish their positions by mid-January, which give them a starting point from which to measure how theyre doing.
About the only mainstream story that didnt take place in 2013 was one of inflation in western economies. I realize that some second tier economies had inflation and that prices in China are bound to rise. However, Christen Lagarde, managing director of the International Monetary Fund was quoted on Wednesday as say in front of the National Press Club in Washington D.C. that with inflation running below many central banks targets, we see rising risks of deflation, which could prove disastrous for the recovery.
Fortunately theres time for central banks to act to dampen or avert the impact of deflation, assuming theyre quick enough to recognize it if it continues and more importantly take action. Dont assume thats a given. The European Central Bank is traditionally behind the curve, not in front of it. Inflation in the US remains very tame, not close to meeting Federal Reserve targets, yet the Fed has begun tapering. Tapering in and of itself does not create inflation, as it gradually removes a level of stimulus that was in place.
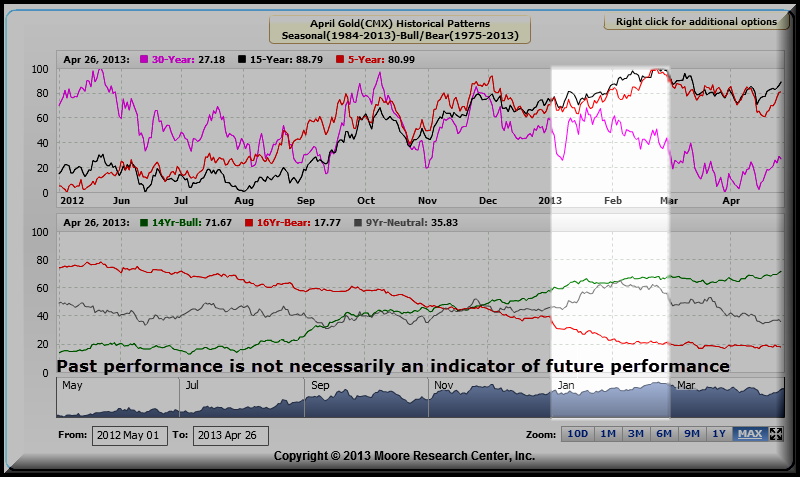
As you can see on the above Seasonal Chart, theres a strong historical tendency for gold prices to rally from the end of December into the end of January even in bear market years. The $70 rally were now witnessing fits into this scenario. February however is where the bulls and bears often show their true color, so if February is a down month, another bearish trading quarter likely to ensue.
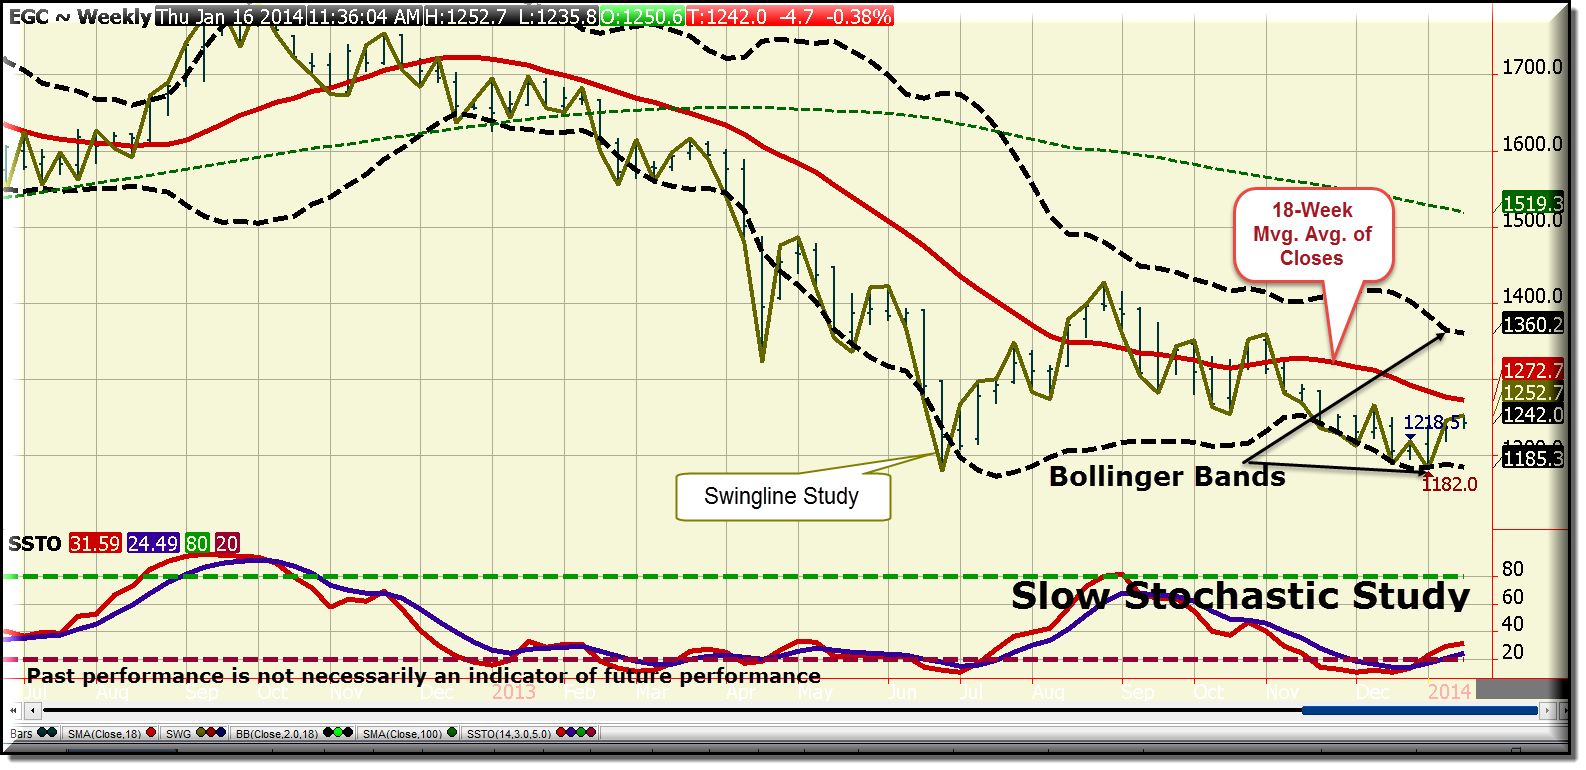
The first thing I notice on the above chart is that prices are trading under the 18-Week Moving Average of Closes. Therefore, I forecast this as a likely resistance point where if hit, will cause the rally to stall out. Currently this number is 1272.7. Keep in mind that next week this number will drop because of the mathematics of how a moving average is calculated. The weeks being dropped had higher closes than the weeks being added.
Its not at all uncommon for markets to try to get back to their 18-Week Moving Average of Closes after losing bearish embedded Slow Stochastic readings. Adding to the likelihood of this is that the Swingline Study lost its bearishness and turned neutral. The Swingline Study is not in a bull trend as it has a lower low of 1182 and a higher high of 1252.7. It simply has a higher high and lower low which is not a trend.
Prices did bounce off the lower Bollinger Band and the Slow Stochastic Study has lost its bearish embedded reading. But all this points to is a bounce, not a trend change.
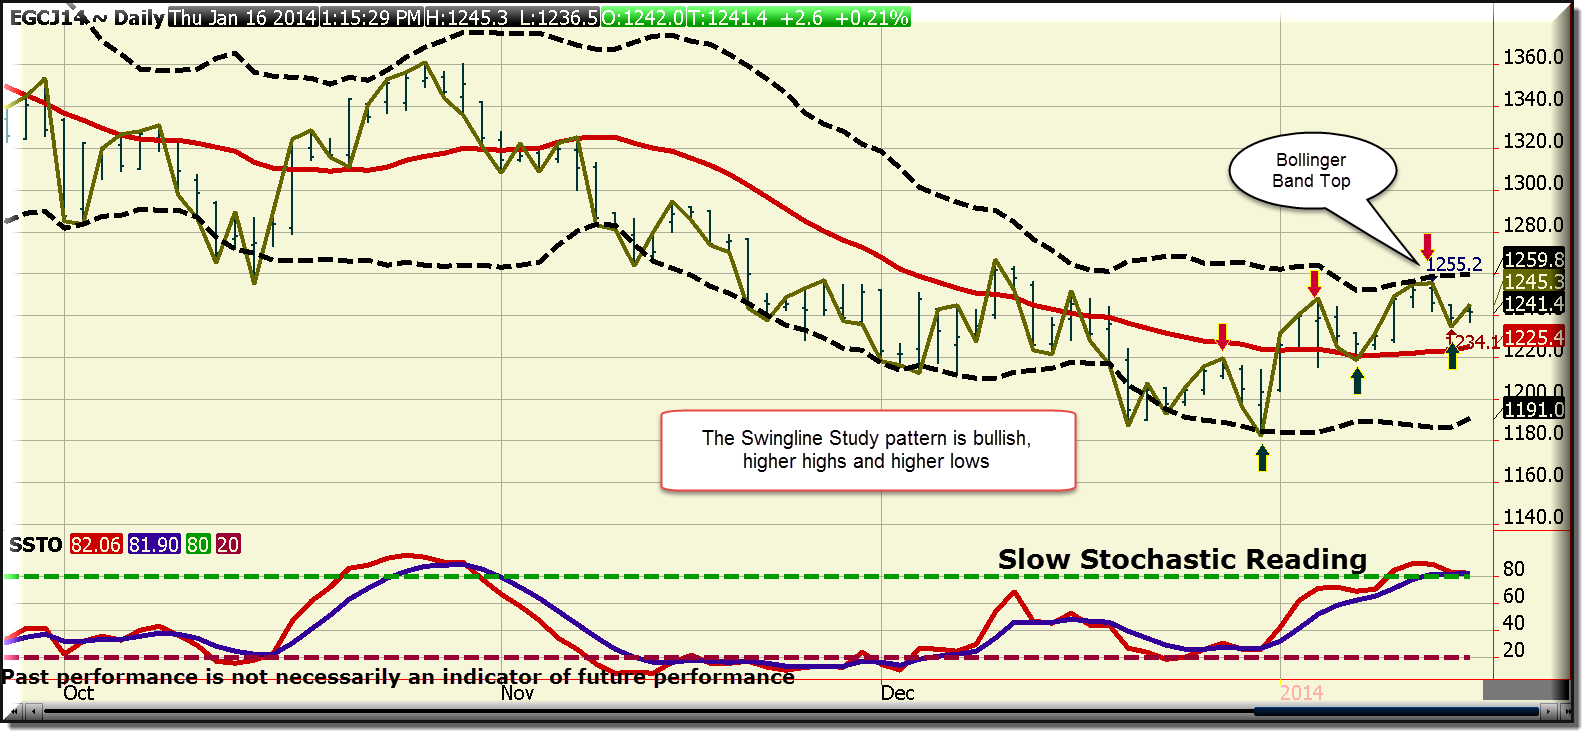
The above chart is that of the April 2014 Comex Gold contract.
I marked off with arrows the Swingline Study lows and highs. The Swingline pattern is now one of higher lows and higher highs, which means the Swingline indicator has confirmed its in an uptrend. In addition, prices are trading over the 18-Day Moving Average of Closes, 1225.4, which is the red center line going through the dashed black Bollinger Band lines
The first key resistance level on the Daily Chart is the Bollinger Band Top, which comes in at 1259.8.
The Slow Stochastic Reading confirmed on todays close that it shifted gears from being overbought to that of being embedded. This means that the two numbers that make this oscillator up, the K and the D lines, are both trading over 80. This means a bull trend has locked in and will stay that way as far as this reading is concerned until the K number, the one with a reading on this chart of 82.06 closes back under 80.
The combination of the Swingline in a bull stance along with The Slow Stochastic reading being embedded is technically speaking as much as can be asked. Now its up to price action to carry the market higher.
Heres how I started my summary in my last Gold Report. The odds now favor that we wont see new lows by year-end unless the Fed throws us a curve and does begin to taper at the December meeting. Dont just dismiss this possibility as it is an option, one I think remote at this time, but possible.
As you know the Fed surprised the market at its December FOMC Meeting and announced it was starting the tapering process. Shortly afterwards, gold began to break, culminating with a new yearly low made on the very last trading day in December.
Since then, gold hasnt looked back. Its sort of the flip-flop of action in the Dow Jones Industrial and S&P 500 Index. These indices made new highs on the last day of December for the year and have not seen those prices again.
So the question is what now. My guess is that the rally tries to continue, possibly getting up to the Bollinger Band Top of 1259.8. If this prices is exceeded, the 1270 level seen on the Weekly Chart might be an upside target.
On the flip side, if the Slow Stochastic reading loses its bullish embedded reading on the Daily Chart, that event will likely signal the end of this rally. Until that occurs, I think the bulls are in control and will try to move prices up to the Bollinger Band Top.
Therefore, purchases are warranted here, keeping an eye on the above.
Its very important that you keep your eye on is whether or not gold bucks the bear market tendencies on the Seasonal Chart. Bucking it would be defined as not breaking down in February, which might mean gold will be neutral to friendly in 2014.
On the other hand, if gold does breakdown and follow bearish year tendencies to break hard in February that would be a very bad sign, probably leading to new contract lows in the April Gold Contract, which would also lead to ideas that will have a losing year in 2014.
To become as subscriber, simply clicking below or copying this link:
http://www.iraepstein.com/client-non-client.html
Disclaimer: This publication is strictly the opinion of its writer and is intended solely for informative purposes and is not to be construed, under any circumstances, by implication or otherwise, as an offer to sell or a solicitation to buy or trade in any commodities or securities herein named. Information is taken from sources believed to be reliable, but is in no way guaranteed. Chart data is courtesy of LGP-IraCharts. No guarantee of any kind is implied or possible where projections of future conditions are attempted. Futures and Options on Futures trading involve risk. In no event should the content of this market letter be construed as an express or implied promise, guarantee or implication by or from The Ira Epstein Division of The Linn Group, Inc. or The Linn Group, Inc. that you will profit or that losses can or will be limited in any manner whatsoever. No such promises, guarantees or implications are given. Past results are not indicative of future performance.
If youd like more information about trading gold, simply call us at
1-877-973-2077.
| Digg This Article
-- Published: Friday, 17 January 2014 | E-Mail | Print | Source: GoldSeek.com


