Why the Recent Lift in Junior Miners Will Likely Continue
-- Published: Tuesday, 28 January 2014 | Print | Disqus
By Frank Holmes CEO and Chief Investment Officer U.S. Global Investors
Junior venture companies in Canada are finally seeing a significant lift.
In early January, the S&P/TSX Venture Composite Index rose above the 200-day moving average for the first time in three years. The index is also very close to experiencing a golden cross, which is when the shorter-term 50-day moving average crosses above the 200-day moving average. Historically, traders see this cross as extremely bullish.
You can see on the chart that there have been few occurrences of golden crosses over the past five years, with one in 2009 and another in 2011. Following these crosses, the index saw a spectacular increase.
The Canadian venture index holds 372 micro-capitalization securities that trade on the S&P/TSX exchange. Its a resources-heavy index, with more than 80 percent of the holdings in the energy and materials sector. Making up the top 10 by weight are energy companies including Africa Oil, Mart Resources, Americas PetroGas and Madalena Energy.
Materials stocks such as Atico Mining, Balmoral Resources, Chesapeake Gold, Energold Drilling, Gold Standard Ventures, Rye Patch Gold, and Santacruz Silver Mining are also constituents.
These stocks will be familiar to the shareholders of the World Precious Minerals Fund (UNWPX), as they are representative of the funds holdings. Historically, weve found that these junior mining companies outperformed their larger counterparts.
As resource investors, were particularly encouraged by this golden cross, but what makes us even more optimistic is further data supporting the cyclical areas of the market.
Cyclical companies in sectors such as information technology, industrial, materials, and consumer discretionary tend to sell goods and services beyond the basic needs. These are the goods and services businesses and consumers buy when times are good.
So consider the potentially major impact that increased investment spending might have on these companies. After curtailing capital expenditures following the Great Recession, businesses may be in the process of reversing that trend after a prolonged period of under-investing.
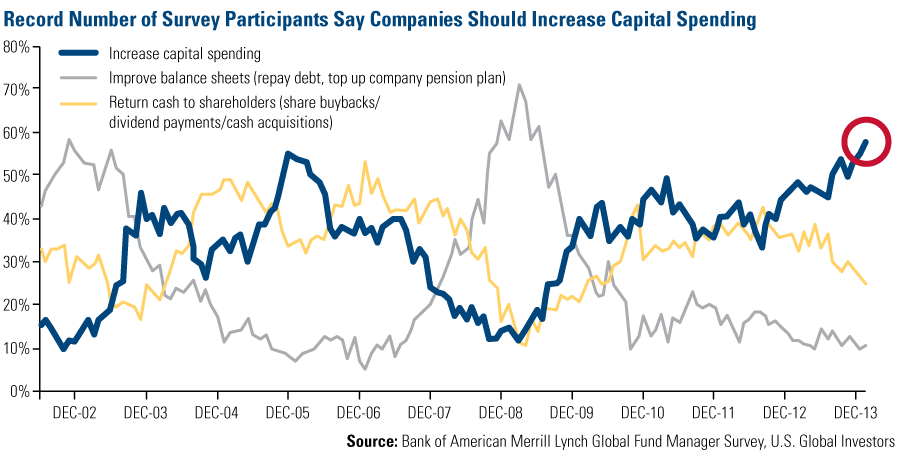
According to Bank of America Merrill Lynchs newest fund manager survey, which involved 234 participants that manage nearly $700 billion in assets, participants are frustrated with companies that have been hoarding their cash. Comparing the latest results to survey data going back a full decade, a record 58 percent of participants said they wanted corporate cash to be spent on capital investment.
Another record 67 percent say that companies are under-investing, says BofA-ML survey data.
This is the most conviction since 2001, which likely means that the boards of public companies will find it tough to ignore the massive shift in sentiment, says Brian Belski of BMO Capital Markets.
Were pleased with this change of opinion, as capital investment helps propel the economy and boosts productivity and profits. Investors also see a potential boost: As companies begin spending their cash on things such as productivity-boosting software and capital equipment, businesses in technology and industrials sectors likely benefit.
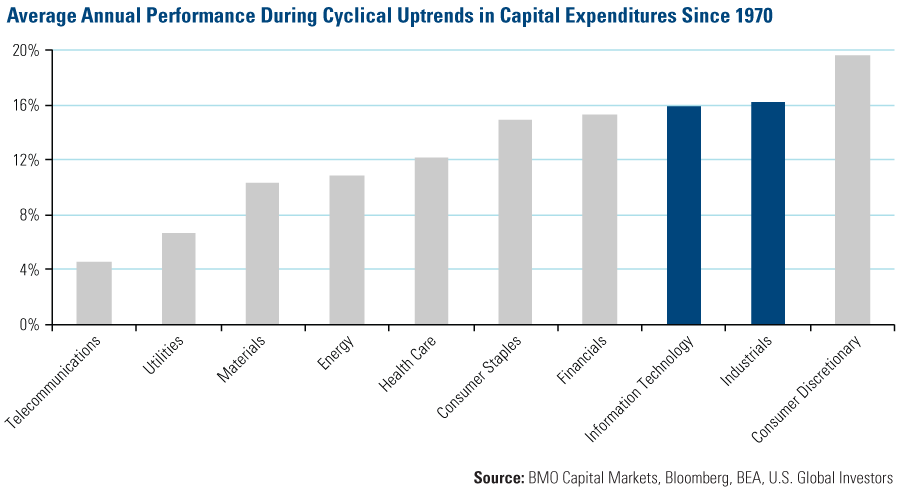
Take a look at BMOs chart below, which shows the average annual performance during these cyclical uptrends in capital expenditures. The data goes back to 1970, so it provides tremendous historical support. As you can see, information technology and industrials are among the sectors that benefited the most from capital expenditure growth. During these periods, these stocks climbed an average of about 16 percent.
In contrast, telecommunications and utilities have the weakest performance during the uptrends.
Whats so appealing about this chart is that these cyclical areas of the market have also been tagged in our Holmes Macro Trends Fund (ACBGX) model as relatively strong sectors. And while information technology, industrials and consumer discretionary have already performed well, weve identified fundamentals that suggest these areas of the market will continue rising in value.
Belski lists individual stocks that he believes can benefit from the rising capital expenditures. Some of his picks that overlap with our funds holdings include Danaher, Flowserve, Wabash National and QUALCOMM.
We think thats especially encouraging data for shareholders of the Holmes Macro Trends Fund.
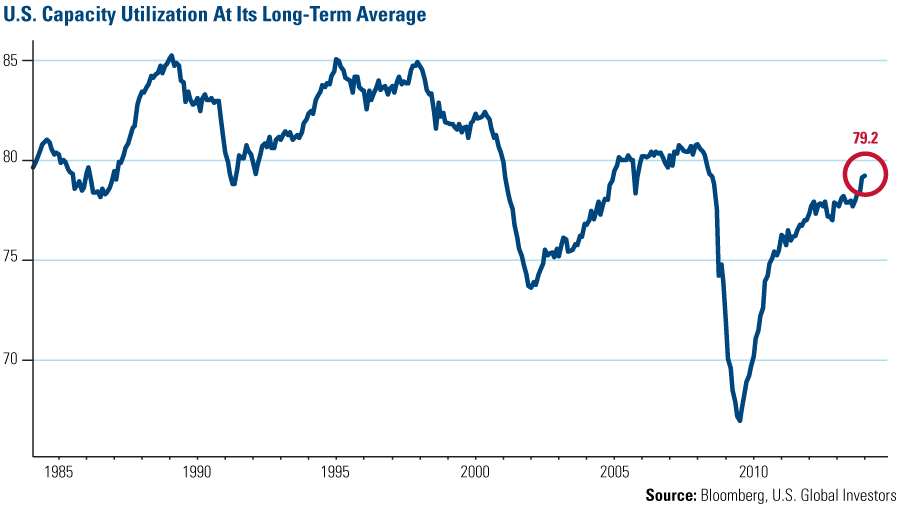
If this increase in capital expenditures materializes, it could stress factories even further, as capacity utilization climbs toward its long-term average. Capacity utilization measures the extent that factories are in use, and currently, manufacturing companies are operating at 79.2 percent of full capacity. The average since 1980 has been 79.4 percent.
This rate is significantly different compared to June 2009, when the rate dropped to a record low 66.8 percent. Its no surprise that manufacturing has been staging a huge comeback following the recession but the chart below illustrates the continuing rising trend since it hit bottom.
With the potential uptrend in investment spending coupled with factories cranking out goods at a faster, busier pace, chances are good well see continued growth from cyclical areas of the market, especially in tech and industrials.
And if the utilization rate keeps climbing higher, companies wont be able to increase their output without incurring additional fixed costs to purchase new machinery or build new facilities. Thats bullish for metals and mining companies, such as many of the businesses held in the S&P/TSX Venture Composite Index. Make sure your portfolio is poised to participate.
Want to read more on global markets? Share your email address and well send you a note the next time Frank Holmes posts to his blog. You can also keep informed by following U.S. Global Investors on Twitter or Facebook.
Please consider carefully a funds investment objectives, risks, charges and expenses. For this and other important information, obtain a fund prospectus by visiting www.usfunds.com or by calling 1-800-US-FUNDS (1-800-873-8637). Read it carefully before investing. Distributed by U.S. Global Brokerage, Inc.
Gold, precious metals, and precious minerals funds may be susceptible to adverse economic, political or regulatory developments due to concentrating in a single theme. The prices of gold, precious metals, and precious minerals are subject to substantial price fluctuations over short periods of time and may be affected by unpredicted international monetary and political policies. We suggest investing no more than 5 percent to 10 percent of your portfolio in these sectors.
Past performance does not guarantee future results. All opinions expressed and data provided are subject to change without notice. Some of these opinions may not be appropriate to every investor. The S&P/TSX Venture Composite Index is a broad market indicator for the Canadian venture capital market. The index is market capitalization weighted and, at its inception, included 531 companies. A quarterly revision process is used to remove companies that comprise less than 0.05% of the weight of the index, and add companies whose weight, when included, will be greater than 0.05% of the index.
Holdings in the World Precious Minerals and the Holmes Macro Trends funds as a percentage of net assets as of 12/31/13: Africa Oil Corp. 0.0%, Americas PetroGas Inc. 0.0%, Atico Mining Corp. (World Precious Minerals Fund 0.56%), Balmoral Resources Ltd. (World Precious Minerals Fund 0.60%), Mart Resources 0.0%, Madalena Energy 0.0%, Chesapeake Gold Corp. (World Precious Minerals Fund 1.18%), Energold Drilling Corp. (World Precious Minerals Fund 0.46%), Gold Standard Ventures Corp. (World Precious Minerals Fund 0.79%), Rye Patch Gold Corp. (World Precious Minerals Fund 0.64%), Santacruz Silver Mining Ltd. (World Precious Minerals Fund 0.67%), Danaher Corp. (Holmes Macro Trends Fund 0.51%), Flowserve Corp. (Holmes Macro Trends Fund 0.52%), Wabash National Corp. (Holmes Macro Trends Fund 0.66%), QUALCOMM (Holmes Macro Trends Fund 1.57%)
The content on this site is protected
by U.S. and international copyright laws and is the property of GoldSeek.com
and/or the providers of the content under license. By "content" we mean any
information, mode of expression, or other materials and services found on GoldSeek.com.
This includes editorials, news, our writings, graphics, and any and all other
features found on the site. Please contact
us for any further information.
Live GoldSeek Visitor Map | Disclaimer
The views contained here may not represent the views of GoldSeek.com, Gold Seek LLC, its affiliates or advertisers. GoldSeek.com, Gold Seek LLC makes no representation, warranty or guarantee as to the accuracy
or completeness of the information (including news, editorials, prices, statistics,
analyses and the like) provided through its service. Any copying, reproduction
and/or redistribution of any of the documents, data, content or materials contained
on or within this website, without the express written consent of GoldSeek.com, Gold Seek LLC,
is strictly prohibited. In no event shall GoldSeek.com, Gold Seek LLC or its affiliates be
liable to any person for any decision made or action taken in reliance upon
the information provided herein.