-- Published: Monday, 10 February 2014 | Print | Disqus
By Rambus
In this Weekend Report were going to look at some short term charts for the precious stock indexes and try to decipher if this congestion zone theyve been trading in for the last two weeks or so is a consolidation pattern that will allow the price action to rally up to the next area of resistance or is this two week chopping action actually a topping pattern and the precious metals stocks are in for another rough go of it. Man that was a long sentence. The sooner we can figure out what has been building out over the last several weeks the sooner we can take advantage of the situation.
Many times a line chart can give you a quicker entry point vs a bar chart. As were looking at the short term, two weeks or so, the first set of charts I want to show you is a 30 minute line chart. A line chart can take out a lot of the nose, such as a spike high or low, that can change the looks of a chart pattern quite a bit. It just uses the closing price for whatever time period you are looking at, in this case it will be the 30 minute charts.
As you know in the last hour of trading on Friday I started to build a position in the PM stocks based on what I was seeing on the line charts. I was waiting for a decent break and finally got it toward the end of the day. The breakout is small yet but there was also a backtest to the top rail if you look real close.
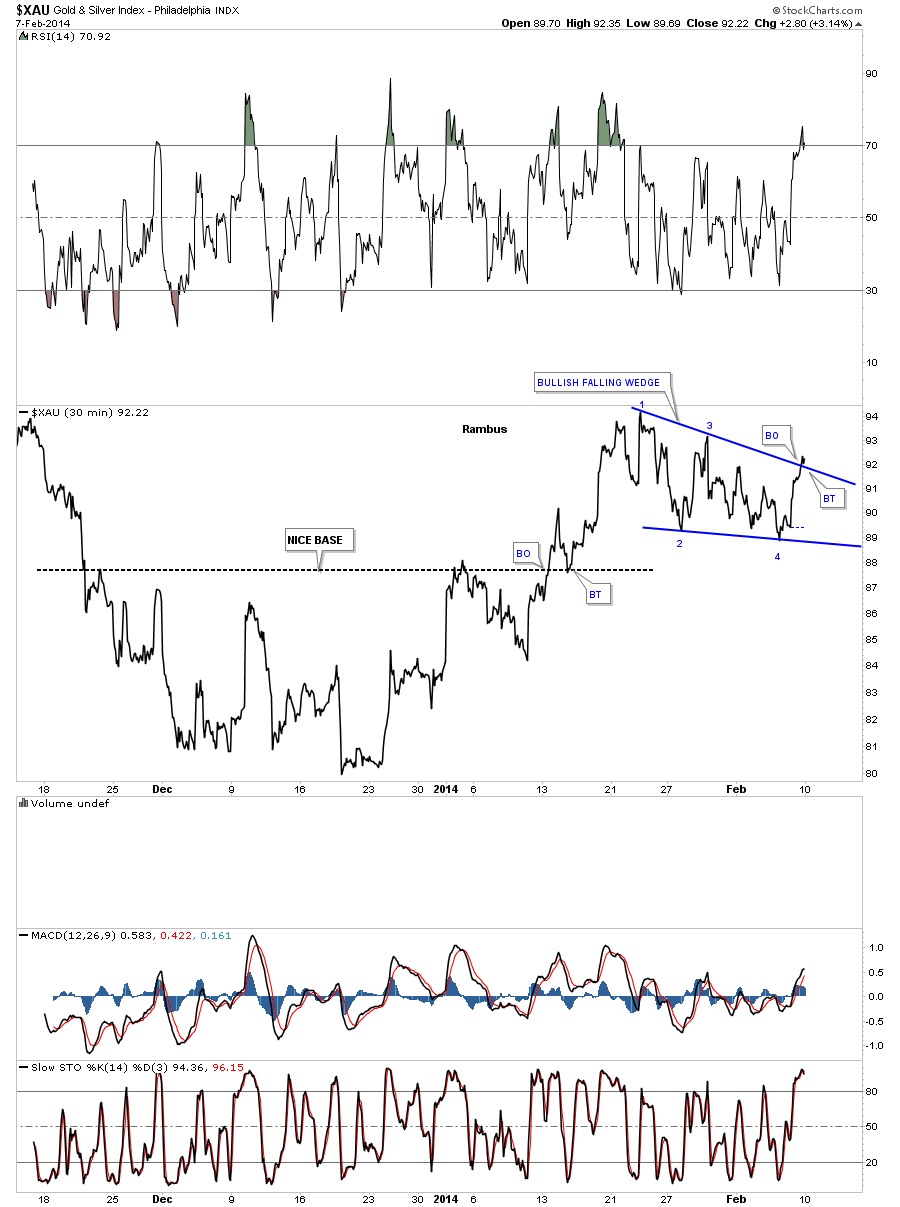
Lets start with the XAU that shows us a four point bullish falling wedge with the really small breakout and backtest. Keep in mind the XAU is not the leader right now so this little breakout and backtest is important IMHO. Also when you look at these 30 minute charts notice the area at the bottom of the charts that Ive labeled as Nice Base. If you, recall when the area under the black dashed horizontal rail was being put in, we were seeing small reversal patterns such as a 5 point bullish falling wedges and some rectangles. They will be easier to see on a bar chart. The point is we do have a base in place which has broken out to the topside. The price action has rallied up to form a consolidation pattern and that consolidation pattern has broken out to the upside. So far this is an uptrend. The real confirmation will be when the price action trades above the previous little high in this consolidation pattern.

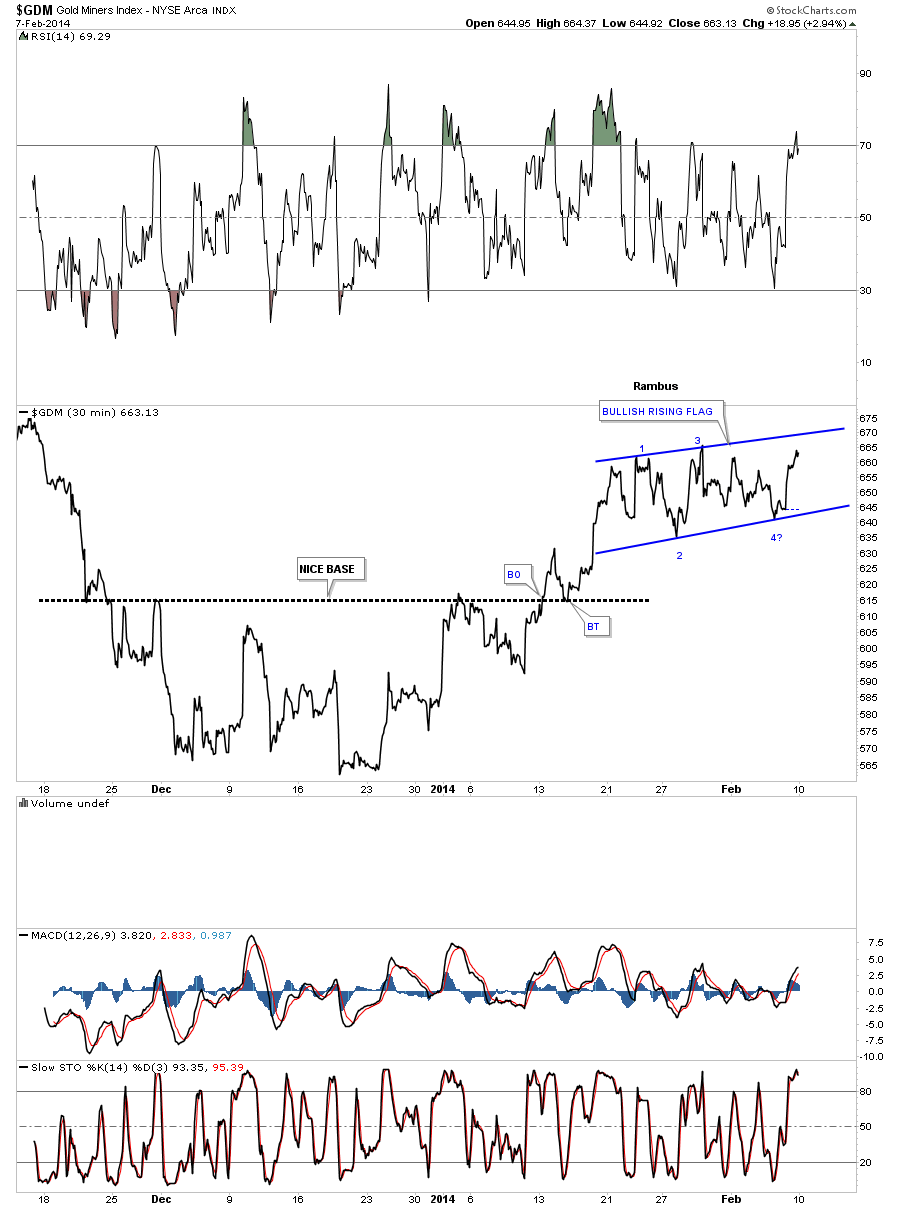
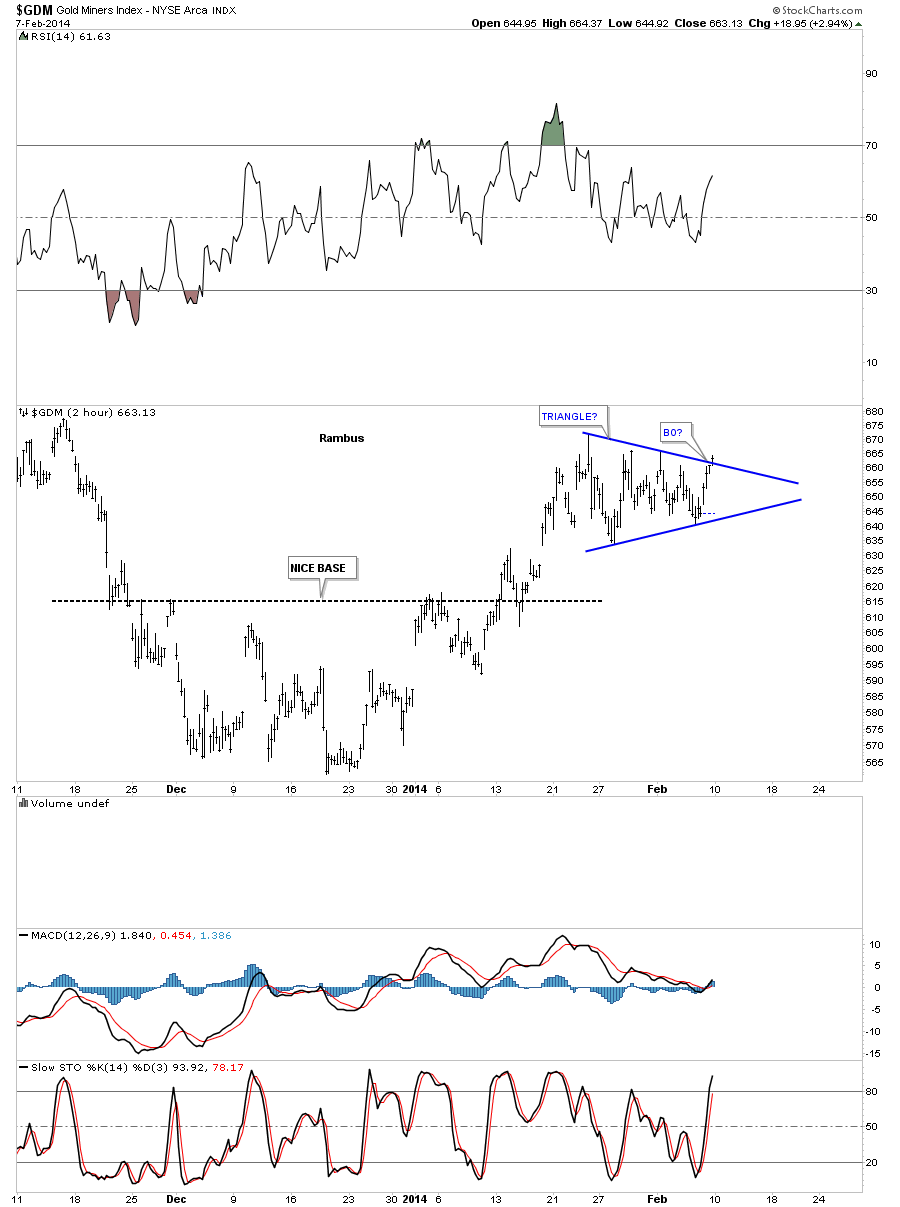
Keep in mind these 30 minute line charts are giving us a different perspective of what you will see when I show you the two hour bar charts a bit later. The GDM is still trading inside its consolidation pattern but is trading up toward the top. It is actually showing some relative strength to some of the other PM stock indexes.

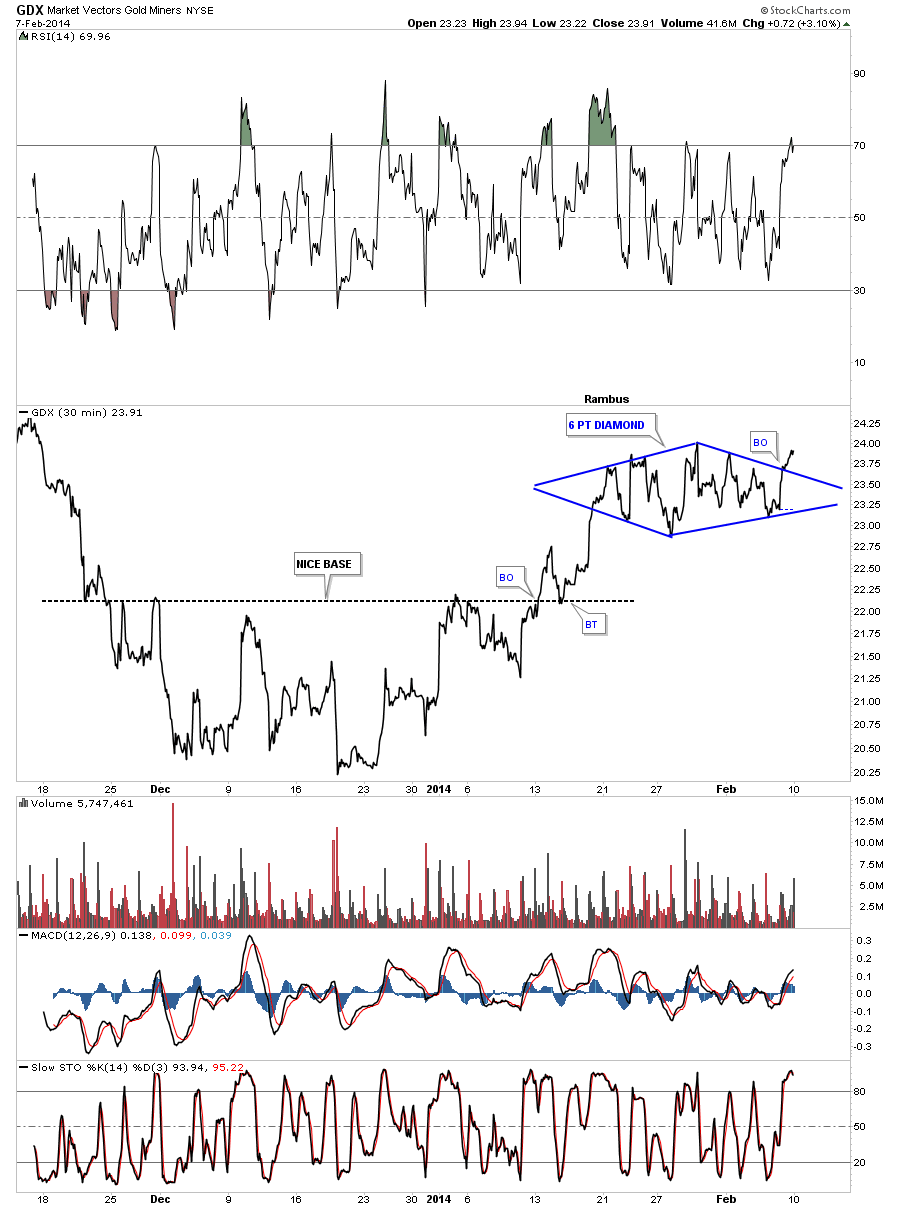
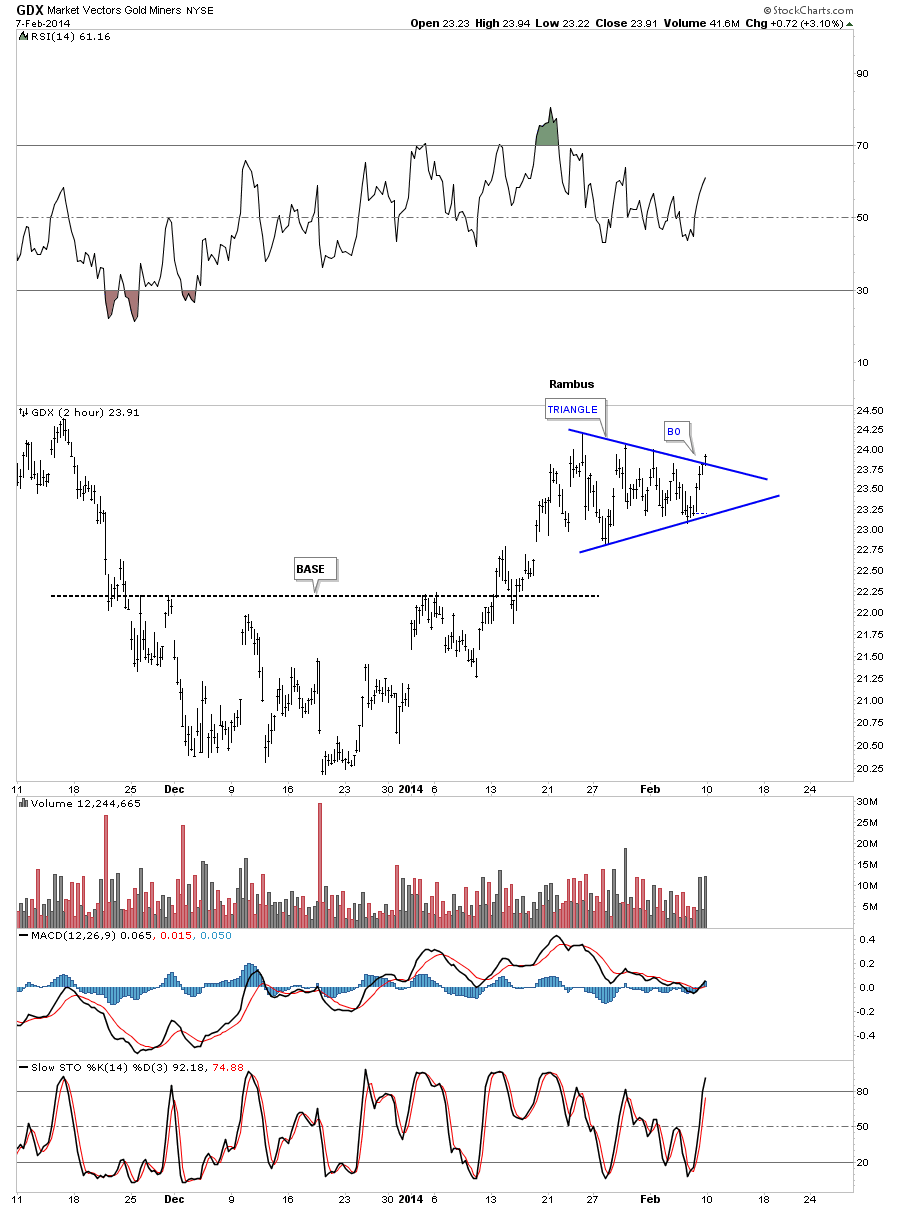
These next two charts shows a completely different look than the two above. I think Miss Patty caught on to this pattern early on in their development. Im referring to the Diamond consolidation pattern because these Diamonds have 6 reversal points. As you can see on the GDX chart below the breakout from the Diamond is well into its breakout move. We cant rule out a backtest but the breakout looks good so far.

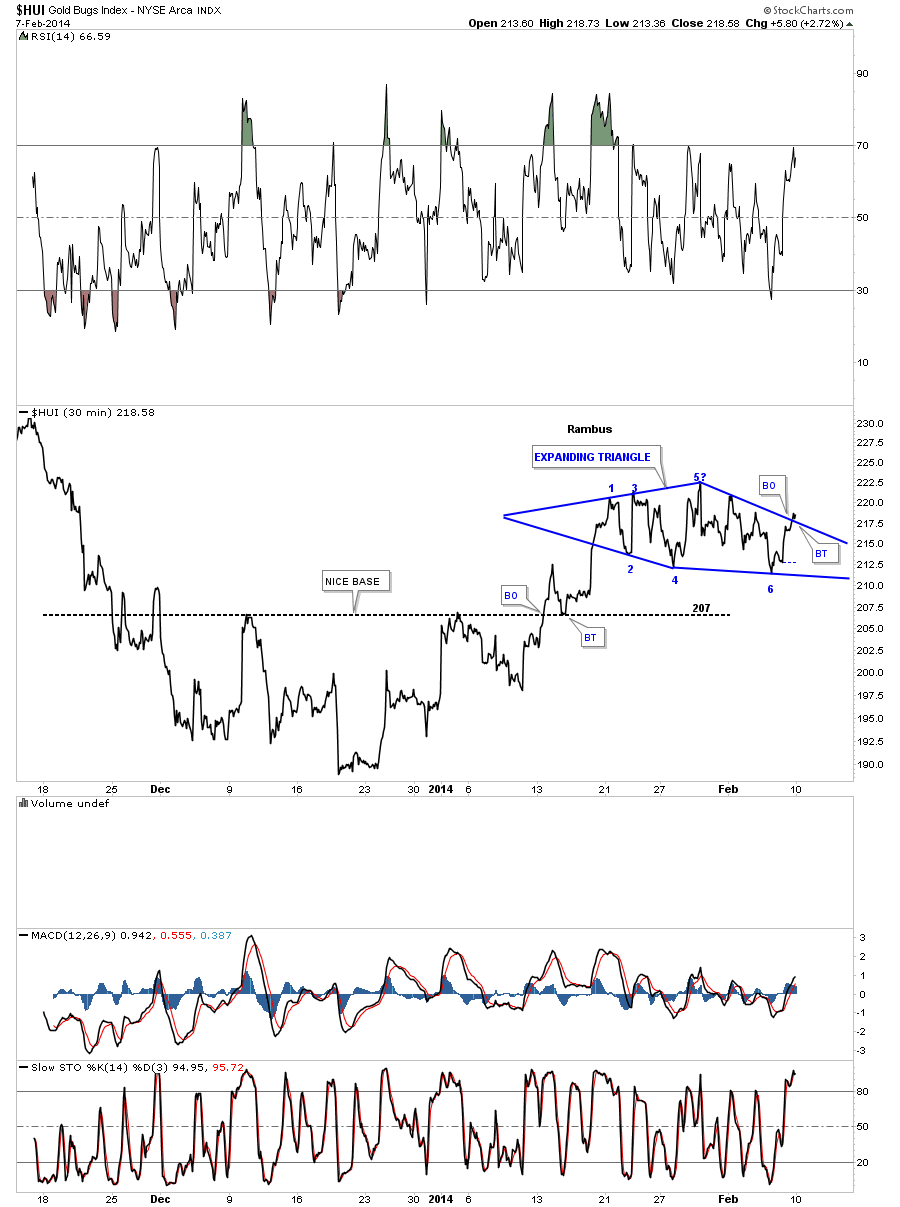
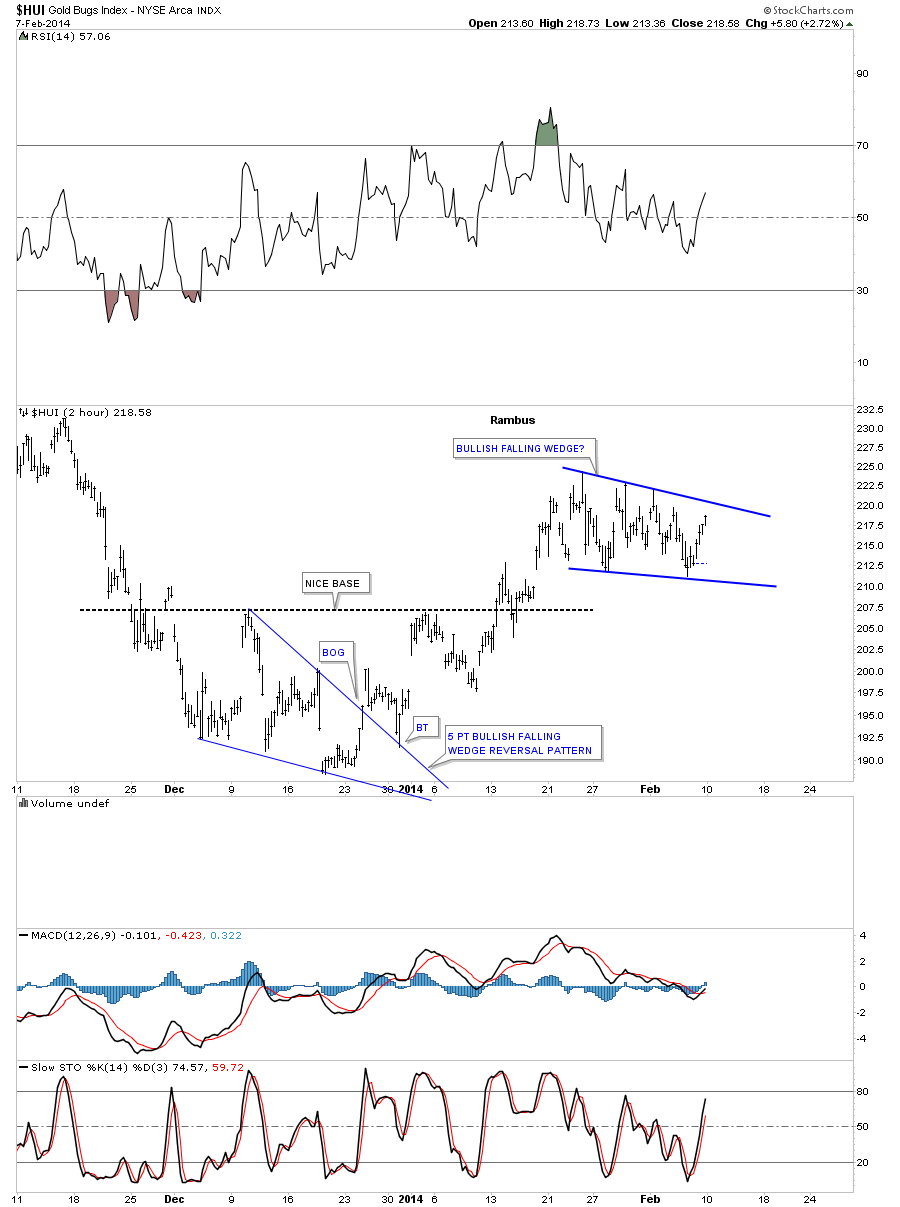
Below is the HUI and its Diamond pattern. I left my original annotation on the chart that says, Expanding Triangle. The reason I left it on the chart is because when a Diamond is forming it starts out as an expanding triangle. Also the HUI is the weakest of the PM stock indexes right now, as you can see by how far down its from its high.

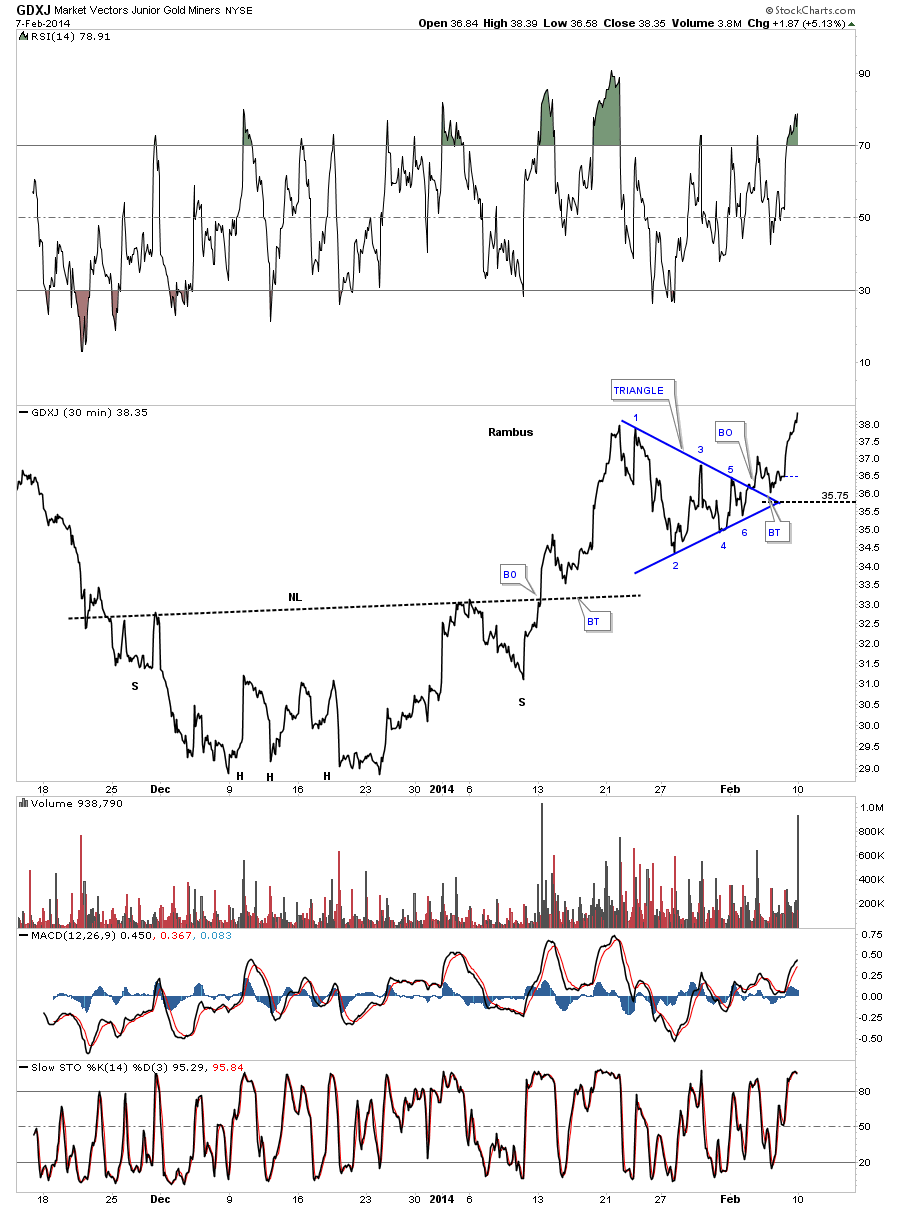
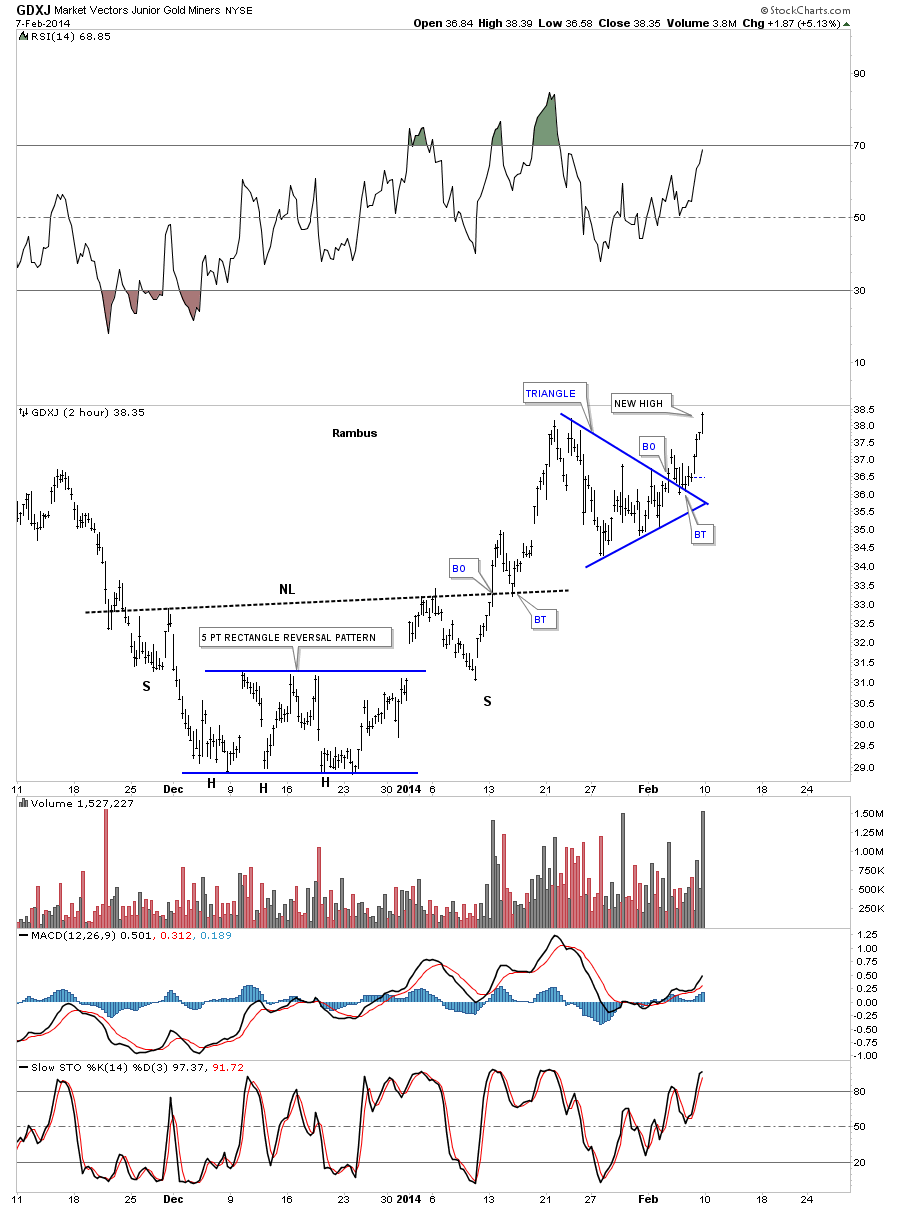
This next chart for the GDXJ shows you why I think the precious metals stocks are going to breakout to the upside. As Ive been showing you the little juniors have been stealing the show from the big cap PM stocks. Last Friday was a crucial day as the apex of its triangle held support and the GDXJ took off closing at a new high for his move. That is the confirmation I wanted to see.

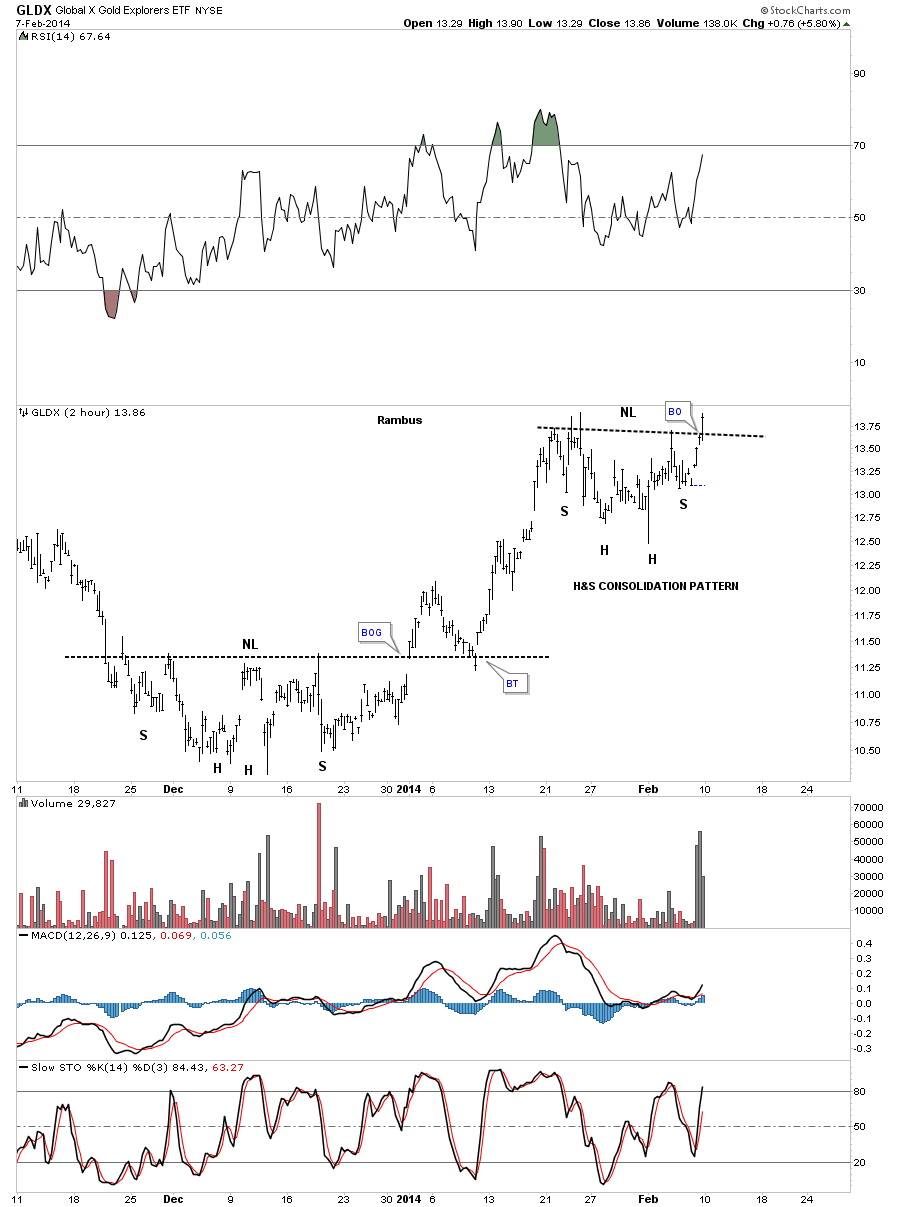
This next chart is a 2 hour look at the GLDX which is a junior gold explorers etf. Again you can see how these small caps are leading the way. It wasnt until the end of the day that we got the breakout from the H&S consolidation pattern but we got the breakout. Notice the volume bars at the bottom of the chart.

I wont go into much detail on these 2 hour bar charts for the precious metals stock indexes as they are pretty self explanatory. When you look at this next set of charts notice the volume bars that were left at the end of trading last Friday. GDM.

I left in the original 5 point bullish falling wedge reversal pattern that I know most of you have already forgotten about. It was this little pattern that reversed the downtrend that started at the top of the right shoulder high on that massive H&S top. As you can see its now is part of the base.

The GDX cracked its top rail at the close on Friday.

When you compare the GDXJ to the big cap PM stock indexes there is no doubt who is leading the charge. I know a lot of folks dont like to trade these little guys but they have been very good to me in the past. I know some of you who traded them back in the early days of their bull market know what I mean. They have been so out of favor for so long they are playing catch up right now.

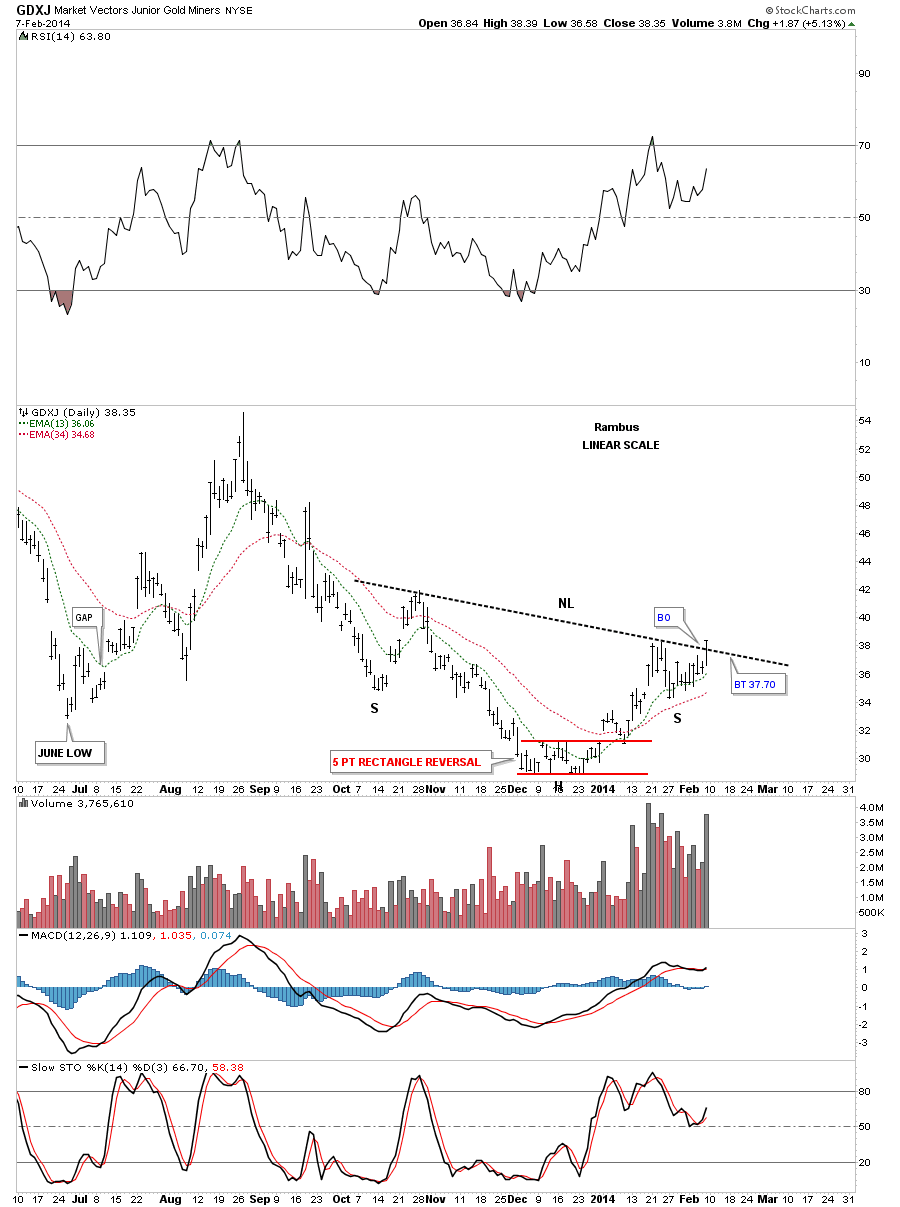
Below is a daily look at the GDXJ that should put a smile on your face. How many remember the red 5 point rectangle reversal pattern? As you can see its now the head portion of a nice inverse H&S bottom. Note the breakout of the neckline last Friday on really nice volume. This is what weve been waiting for.

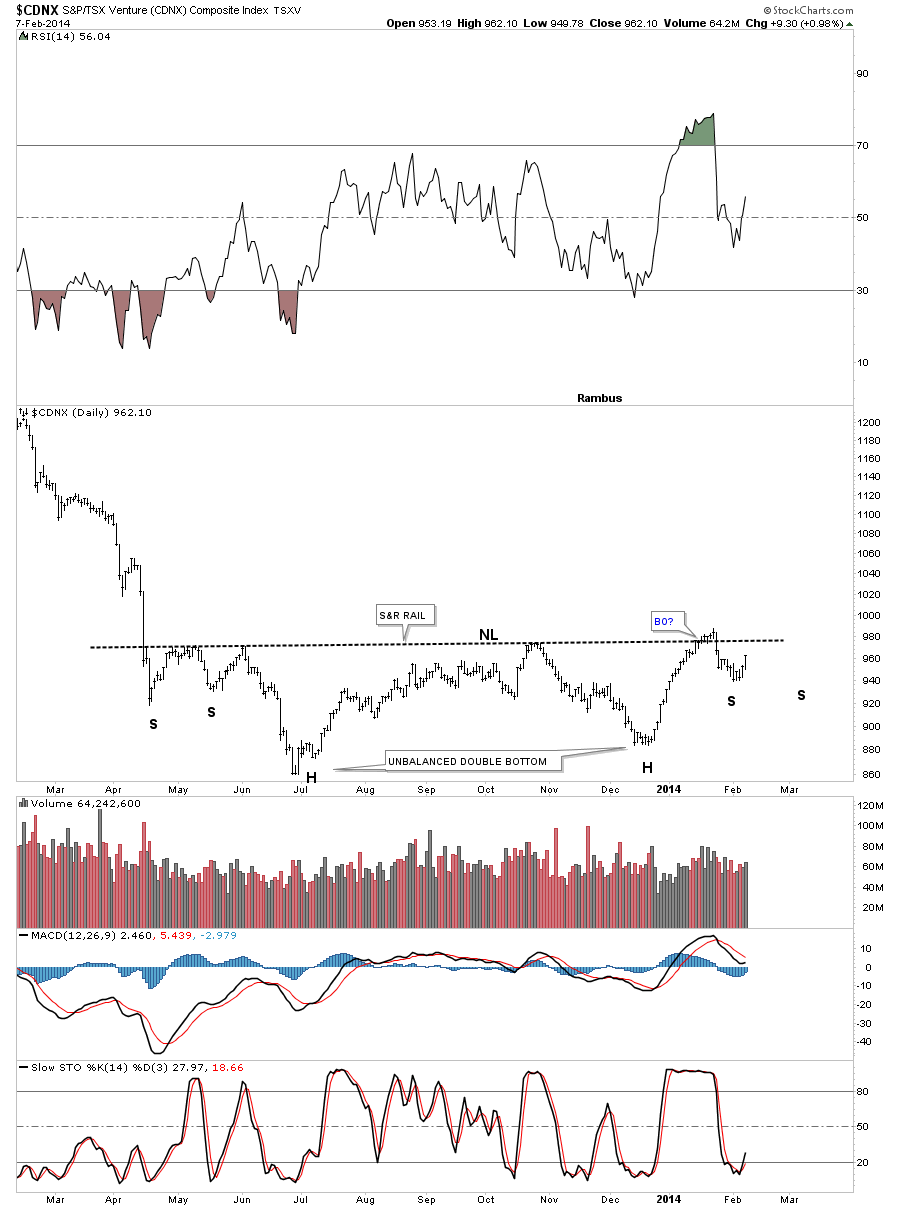
Before we move on there is one more small cap index that I showed you a while back that was busting a move higher as it was going vertical, at least on the minute charts. You can see the move up on the right side of the chart that went straight up to the neckline and then pulled back. Its now making another run toward the neckline. This could be a very large base being built here going all the way back to April of last year.

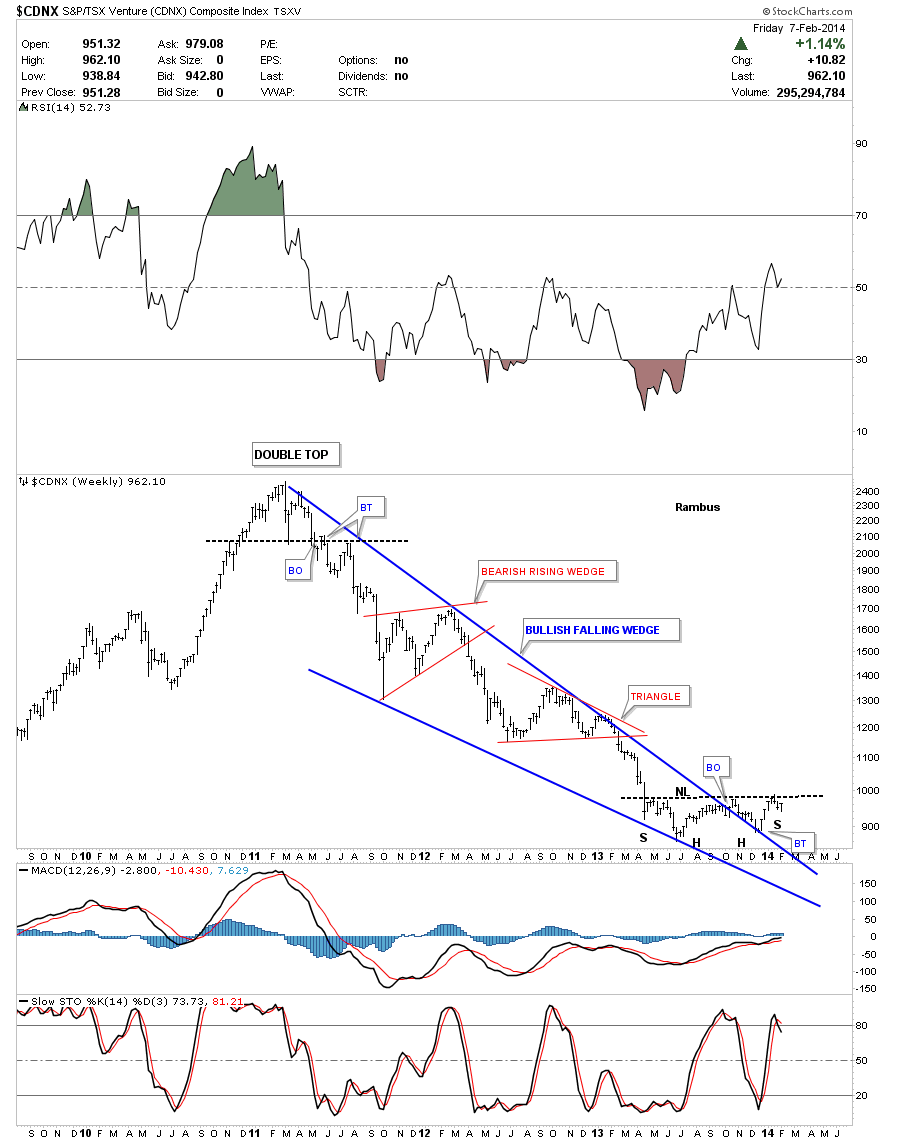
Lets put that possible H&S bottom into perspective by looking at the weekly chart. Here you can see the multi year blue falling wedge with the possible H&S bottom forming at the very bottom. As I have shown you in the past, many times the left shoulder and head will be inside the falling wedge and the right shoulder will form as the backtest to the top rail. Since this H&S bottom is made up of two heads it looks like the right head and right shoulder are forming as part of the backtest.

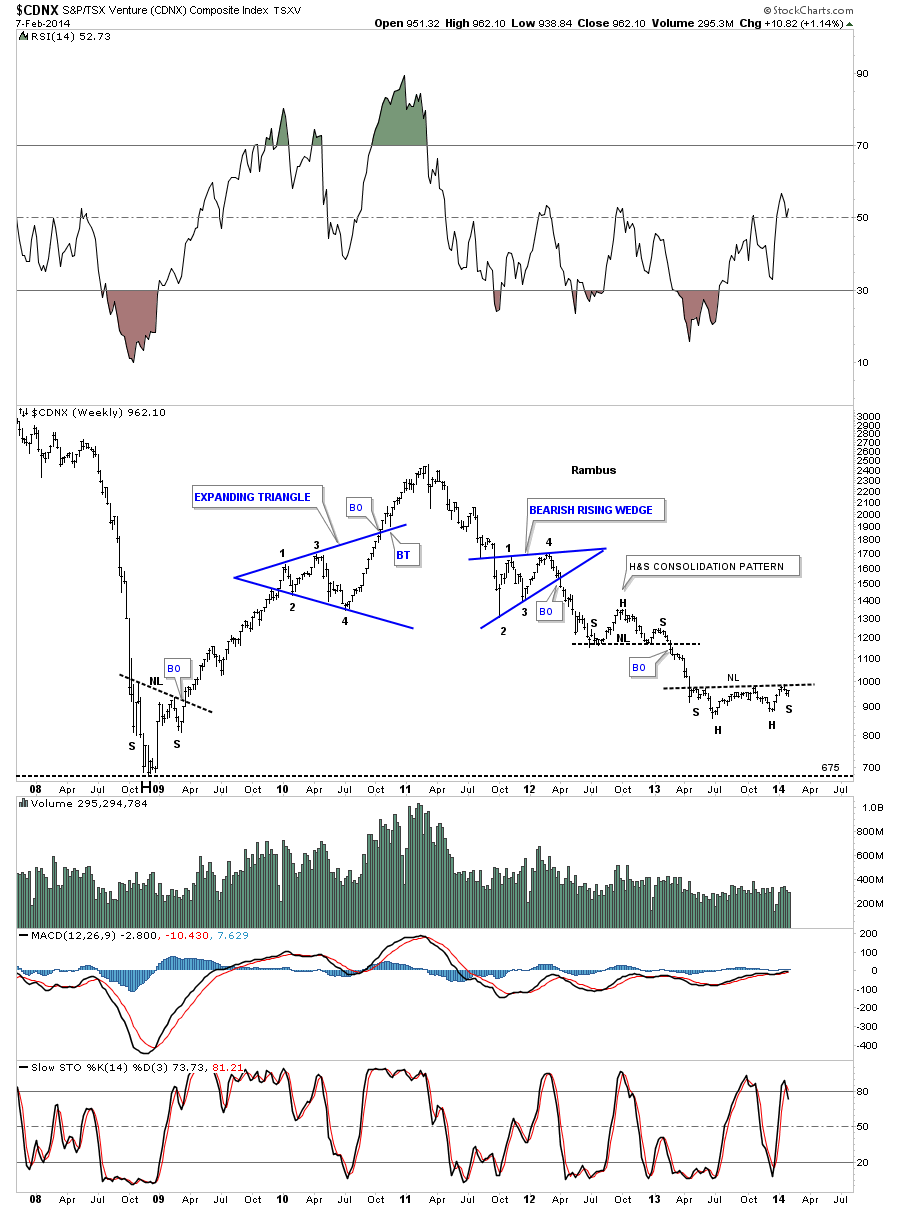
Below is another look at our possible H&S bottom. This chart I called my reverse symmetry chart as the price action was reversing symmetry down until our current and possible H&S bottom started to form. Folks this is what you want to see at the end of a long move down, a reversal pattern of some kind. Note the beautiful H&S bottom that formed after the 2008 crash.

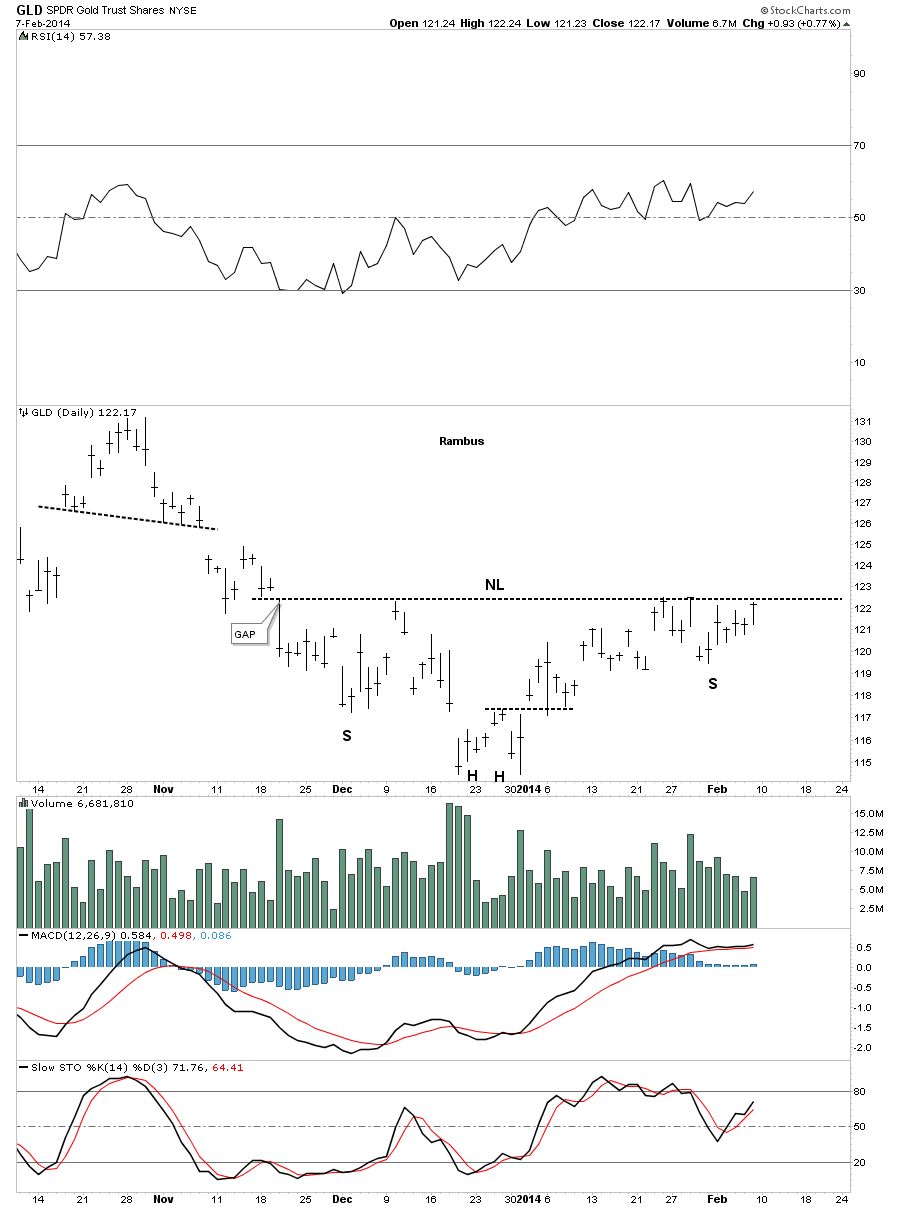
If the PM stocks look like they maybe heading higher lets take a close up look at gold and silver to see if we can see any clues that may help the cause. It sure looks like the GLD is building out an inverse H&S bottom with a horizontal neckline. Fridays price action closed just below the neckline so its very close but not quite there yet.

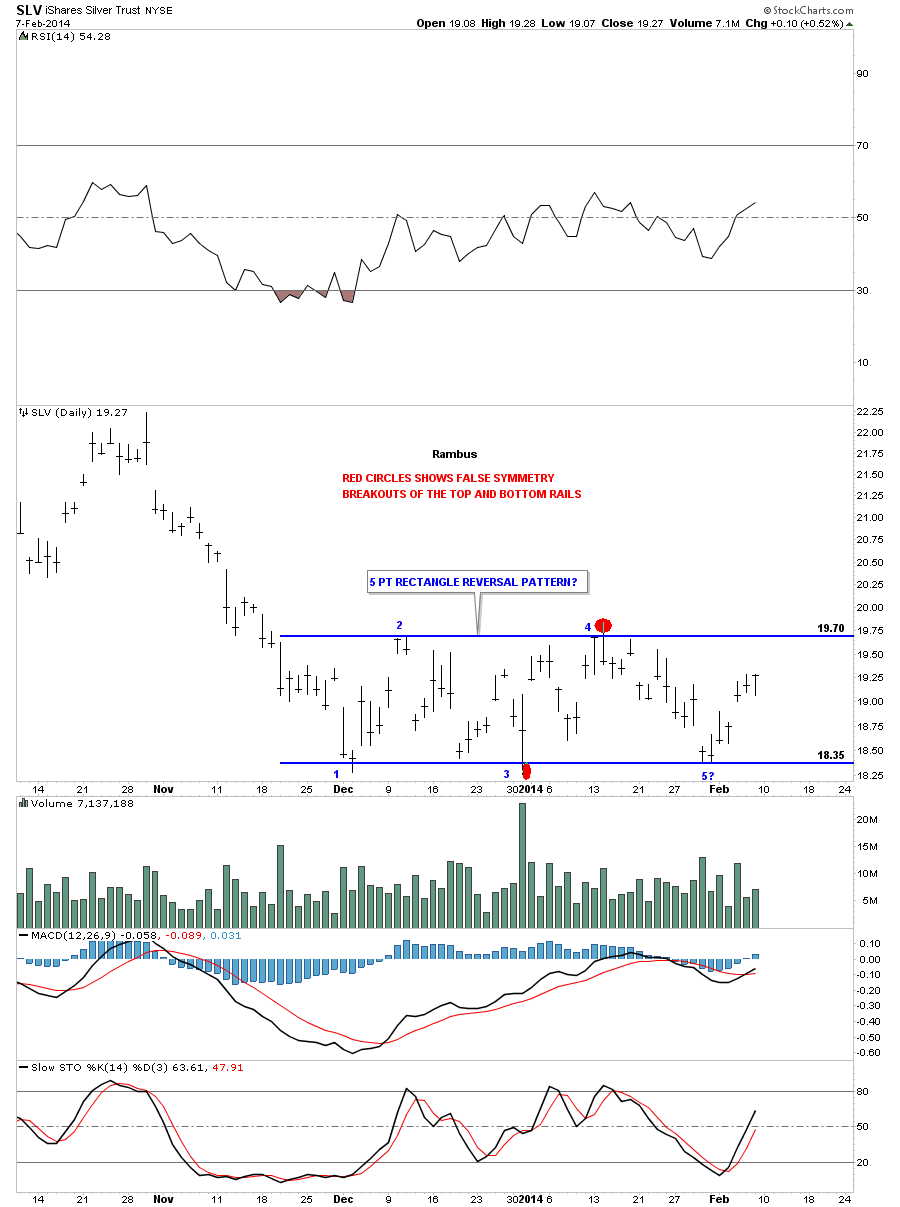
Lets look at one more chart that shows the SLV still trading inside its 2 month rectangle. What is interesting is that its working on the 5th reversal point right now. If the SLV can take out the top rail we will have reversal pattern in place that is reversing the downtrend. It still has some work to do but its getting there.

Ive been going over many of the junior mining companies and have narrowed the list down to about 30 or so. Our computer genius has been out of town this weekend but my plan is to start another portfolio, with $100,000, that will be strictly for the small caps, say under $5 a share. This will be a mostly buy and hold portfolio for up to a year or so. The rally phases in the early part of this bull market generally lasted a year from trough to peak. Even if audept doesnt get to setting up the new, Junior Precious Metals Stocks Portflolio, I will be posting some buys in the very near term. There are some very good looking stocks out there that are starting to get away from us. With these juniors the leverage goes down very quickly once they start to move.
This should get everyone up to speed on what Im seeing in the precious metals complex right now. Well take it one step at a time. As long as theyre moving in the right direction well go along for the ride. All the best
Rambus
http://rambus1.com/
| Digg This Article
-- Published: Monday, 10 February 2014 | E-Mail | Print | Source: GoldSeek.com


