-- Published: Friday, 14 March 2014 | Print | Disqus
By Steve St. Angelo, SRSrocco Report
As the U.S. economy continues to disintegrate, increasing numbers of investors will be forced to move out of paper assets and into physical gold and silver to protect their wealth. At first the move will be slow, but as Americans wake up from four decades of fiat monetary amnesia, it will turn into a torrent.
Unfortunately, there won't be much in the way of physical precious metals to "GET" at this time, as the clever Chinese and Easterners already cleared most of the shelves. However, Americans will still be shocked and stunned that they didn't see this big transfer of wealth coming..... and there is a good reason for that. Brain damage.
Well... let's just say, a collective brain damage. Now, I don't mean everyone and we really can't blame the majority of the public because as they are extremely gullible. Gullible to the extent that when news or a breaking story is on the BOOB TUBE, well then it must be true.
Which means, if the MSM actually did its job of finding and reporting the truth, rather than reading the Elite and Corporate controlled feed on the teleprompter, then we would probably be much better off today.
But of course, this isn't the case. As economic indicators go from bad to worse, Americans for some strange reason believe (or hope) things are finally turning around for the better. However, if we look at the real data, things are heading right back over the cliff.
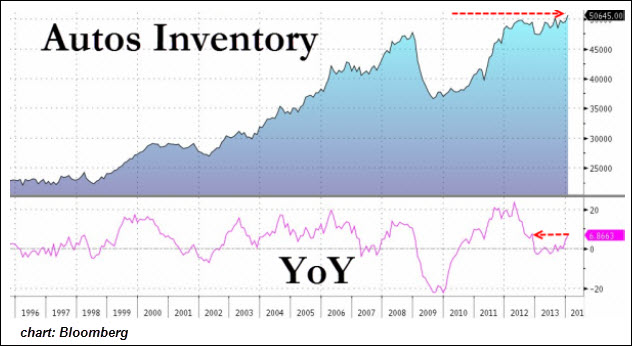
According to ZeroHedge, Wholesale Sales Collapse Most In 5 Years As Auto Lead Inventories Surge:
Sales is the largest in 5 years and aside from the financial crisis is the worst since 1993! This is also the biggest miss on record. Inventories rose more than expected (+0.6% vs +0.4% expectations) which could be a problem as the inventories/sales ratio surges to its highest in 11 months. Unsurprisingly, Autos saw the largest inventory build (+6.8% YoY).

Furthermore, the most comatose areas of the retail sector are hemorrhaging first, making way for the full body blow to come later. Here are a few of the retail casualties from Michael Snyder's article, "20 Facts About The Great Retail Apocalypse":
#1 As you read this article, approximately a billion square feet of retail space is sitting vacant in the United States.
#2 Last week, Radio Shack announced that it was going to close more than a thousand stores.
#3 Last week, Staples announced that it was going to close 225 stores.
#4 Same-store sales at Office Depot have declined for 13 quarters in a row.
#7 Sears has closed about 300 stores since 2010, and CNN is reporting that Sears is "expected to shutter another 500 Sears and Kmart locations soon".
Some members on Snyder's site commented that he was just focusing on the worst stores and that they were not a good indicator of the retail sector. While that may be true, I see things getting bad enough that we will eventually see McDonalds, Burger King, Wendys, Olive Garden, Starbucks, Best Buy, Target, Wal-Mart and etc. closing stores.
It's coming, unfortunately the majority of investors and public don't realize it yet.
You see, the collapse of the U.S. and global economy has more to do with energy than all the theft, manipulation and fraud taking place in the financial system.... even though there's a hell of a lot of it.
Why is this so? Try to shove a stack of $10 bills in your gas tank and see how far you get. Or how about a farmer trying to run his tractor on an interest rate swap. Lastly, a manufacturing plant needs electricity to run its operations, not a futures contract.
U.S. Natural Gas Storage Levels Down 50% Compared To Last Year
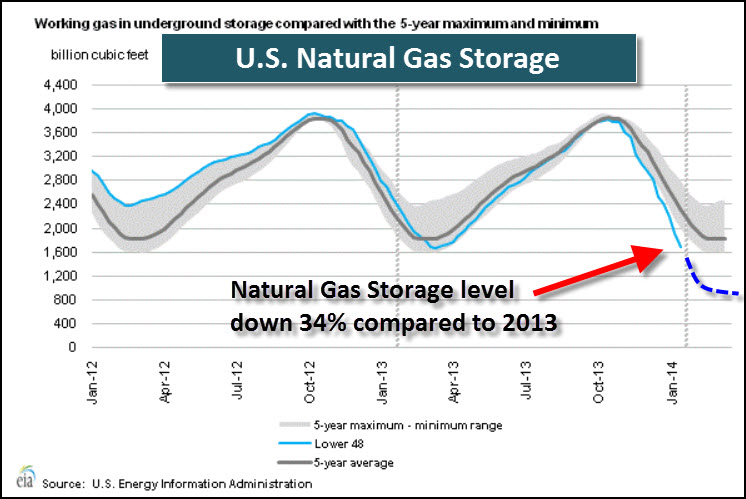
Last month I posted the graph below from the EIA - U.S. Energy Information Agency. At the time, the U.S. was down 34% in underground gas storage:

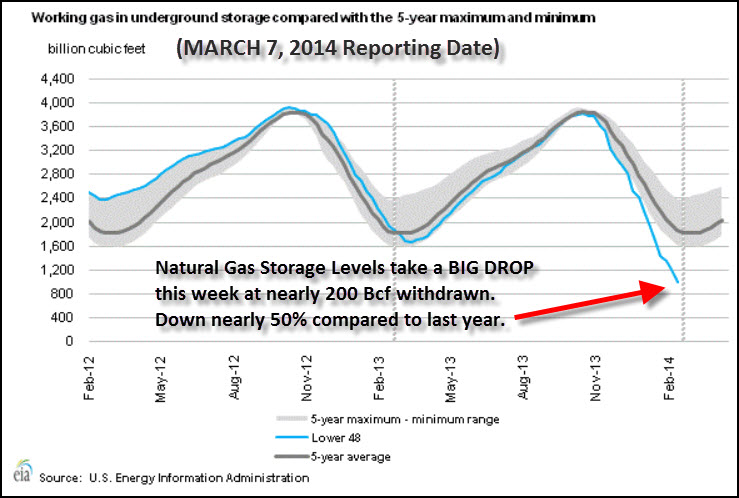
I forecasted that the drop would be between 800-1,000 Bcf. The EIA stated that it would fall to 965 Bcf by the end March.. Today, the EIA released their natural gas storage report... and we had another whopper of a draw-down.
For the week ending March 7th, U.S. natural gas storage levels fell nearly 200 Bcf to 1,001 Bcf (Bcf - billion cubic feet).

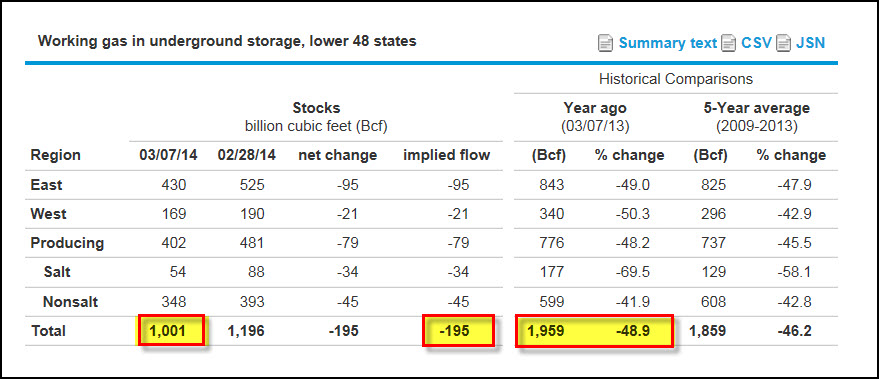
As we can see from the table below current gas storage levels are down 49% compared to last year.. and we still have 3-4 weeks remaining for continued withdrawals:

So, it is quite possible that we will hit a low of 800 Bcf by the end of March (lower than the 965 Bcf forecasted by the EIA) before the industry starts rebuilding the storage levels in April.
The EIA is optimistic that record natural gas production in 2014 will build the storage levels up 2,500 Bcf by the end of October -- the end of the injection season.
What happens if storage levels fall to 800-850 Bcf, and we are only able to add 2,000-2,200 Bcf of gas by the end of October? That would be 20% less compared to the 3,925 Bcf level reached in October 2013.
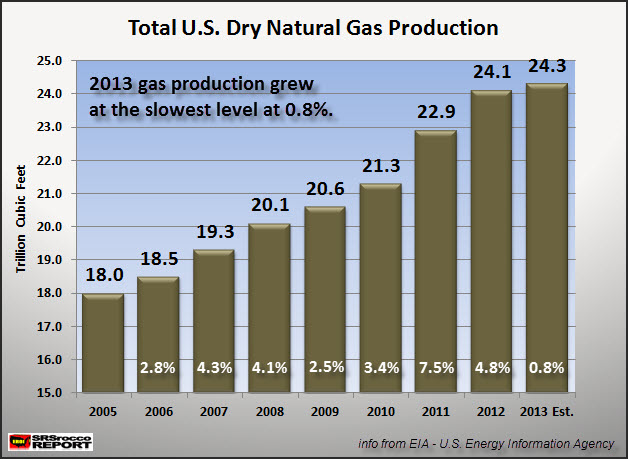
This is quite possible if we look at the following graph. This is one of the graphs included in my upcoming THE U.S. & GLOBAL COLLAPSE REPORT.

You will notice that U.S. natural gas production grew over 2.5% each year with record increases of 7.5% in 2011 and 4.8% in 2012. However, in 2013 total U.S. natural gas production increased a paltry 0.8% compared to 2012. This was the lowest annual increase going back to 2005.
How could this happen? Isn't the U.S. planning on building LNG terminals to ship all our surplus gas overseas? How on earth do we plan on exporting natural gas if we are still a NET IMPORTER? That's correct.. we still import natural gas from Canada to fill our shortfall.
The U.S. will never become energy independent or a net exporter of natural gas. Furthermore, I believe we will see PEAK NATURAL GAS PRODUCTION in the U.S. much sooner than later.
I will explain this in detail in THE U.S. & GLOBAL COLLAPSE REPORT.
Physical Precious Metals Availability To Dry Up As The U.S. Economy Disintegrates
It's no secret to the precious metal community that the Chinese and East are rapidly devouring all the physical gold they can get their hands on. According to Koos Jansen's InGoldWeTrust, the Chinese imported a record 418 metric tons of gold in the first two months of the year.
The Chinese as well as many other countries in the East realize that the U.S. Dollar's days are numbered, so it's wise to acquire as much gold as possible. In doing so, it puts severe pressure on the paper gold market. Because, the more physical gold that heads East, the higher degree of leverage comes into the paper market.
At some point the PAPER GOLD MARKET will crack and the public will get a rude awakening. This will probably be the time U.S. citizens experience seriously high rates of inflation.
Americans trying to buy gold or silver at this time will find out there is very little to acquire only at much higher prices. Currently, the U.S. Mint Authorized Dealers continue to purchase every allocated Silver Eagle.
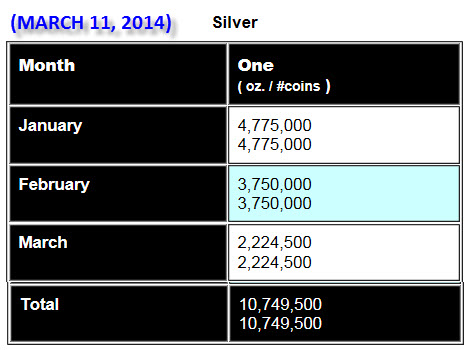
In just the first two days of this week, the U.S. Mint sold 1,124,500 Silver Eagles:

Last week, the U.S. mint sold 1.1 million Silver Eagles.. the total allotment for the week. This week, the U.S. Mint increased its allocated amount to 1.2 million and sold 94% (1,124,500), in the first two days.
Chances are the authorized dealers will purchase the remaining 75,700 Silver Eagles by week's end. If the U.S. Mint continues to allocate at least 1 million Silver Eagles each week for March, it will be another record for the month at over 4 million sold.
Here are the Silver Eagle March sales figures for the past 3 years:
2011 = 2,767,000
2012 = 2,542,000
2013 = 3,356,500
Again, if the present sales trend continues, 2014 March sales will surpass 2014 by nearly 1 million ounces.
Furthermore, first quarter Silver Eagle sales are on track to reach 12.8-13 million. At this rate, 2014 could be another record year at 45-48 million Silver Eagles sold.
If the Silver Eagle allotment is selling out each week (since the beginning of the year), what happens if the American public wakes up and wants to purchase Silver? How would that huge demand impact price?
Currently, Americans are invested in the largest Paper Ponzi Scheme in history. They hope and pray that the DIGITS in their accounts will be good as gold when they retire. Unfortunately for them, the only thing that is good as gold..... IS GOLD (or silver).
Please check back at the SRSrocco Report for updates and you can also follow us at Twitter at the link below:

| Digg This Article
-- Published: Friday, 14 March 2014 | E-Mail | Print | Source: GoldSeek.com


