-- Published: Tuesday, 22 July 2014 | Print | Disqus
By Steve St. Angelo, SRSrocco Report
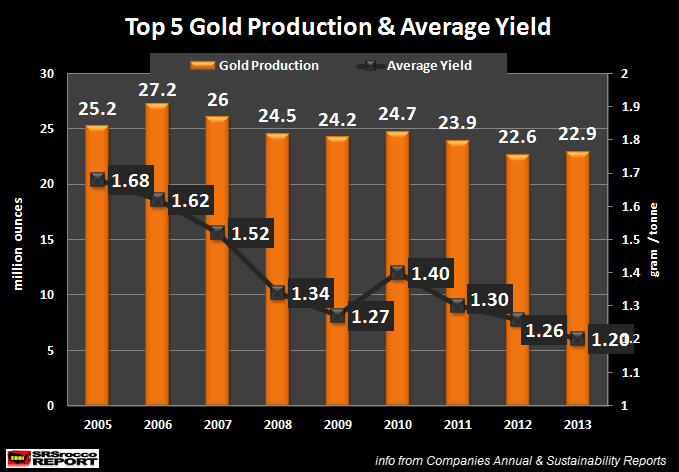
With the results for 2013 finally in, the top gold miners average yield fell to the lowest level ever. This is a surprising development considering that the average price of gold dropped to a low of $1,411 in 2013. Normally when the price of gold falls, gold miners switch to higher grades to remain profitable.
However, the top five gold miners' average yield declined another 5% in 2013. If we look at the chart below, the top five gold miners (Barrick, Newmont, AngloGold, Goldfields* & Goldcorp) average yield fell from 1.26 grams per ton (g/t) in 2012 to 1.20 g/t in 2013.
(*Note: GoldFields spun-off three mines into a new company called Sibanye Gold in 2012. The data below includes both companies listed as GoldFields.)

Furthermore, the average gold yield for the group declined from 1.68 g/t in 2005 to 1.20 g/t in 2013. Which means these miners lost 0.48 g/t in just eight years... a 29% decline. That might not sound like a lot, but if we do the math... it's a substantial loss.
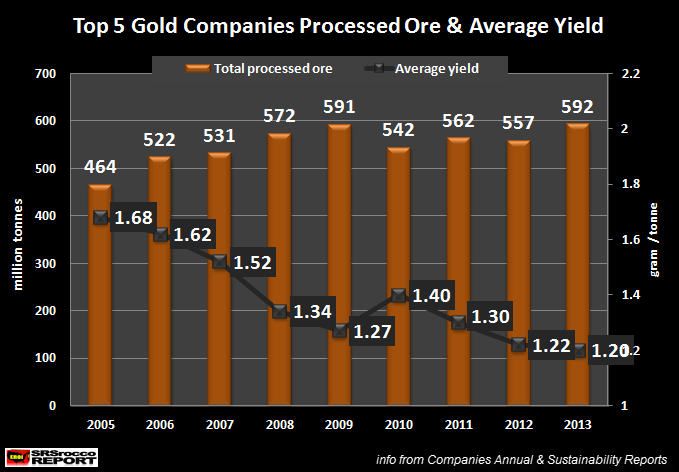
The next chart provides the astonishing blow to the gold mining industry. In 2005, the group processed 464 million metric tons of ore to produce 25.2 million ounces of gold at an average yield of 1.68 g/t. In 2013, this same group processed 592 metric tons of ore (27% more), to produce 22.9 million ounces of gold.

This is the negative side of the gold mining industry. Moreover, the amount of waste rock removed is even greater. For example, Newmont reported the following data in their 2007 & 2013 Sustainability Reports;
Newmont Statistics
2005 Gold Production = 8.2 million oz
2005 Total Waste Rock = 425 million tonnes
2005 Waste Rock/Production Ratio = 52 metric tons/ gold oz
2013 Gold Production = 5.5 million oz
2013 Total Waste Rock = 620 million tonnes
2013 Waste Rock/Production Ratio = 113 metric tons/ gold oz
Newmont doubled the amount of waste rock generated to produce an ounce of gold in 2013 than it did in 2005. This wasn't a straight increase over the eight year time-span. However the waste rock/ production ratio was 86 metric tons per ounce of gold in 2012... 65% higher than 2005.
The more waste rock Newmont has to remove, the more energy is consumed in the process. In 2005, Newmont consumed 19 gallons of diesel in its operations to produce one ounce of gold. By 2012, this increased to a staggering 31 gallons per ounce.... a 63% increase in seven years.
As we can see, falling ore grades become a very expensive factor for the mining industry.
Not all the top five gold miners suffered a decline in average yields in 2013. Barrick, Newmont and AngloGold saw a drop in average yields in 2013, while GoldFields (include Sibanye Gold) and GoldCorp reported a slight increase.
The company who suffered the largest decline in yield was AngloGold:

AngloGold's average yield fell 15% in 2013 compared to 2012, while Newmont declined 10% and Barrick at 6%. Even though these declines seem quite large, I imagine we may actually see a leveling off or increase in yields from these companies in 2014.
Unfortunately, high-grading their mines to remain profitable at lower prices is only a temporary solution. Worse yet, the link provides information on how this method can leave a great deal of gold in the ground due to selecting the high-grade ore while leaving low-grade ore uneconomical to extract.
So, if these top gold miners decide to high-grade their mines, we may see a leveling (or slightly rising) of yields in 2014. However, this may actually speed up the decline rates in yields further down the road.
I am waiting for data to be released by two companies so I can update my chart on the average diesel consumption per ounce from the top five gold miners. With the majority of results already in... I can honestly say, diesel consumption per ounce in 2013 will hit a new record high.
As ore grades continue to decline, the cost to produce gold will inevitably rise. Some readers believe the higher energy price will be the factor to push the value of gold to new highs. Actually, I don't believe this will be the case.
The world cannot afford high oil prices. We may experience temporary OIL PRICE SPIKES, but I doubt the price of a barrel of Brent crude will continue to rise towards $200.
The price of gold and silver will rise to extreme levels in the future not on the back of higher oil prices, but rather due to a falling oil supply and its impact on the $100+ trillion of worthless paper-mache floating around the world's markets.
Please check back for new articles and updates at the SRSrocco Report. You can also follow us at Twitter below:

| Digg This Article
-- Published: Tuesday, 22 July 2014 | E-Mail | Print | Source: GoldSeek.com


