-- Published: Wednesday, 17 September 2014 | Print | Disqus
The U.S. financial position continues to deteriorate badly and in the last 12 months has increased by over $1 trillion dollars.

Nick Laird of Sharelynx has just reproduced his fascinating and timely chart showing the US debt limit, the actual US debt and the gold price all in one chart. From 2000 until around the first quarter of 2013, there was a very strong and close correlation between the growth of the US national debt and the rise in the US dollar gold price.
After Q1 2013 this correlation broke down according to the chart, wherein the US national debt continued to skyrocket and the US dollar gold price fell significantly. The end of Q1 2013 coincides with the smash down of the gold price in April 2013, which actually created a huge increase in demand for physical gold all across the world.
Looking at the huge divergence in the graph after mid 2013 between the continued growth in the US national debt and the drop and subsequent tight trading range for gold between $1200 and $1400, one can only conclude that gold is somehow being prevented from its previous job of accurately reflecting an explosive US national debt picture.

Source: Brillig.com
An update on the future trend of US monetary policy is in the offing today as the US Federal Reserve’s latest two day Federal Open Market Committee (FOMC) meeting concludes in Washington DC.
As usual, global financial markets will scrutinise the Committee’s press conference statement for any shift in Fed thinking on when the US central bank will begin to raise short term interest rates.
With the Fed’s QE3 asset purchase scheme coming to an end, markets are speculating on whether the Fed will, at this time, alter its recent interest rate guidance language that states that its federal funds rate would be maintained as is for a ‘considerable time’. Any tweaking of this phraseology will create more price volatility in the US dollar and so would also create volatility in bond, stock and commodity markets, including precious metals markets.
Markets are expecting some comment on the existing guidance but are also concerned that changing the guidance at this time may complicate the parallel track of winding down the QE program.
The voting members of the FOMC comprise the Fed’s five board of governors, the president of the NY Fed, and presidents of four other Fed Reserve banks who are selected on a rotating basis from the panel of the eleven other regional Fed banks. Although there are technically seven seats on the Fed board of governors, only five board seats are currently occupied.
This means that there are currently ten voting members on the FOMC - Yellen, Brainard, Fischer, Powell and Tarullo from the board of governors, Bill Dudley from the New York Fed, and Plosser (Philadelphia), Mester (Cleveland), Fisher (Dallas) and Kocherlakota (Minneapolis) representing the regional Fed banks.
As regards interest rate aggressiveness, Plosser, Mester and Fisher are considered the more hawkish by Wall Street watchers.

The ‘considerable time’ guidance that is currently subjecting the financial markets to pained deliberations was communicated to the financial markets in an FOMC press release on July 30, when the FOMC, in a 9-1 majority decision voted to release a statement that where they thought it “likely will be appropriate to maintain the current target range for the federal funds rate for a considerable time after the asset purchase program ends, especially if projected inflation continues to run below the Committee's 2 percent longer-run goal, and provided that longer-term inflation expectations remain well anchored.”
The one dissenting vote in July came from Plosser of the Philadelphia Fed who thought that the ‘considerable time’ language was “time dependent and does not reflect the considerable economic progress that has been made toward the Committee's goals.”
Yesterday Jon Hilsenrath, the Wall Street Journal’s chief economics correspondent, weighed in on the ‘considerable time’ speculations. Hilsenrath is perceived as being very close to the Federal Reserve powerbrokers in terms of access and information flow, so his opinion is taken seriously.
Hilsenrath said yesterday that he thinks that the FOMC will probably ‘qualify’ their ‘considerable time’ phrase in some shape or form, but that since the Fed wants to communicate additional information on the timeframe of the QE bond buying operations, that the Committee may think it’s too complicated for the financial markets to process all of this information at one time.
Given that the global financial markets are some of the most sophisticated processors of information in the world, Hilsenrath’s official view looks a little naïve. Since Hilsenrath is not naïve and appears to regularly know what the FOMC is thinking, this suggests that the Fed is most likely stalling for time in raising interest rates since it believes that the US economy is really weaker than it wants to admit.

The US national debt continues to spiral out of control, seemingly without any plan to ever reign it in.
Compared to this time last year, the national debt has grown by over $1 trillion. At the end of September 2013, the cumulative debt stood at $16.74 trillion. Now it is over $17.76 trillion.
Astoundingly, more than $7 trillion of additional US national debt will have been accumulated over the 8 year duration of Obama’s two presidencies, which is more than the accumulated US national debt of all previous US presidencies combined.
This is not to mention the more than $200 trillion of US government unfunded liabilities such as pensions.
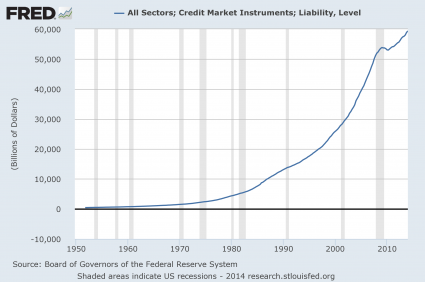
When the total US government debt of over $17.76 trillion is added to all U.S. business and personal debt, it approaches an astronomical $60 trillion. This is more than 25 times the total outstanding debt that existed when the U.S. severed the link to the gold standard in August 1971.
Since that time the Federal Reserve has encouraged and facilitated this huge growth of outstanding debt and in various crises, when it would have been more prudent to deflate asset bubbles, the Fed has continually supported these bubbles while encouraging new ones.

The primary focus on the wording from the FOMC smells of an element of rearranging the chairs on the Titanic. Fiscal lunacy is alive and well in Washington with ramifications for the dollar and for investors and savers globally.
Download GoldCore Insight: Currency Wars: Bye, Bye Petrodollar - Buy, Buy Gold
MARKET UPDATE
Today’s AM fix was USD 1,236.50, EUR 954.22 and GBP 758.71 per ounce.
Yesterday’s AM fix was USD 1,238.75, EUR 956.93 and GBP 765.70 per ounce.
Gold climbed $1.60 or 0.13% to $1,235.50 per ounce and silver rose $0.03 or 0.16% to $18.71 per ounce yesterday.
In early lunchtime trading in London, gold traded at $1237.75, up 0.23% from yesterday’s New York close. Yesterday in New York trading, gold traded in a $1240 to $1230 range, and recovered in Asian trading earlier today.
In the London morning, platinum traded at $1,366 today, down 0.22% while palladium rose 0.6% from yesterday to $844.
Precious metals recovered for their third consecutive day in European trading this morning, having closed higher each day before the Fed releases its policy statement at 1800 GMT.
Any increase in interest rates will tarnish gold bullion’s safe haven appeal in the short term. Bearish sentiment in the markets were also reflected by outflows in SPDR gold trust which dropped 4.18 tonnes to 784.22 tonnes on Tuesday.
Gold ended a 12 year rally in 2013 as the Fed planned to decrease their monthly asset purchases.
Policy makers have said since March that rates would stay low for a period after it completes the bond-buying program. The yellow metal is on target for its first quarterly drop this year, while the U.S. dollar has reached a 14 month high versus 10 major currencies this week.
"By Ronan Manly, Edited by Mark O'Byrne"
| Digg This Article
-- Published: Wednesday, 17 September 2014 | E-Mail | Print | Source: GoldSeek.com

