-- Published: Tuesday, 23 September 2014 | Print | Disqus
Despite the recent bout of price weakness, gold American eagle coin sales from the U.S. Mint have picked up significantly from last month.
The latest bullion coin sales figures from the U.S. Mint show a tentative pickup and robust retail bullion demand, with September sales stronger for both the American Eagle and American Buffalo gold coins as well as for the American Eagle silver 1oz coins.

U.S. Mint Gold Buffalo Bullion Coin (1 oz)
Month-to-date for September, gold Eagle sales across all coin sizes have already reached 43,200 oz compared to total gold Eagle sales of 25,000 oz in August. This is also well ahead of September 2013, when total gold Eagle sales for the month only touched 13,000 oz.
Year-to-date American Eagle sales have now reached 364,200 oz.
Gold American Buffalo 1 oz sales so far this month have reached 10,500 oz, up from 8,000 oz in August, and 5,500 oz in July. With a strong first quarter, year-to-date American Buffalo sales are now running at a cumulative 135,500 oz for 2014.
Taken together, U.S. Mint gold Eagle and Buffalo sales for 2014 have now reached 500,000 troy oz, or 15.5 tonnes.
While this gold total falls short of the 1.1 million ozs of gold coins sold by the US Mint in 2013, if Q4 of 2014 continues the trend seen in Q3, then total gold sales by the Mint could reach just shy of 700,000 oz for all of 2014, which demonstrates an element of resilience in the face of the ongoing gold price weakness.
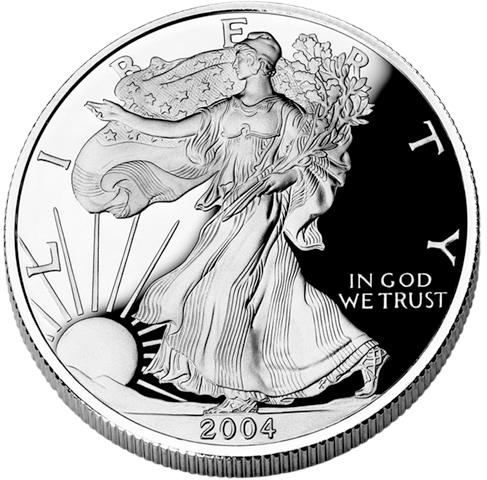
U.S. Mint Silver Eagle (1 oz)
Silver American Eagle 1 oz sales are also stronger for the month-to-date, at 2.42 million ozs compared to 2.0075 million ozs for the full month of August.
While these monthly totals are weaker than the monthly sales in August and September 2013, which came in at 3.625 million ozs and 3.103 million ozs respectively, the year-to-date silver total for 2014 is running at a relatively strong 30.53 million ozs, and if the trend continues, silver sales may finish 2014 in the region of 40 million ozs which compares well with the 2013 silver sales total of 42.675 million ozs. This is because although 2013 silver sales has a very strong start compared to 2014, this year has seen relatively strong sales across most months.
The U.S. Mint is unusual in that its gold and bullion coin sales figures are updated very frequently and, as far as possible, the figures include sales activity in the most recent week or previous week.
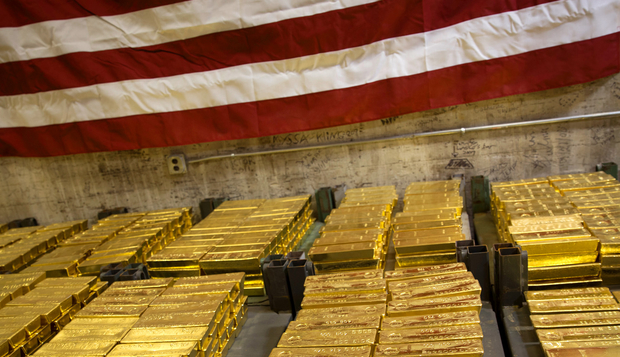
Working stock of gold bars in the United States Mint Facility in West Point, New York - Bloomberg
Other government mints such as the Royal Canadian Mint and the Royal Mint in Britain do not have such real time bullion sales reporting. Publically available bullion coin sales data from these institutions has to be sourced from their quarterly, half yearly and annual report updates.
However, in Australia, the Perth Mint does release monthly data on gold and silver coin and bar sales with a one month lag. Data for August shows gold sales stronger at 36,369 ozs compared to 25,103 ozs in July, with silver sales also up strongly at 818,856 ozs compared to 577,988 ozs in July.
Overall, the U.S. Mint bullion sales figures, due to their real-time nature, are used extensively in the industry as a proxy for retail gold and silver investor sentiment, and are even included in a number of well known bullion bank commodity and precious metals research reports.
While extrapolating the U.S. Mint figures to other Mint bullion sales requires caution, the sales trends of the U.S. Mint tend to be confirmed when quarterly data from the Mint's main competitors is put into the public domain.
MARKET UPDATE
Todays AM fix was USD 1,225.00, EUR 951.01 and GBP 748.09 per ounce.
Yesterdays AM fix was USD 1,214.00, EUR 944.75 and GBP 743.51 per ounce.
Gold fell $2.30 or 0.19% to $1,215.30 per ounce and silver slipped $0.09 or 0.5% to $17.81 per ounce yesterday.
Spot gold in Singapore was 1,215.56 per ounce and Asian stocks finished mixed on Tuesday following the release Chinese factory data (PMI). Trading was quiet as Japan was closed for a holiday but in London, gold rallied from an eight-month low as investors digested the news of air-strikes in Syria.
Silver gained from the lowest price in four years.
The U.S. and its Arab allies launched a strategic air strikes against Islamic State positions in Syria. Heightened geopolitical risk was highlighted when Israel shot down a Syrian fighter jet.
The U.S. dollar's recent bullish run has added to the pressure on commodity prices. As has concerns about the debt laden, global economy. Market sentiment that the U.S. Federal Reserve would increase interest rates sooner than expected is also hurting the gold price.
COMEX gold and silver contracts are the most active they have been in months.
Gold will be driven by demand from China and India, which seasonally ramps up from September ahead of festive periods and the wedding season. Golds recent price decline kept its 14 day relative strength index (RSI) under 30 for 8 days, which to technical chartists would signal as a possible rebound.
By Ronan Manly, edited by Mark OByrne
Sign Up For Breaking News And Research here
| Digg This Article
-- Published: Tuesday, 23 September 2014 | E-Mail | Print | Source: GoldSeek.com


