-- Published: Friday, 3 October 2014 | Print | Disqus
The current U.S. bond market faces a "liquidity cliff" and looks like an asset "bubble" that could burst when interest rates start to rise, according to the senior U.S. securities regulator. This is something we have been warning of in recent months.
The consequences of the bursting of the bond bubble would be rising interest rates, which would likely impact property and stock markets and benefit safe haven gold bullion.

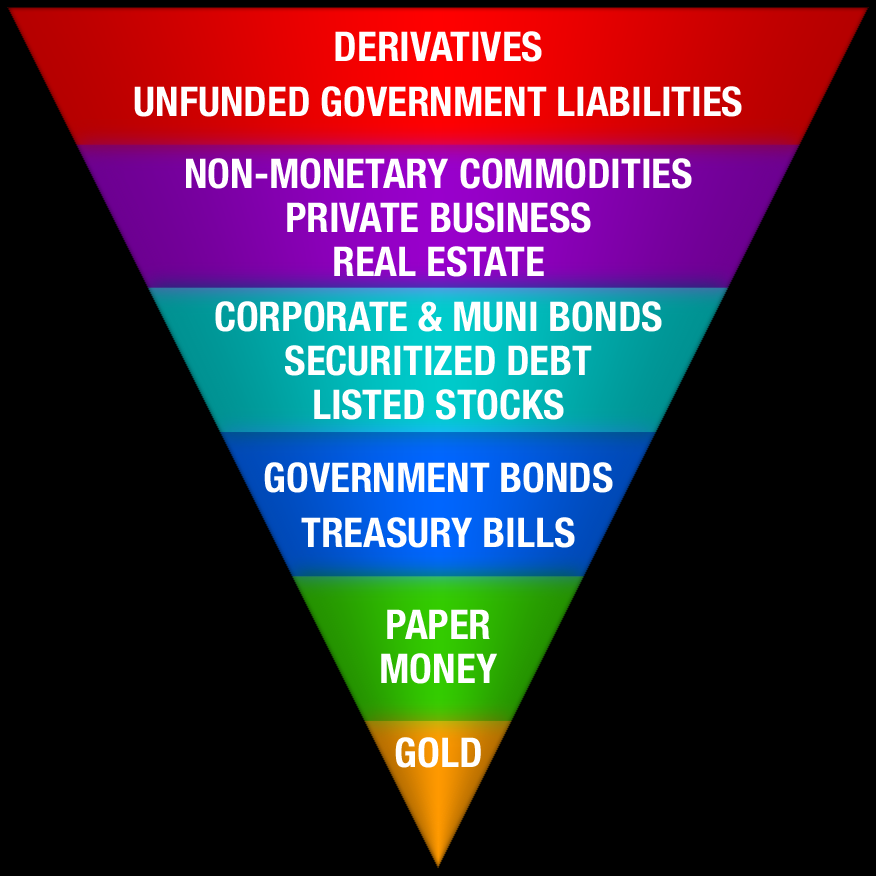
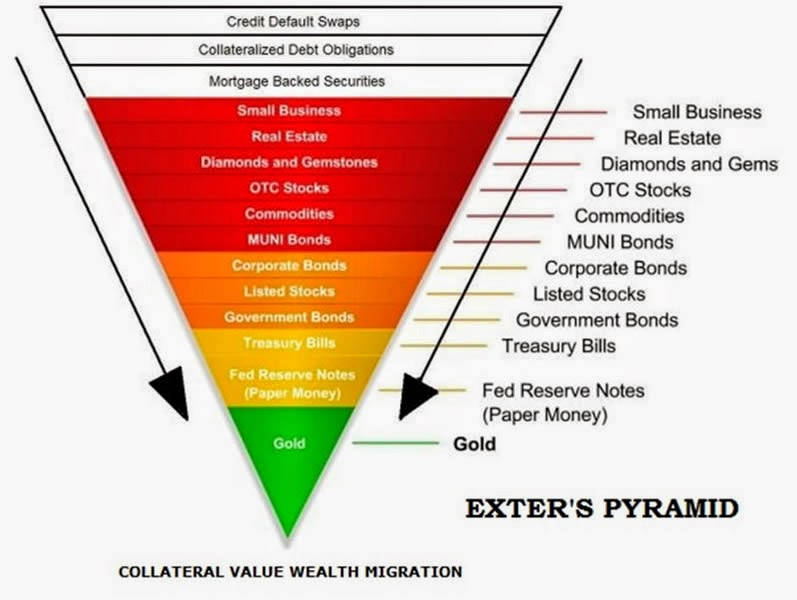
Exter's Golden Pyramid
Securities and Exchange Commission (SEC) Republican member Daniel Gallagher said over a year ago that the $3.7 trillion municipal bond market may suffer"Armageddon" once interest rates climb.
The Fed has continued ultra loose monetary policies and debt monetisation for more than six years now. It has kept its benchmark interest rate near zero since December 2008. The Fed already employed three quantitative easing rounds buying up bonds to help stimulate the U.S. economy after the financial crisis.
The Fed maintains that the program will end this month and many investors expect the Fed to move to a tighter monetary policy. However, we believe that if the Fed increases rates, it would likely lead to a sharp recession and possibly a Depression. It would also likely lead to serious volatility in markets and the risk of a triple stock, bond and property crash.
There has been jitters in bond markets in recent days. PIMCO saw $448 million in fund outflows last Friday. Bill Gross’s departure from PIMCO to join Janus Capital Group is being blamed for some of the jitters but it may be that investors internationally are concerned about over valuation in bond markets and heading for the exits - before the stampede begins.
Given concerns about the crisis on global bond markets and indeed the wider financial system, it is worth remembering one of the greatest central bankers of the modern era, John Exter and his insightful ‘golden pyramid’ (see above and below).

John Exter is known for creating Exter's Pyramid, also known as Exter's Golden Pyramid and Exter's Inverted Pyramid.
John Exter (September 17, 1910 – February 28, 2006) was a highly respected American economist, member of the Board of Governors of the United States Federal Reserve System, and founder of the Central Bank of Sri Lanka.
His golden pyramid allowed for the visualisation and the organisation of assets and asset classes in terms of risk and size. Exter rightly believed that gold is the safest asset and therefore gold forms the small base as the most reliable value and the asset classes on progressively higher levels are more risky.
The larger size of asset classes at higher levels is representative of the higher total worldwide notional value of those assets. While Exter's original pyramid placed Third World debt at the top, today derivatives hold this dubious honor.
Exter was highly respected for his great intellect and he also had all the mainstream credentials. He was Harvard educated, a Federal Reserve economist, a member of the Council of Foreign Relations and quite unusually among mainstream insiders, Exter believed in gold as money and a store of value.
He was a friend of the great Austrian economist, Ludwig von Mises. and debated the inflation versus deflation argument all the time with von Mises.
Given the huge levels of government debt throughout the developing and developed world, global bond markets today are multiple times bigger than they were in the 1970s when Exter created his pyramid.
In the event of another global financial crisis which we see as quite likely, capital will again flow from the riskier assets at the higher levels of the pyramid into the base of safe haven gold. While bonds were the beneficiary of the last financial crisis, they may be the nexus of the next financial crisis.
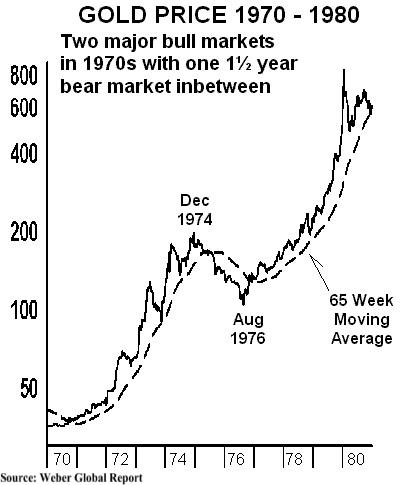
The stock of assets in the world today is multiple times bigger than it was in the 1970s and thus, gold appears very undervalued. Should we see capital flight from U.S. and global bond markets, gold should see gains on a par with those seen in the second half of bull market in the 1970s.

Many said that gold’s bubble had burst when it fell from $200 to $100 per ounce from December 1974 to August 1976.
“Experts” warned that gold would fall as interest rates rose. The opposite happened and as interest rates rose, gold rose more than 8 times in 3 years and 4 months, to $850 in January 1980.
History does not repeat but frequently rhymes.
GOLD IN Q4 - CNBC SURVEY
Does the prospect of a sustained campaign against ISIS in the Middle East, possibly lasting years, boost the safe-haven case for gold?
We believe it is likely to boost gold's safe haven credentials and may lead to increased demand both in the Middle East itself and globally.
This is particularly the case if the bombing campaign leads to a wider military conflict between Syria and Israel, Iran and Israel or a combination thereof.
There is also the not inconsiderable risk of terrorism and a major act of terrorism in the UK, U.S. or elsewhere in western world.
A "September 11" style event would quickly make market participants realise the importance of gold as a diversification in a portfolio. This has been forgotten about recently due geopolitics failing to impact on asset markets and due to the outperformance of equities, bonds and property.
It is worth remembering that gold was dismissed as a safe haven during a similar bout of “irrational exuberance” at the turn of the century prior to September 11, the potentially never ending war on terrorism and the resumption of history.
It is also important to remember that gold was dismissed as a safe haven in the 2005 to 2007 period prior to the collapse of Lehman and the global financial crisis.
The penny is slow to drop for more speculative market participants.
Has the Russia-Ukraine crisis shown us that gold simply is not the safe-haven that it once was?
It is premature to suggest that the Russia-Ukraine crisis shows that gold is not the safe-haven that it once was. The same thing was said in the early stages of the credit crisis after gold's initial falls when Lehman collapsed. Soon afterwards, gold again showed its safe haven credentials over the long term.
Focussing on very short time frames and data sets can lead to erroneous conclusions.
Do Asian buyers start returning to the market, and do investor ETF inflows start picking up?
The death of the Asian gold market is greatly exaggerated, Asian buyers have already begun coming back to the market and the latest data shows demand in India has picked up markedly and Chinese demand remains robust.
There is already evidence that demand has picked up significantly in India and China.

The world’s largest bullion buyer, China imported more gold in September than in the previous month due to demand from retailers stocking up for the current National holiday.
In the last month, withdrawals from the SGE have totalled over 170 tonnes – this suggests an annual rate of over 2,200 tonnes. "The physical volumes have been high this month compared to August. I would say imports could be at least 30% higher than last month," a trader with one of the 15 importing banks in China told Reuters.
Meanwhile, demand in India - the second biggest buyer of gold - has also picked up significantly in recent days as the festival and wedding season began in earnest.
How strongly correlated will gold be with the dollar in Q4?
The Dollar Index is testing the top end of its long established range. We believe this is largely a function of euro and other fiat currencies weakness rather than dollar strength.
Before last week’s very slight fall, the dollar had risen for 10 weeks in a row, the first time for 40 years. It appears overvalued in the short term and looks ripe for a correction.
Gold traditionally has a strong inverse correlation with the dollar. However, there have been bouts of dollar strength coinciding with gold strength which saw gold rise sharply in euros, pounds and other currencies.
This is a possibility in the coming months.
More likely are competitive currency devaluations and currency wars. Central banks are unlikely to allow one currency to rise too sharply versus another as it creates deflationary risks for the appreciating currencies economy.
A resumption of currency wars seems likely either in Q4 or in 2015 and in the coming years.
Where does gold average in Q4 vs. Q3?
Gold is likely to average $1,280/oz in Q4 from $1,207 today. Technical damage has been done and further consolidation may be necessary but we see gold eking out small gains in Q4 prior to gains in 2015 and a resumption of the secular bull market or a second bull market as happened in the 1970s.
MARKET UPDATE
Today’s AM fix was USD 1,207.50, EUR 956.06 and GBP 751.03 per ounce.
Yesterday’s AM fix was USD 1,214.50, EUR 960.99 and GBP 750.94 per ounce.
Gold in Singapore ticked lower from $1,214 per ounce to over $1,207 per ounce and gold remains weak and at these levels in late morning trade in London.
Gold fell $0.80 or 0.07% to $1,213.80 per ounce and silver slipped $0.08 or 0.47% to $17.10 per ounce yesterday.

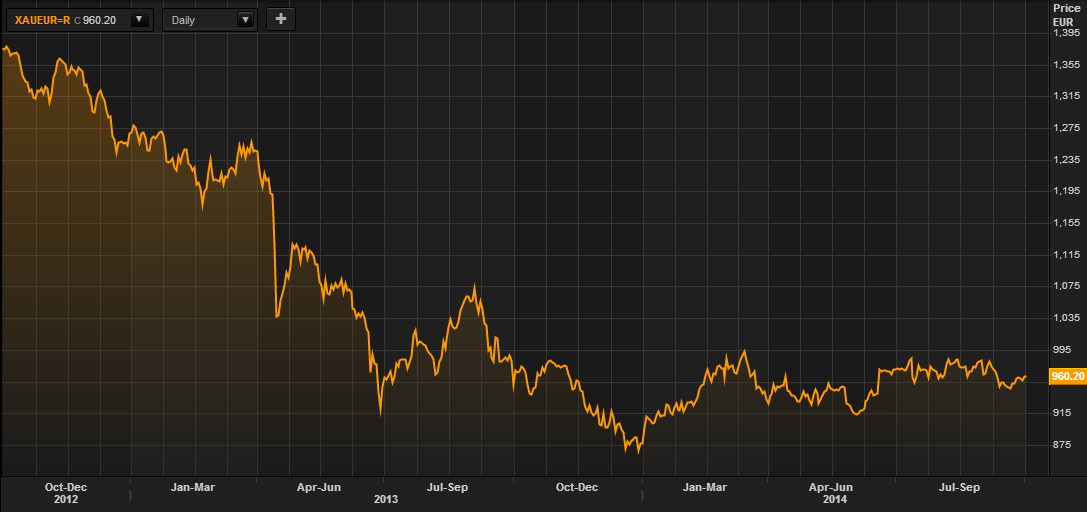
Gold in Euros - 2 Years (Thomson Reuters)
It is important to note that gold’s falls continue to be primarily in dollar terms and that gold in euros and pounds has seen only minor falls.
Indeed, gold in euros remains nearly 10% higher for the year and has risen from €876 per ounce at the start of the year to over €956 per ounce today.
Gold in British pounds has risen from £727 to £750 per ounce for a gain of 3.3%.

Gold in British Pounds - 2 Years (Thomson Reuters)
Physical demand remains robust in Asia and we are seeing a pick up in western markets now too. Data from the U.S. Mint and Perth Mint show that safe haven bullion coin buying returned in September as western demand increased.
The U.S. Mint sold over 50,000 ounces of American Eagle gold coins so far in September, its highest monthly sales since January. The Perth Mint's sales of gold coins and bars hit their highest in nearly a year in September. Sales of gold bullion coins and minted bars rose to 68,781 ounces in September, their highest since October 2013.
The world’s largest bullion buyer, China imported more gold in September than in the previous month due to demand from retailers stocking up for the current National holiday.
In the last month, withdrawals from the SGE have totalled over 170 tonnes – this suggests an annual rate of over 2,200 tonnes. "The physical volumes have been high this month compared to August. I would say imports could be at least 30% higher than last month," a trader with one of the 15 importing banks in China told Reuters.

Gold in US Dollars - 2 Years (Thomson Reuters)
Meanwhile, demand in India - the second biggest buyer of gold - has also picked up significantly in recent days as the festival and wedding season began in earnest.
Prithviraj Kothari, vice president of the India Bullion & Jewellers' Association told the Reuters Global Gold Forum in an interview that there is currently “huge physical demand in India in every sector.”
Indian demand may be double that of last year, he believes.
Gold ETF inflows are likely to resume as silver inflows have already done.
Speculators continue to sell paper and electronic gold while prudent buyers in China, India and elsewhere continue to accumulate physical bullion.
This dichotomy can only last for so long before the powerful forces of actual physical demand in the small physical gold market lead to higher prices.

| Digg This Article
-- Published: Friday, 3 October 2014 | E-Mail | Print | Source: GoldSeek.com

