-- Published: Tuesday, 7 October 2014 | Print | Disqus
With few exceptions, commodity prices have fallen sharply in recent months, to their lowest levels in over a year.

Silver in U.S. Dollars, 5 Years (Thomson Reuters)
Relative to stock market indices, broad commodity indices are now at their lowest levels since the late-1990s dot com boom.
But key commodity price ratios, such as those between precious and industrial metals, are already at levels associated with financial crises such as that of 2008. In other words, there is already blood on the commodity streets, presenting investors and commodity traders with potentially attractive opportunities.
COMMODITY PRICES, RATIOS, WARNINGS
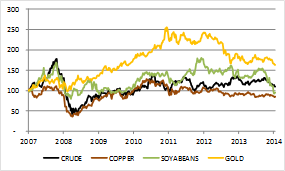
Back in 2007, before it became generally apparent that the US housing bubble had burst, commodity prices were in a strong uptrend, which accelerated into 2008. By June that year, multiple commodity prices had soared to all-time highs. Copper reached $450/pound, soyabeans soared to over $1,600/bushel, cotton rose through $200/pound and crude oil briefly exceeded $140/bbl.
Source: Bloomberg, CME
COMMODITIES:FROM BOOM TO BUST (SEP 2007=100)
Many commentators at the time argued that soaring commodity prices were indicative of a so-called supercycle driven by soaring demand from emerging economies such as China, India and Brazil. Growth in these countries was indeed rapid in the decade leading to 2008. But commodity supply was nevertheless rising to meet demand and it has continued to do so.
Following a sharp correction lower during the global financial crisis of 2008, commodity prices recovered in 2009-11, only to re-enter a downtrend which has continued to this day. Some argue that this is but a normal cyclical correction due to slowing global demand. Others believe it implies that the supercycle is over.
In a previous report, I used commodity price ratios to argue against the supercycle explanation for the boom (or bust) of commodity prices in recent years, pointing out that growth-oriented commodity prices, such as those for copper or crude oil, had not risen materially relative to those for non-industrial commodities, such as gold.[1] Were the supercycle for real, this would not have been the case.
Thus it is my view that the sharp downtrend in commodity prices in recent months is primarily a cyclical phenomenon indicative of sharply weaker global industrial demand, combined with a stronger dollar.[2] There is some support for this view in that global leading indicators have declined in recent months. In many cases, commodity prices and price ratios have fallen to levels not seen since the depths of the global financial crisis of 2008.
COMMODITIES LEFT FAR BEHIND IN THE RALLY

Source: Bloomberg, Standard and Poors
Does this imply that a crisis is imminent? Perhaps not, but it does highlight the fact that, notwithstanding a modest correction of late, equity and risky asset prices generally remain elevated and could well experience a major correction lower. Commodities, by contrast, are almost as cheap as during the 2008 crisis and thus it would appear prudent to take profits, rotating out of the former and into the latter.
SLOWING PRODUCTIVITY AND STAGFLATION
An ever stronger case can be made for commodities when adding in the evidence that productivity growth has slowed. Other factors equal, weak (or negative) productivity growth shifts the overall growth/inflation mix within an economy, such that there is proportionately more inflation relative to growth. Even in the event of recession, for example, inflation might not decline by much, if at all. This was observed in the US during much of the 1970s and early 1980s, for example, and the term stagflation was coined at the time to describe it. Price inflation might be low at present, as was also the case in the early to mid-1970s, but it picked up much more rapidly relative to growth later in the decade.
In another recent report I focused on stagflation, including the financial market consequences:
Stocks might be able to outperform bonds in stagflation but, when adjusted for the inflation, in real terms they can still lose value. Indeed, in the 1970s, stock market valuations failed to keep pace with the accelerating inflation. Cash, in other words, was the better investment option and, naturally, a far less volatile one.
Best of all, however, would have been to avoid financial assets and cash altogether and instead to accumulate real assets, such as gold and oil...[3]
A persuasive case can be made that the potential for gold, oil and other commodity prices to outperform stocks and bonds is higher today than it was in the mid-1970s. Monetary policies around the world are generally more expansionary. Government debt burdens and deficits are far larger. If Keynesian policies caused the 1970s stagflation, then the steroid injection of aggressive Keynesian policies post-2008 should eventually result in something even more spectacular.
This combination of low commodity prices, both outright and relative to those for equities and other risky assets, and weak productivity growth implying a period of stagflation ahead, is both highly unusual and, from the perspective of an opportunistic investor, highly attractive. Perhaps not since the 1970sperhaps not even since the early 1930shas there been such a good opportunity in which to accumulate and overweight real assets in a portfolio.[4]
PASSIVE AND ACTIVE TECHNIQUES FOR COMMODITIES INVESTING
Investors sharing this view need to consider how best to acquire a commodity exposure. There are numerous ETFs out there, some of which follow prominent broad indices, such as those calculated by Standard and Poors or Bloomberg, for example. However, as I have written before, these products are not well-designed as investment vehicles because they are not well diversified. In particular, they are strongly overweight industrial commodities, which tend to be highly correlated with one another. A better diversified product would be preferable, for example one based on the Continuous Commodity Index, a broad, equal-weighted basket of both industrial and non-industrial commodities.[5]
Those inclined to take a more active approach should consider overweighting specifically those commodities which appear to have attracted speculative selling of late. Here at Amphora, we advise clients on commodities markets and also trade on our own behalf. Our investment process begins with a proprietary tool we call our heat map. This is a visual representation of statistically-normalised commodity price ratios, arranged in a matrix. Those price ratios at statistical extremes appear in red; those within normal ranges are shown in white. The amount of red relative to the amount of white thus indicates to what extent commodity price ratios, in general, are out of line with historical averages.
At present, those commodities appearing particularly cheap on key ratios would include silver, wheat and soybeans. Crude oil and copper prices have also fallen sharply but not to the same degree against their key ratios. Thinking fundamentally, it is also unlikely that industrial commodity prices will rise in the event that equity markets meaningfully correct to the downside in the coming months.
SILVER, WHEAT and SOYABEANS ARE PARTICULARLY CHEAP AT PRESENT

Source: Bloomberg, CME (Sept 12 = 100)
On the other side, there are a handful of commodities that have bucked the downtrend, but all of these can be explained with reference to extreme weather patterns or other unusual factors.
Coffee, the years top performer, remains elevated in price due to poor rainfall in the Brazilian Highlands, the worlds top-producing region.
Cocoa prices are elevated in part due to concerns that the tragic West African Ebola outbreak will complicate this years harvest (which appears quite large).
Cattle prices have soared in recent months as seasonal rains have failed to arrive in key ranching areas of the Western US. (That said, the sharp decline in hog prices in recent months could contribute to lower cattle prices if and when consumer substitution effects begin to kick in.)
Strength in these commodity prices in no way contradicts the general weakness or the view that global industrial production has slowed sharply.
COFFEE AND CATTLE PRICES ARE COMMODITY OUTLIERS AT MULTI-YEAR HIGHS

Source: Bloomberg, CME, ICE
SHADOW BANKING, MONEY AND GOLD
Finally, a few words on gold. On multiple occasions over the past year gold has fallen to and found support around $1,200/oz. This has now happened again.
There is widespread evidence of strong physical demand around this level, which I believe is long-term and strategic in nature, associated with official institutions, such as emerging economy central banks, and wealthy investors seeking a hedge against a future financial crisis.
That said, a new forward hedging programme on the part of major gold mining firms could send the price lower. Once this was completed, however, I am confident prices would recover quickly to above $1,200 again.
The flow of produced (or forward-hedged) gold is tiny relative to the strong underlying physical demand over a multi-month or longer horizon.
GOLD CONSISTENTLY FINDS SUPPORT AROUND $1,200/OZ AS THE S&P500 CATCHES UP

Source: Bloomberg, CME
Fundamentally, the arguments in favour of a substantially higher gold price remain intact.
The global money supply continues to increase at a historically elevated rate.
Bank credit concerns faded for a time but have recently returned to the fore, a source of concern for the safety of bank deposits, especially in the euro-area.
In this context, in the event the Fed, ECB or other major central banks indicate they are concerned by growing signs of economic weakness and declining rates of consumer price inflation, the gold price is likely to re-enter an uptrend that could continue for some time.
As the IMF recently observed,[6] the global shadow banking system has been growing rapidly, fuelled by rapid money supply and credit growth, and has again become a potential source of systemic risk, as it also was back in 2007-8.
By the time the IMF makes such observations, prepares a report, approves it for publication and makes it available for external distribution, you can be rather certain that the developments in question have long since rung the alarm bells in the hallowed halls of that esteemed supranational financial regulatory institution. The Bank for International Settlements published a report expressing similar concerns over the summer.[7]
Longer-term, with economic officials stubbornly clinging to worn-out monetary stimulus measures that have lost most if not all their effectiveness due to excessive debts, public and private, and with an equal reluctance to implement any meaningful structural reforms to encourage sustainable business investment and boost productivity, there is simply no where for the gold price to go but up as the effective purchasing power of fiat currencies goes down.
There is also the possibility that, when investors least expect it, certain currencies, perhaps even major ones, suffer sudden crises of confidence in which the threat of devaluation looms.
The dollar itself is not immune, given that the US possesses the worlds largest cumulative external trade deficit.
Indeed, I have long predicted an eventual loss of pre-eminent reserve status for the dollar, something that would send the greenback lower and dollar interest rates higher when it occurs.
Gold is a form of insurance against this eventuality or against currency crises more generally, as indeed it always has been. For those so concerned, the ideal time to add to such insurance is when it is temporarily on-sale, as it is today at just under $1,200/oz.
John Butler is a respected investment manager with Amphora Capital. He is the author of the excellent 'The Golden Revolution : How to Prepare for the Coming Gold Standard and author of the must read Amphora Report.
Follow John on twitter @butlergoldrevo
www.amphora-alpha.com
[1] Please see COMMON COMMODITY MISCONCEPTIONS, Amphora Report vol. 5 (June 2014). The link is here.
[2] As it happens this view appears to be shared by the staff of the Economist, as presented in this recent article linked here.
[3] Please see STAGFLATION IS, ALWAYS AND EVERYWHERE, A KEYNESIAN PHENOMENON, Amphora Report vol. 5 (August 2014). The link is here.
[4] Although characterised as deflationary by most, following the large devaluation of the dollar in 1934, the second half of the 1930s was in fact a period of stagflation, as consumer prices rose alongside generally weak economic growth.
[5] The CCI index components are: Cocoa, Coffee, Copper, Corn, Cotton, Crude Oil, Gold, Heating Oil, Live Cattle, Live Hogs, Natural Gas, Orange Juice, Platinum, Silver, Soybeans, Sugar and Wheat.
[6] This IMF report can be found at the link here.
[7] This BIS report can be found here.
GOLDCORE MARKET UPDATE
Todays AM fix was USD 1,207.50, EUR 957.27 and GBP 751.49 per ounce.
Yesterdays AM fix was USD 1,193.25, EUR 951.56 and GBP 746.67 per ounce.

Gold in Dollars, 5 Years (Thomson Reuters)
Gold climbed $15.20 or 1.28% to $1,207.00 per ounce and silver soared $0.50, nearly 3% to $17.31 per ounce yesterday.
Gold in Singapore ticked marginally higher from $1,204 per ounce to near $1,210 per ounce. Gold continued marginally higher in early London trading prior to slight falls.
Premiums for gold in Asia were quoted at $1.20 to $1.60 an ounce to the spot London prices, unchanged from last week. In Tokyo, sellers pushed up premiums for gold bars to 25 cents to spot prices from zero last week.
The price fall attracted physical buyers and bargain hunters for gold yesterday, boosting prices.
Gold imports into Turkey rose sharply in September to 12.599 tonnes, their highest this year and more than double last September's total of 4.843 tonnes, data from the Istanbul Gold Exchange shows.
Turkish gold bullion imports climbed to 12.6 tonnes in September, verses 2 tonnes in August, data published from Borsa Istanbul showed.
Total gold imports in the first three quarters, at 65.577 tonnes, are sharply down on the 235.4 T imported in the first nine months of last year (a record year for gold imports).
Gold in Euros, 5 Years (Thomson Reuters)
Bullion demand has picked up but remains anemic and we are seeing only quite a small amount of new clients despite huge engagement with our emailed research and social media community.
Some of our long standing clients, particularly more liquid HNW clients, are adding to allocations and see this latest sell off as an opportunity. New business is also coming from existing gold and silver investors and owners as we are seeing flows from ETF and other bank vaulted gold and silver into our allocated storage in Zurich and Singapore.
Sentiment is as bad as I have seen it and reminiscent of the 2003 to 2007 period. We believe that the poor sentiment is quite bullish from a contrarian perspective.
| Digg This Article
-- Published: Tuesday, 7 October 2014 | E-Mail | Print | Source: GoldSeek.com


