-- Published: Thursday, 9 October 2014 | Print | Disqus
By Steve St. Angelo, SRSrocco Report
The Banker Cartel has a method to their madness in manipulating the precious metals and commodity markets. Lets just say, the value of some commodities are controlled to move one direction while others, in another. This can clearly be seen when we compare gold & silver versus oil markets.
Investors need to realize energy, especially oil overtook the role of gold and silver as the most vital source of wealth in the early 1900s. While its true that oil is burned and consumed
the ownership or control of oil reserves allowed the WEST to dominate the world in trade and finance.
A growing global oil supply allows the fiat monetary system to continue. As I have mentioned in many of my articles, the peak and decline of cheap oil will be DEATH on the fiat monetary systemespecially the U.S. Dollar.
Most of the analysis on the precious metals is very focused and specialized. Sometimes, the most interesting results are found looking in a much broader way. If we look at the following charts, we can see how the Bankers manipulated gold and silver, while allowing the price of oil to remain high.
Here is a five-year chart of Brent crude. There are a few important aspects of this chart worth explaining.
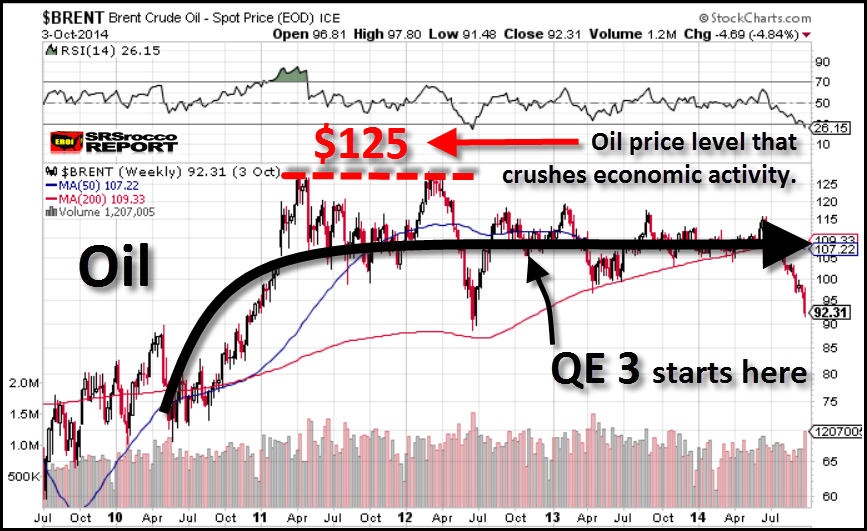
First, the price of Brent moved higher in 2010 the same time as the precious metals, but remained flat after QE3 was announced at the end of 2012. The price of Brent remained in relatively stable trading range ($110) up until June of this year.
Second, when Brent crude hit $125, it would peak and decline. This is due to the market cutting back on demand as the price becomes too expensive. According to new analysis by Steve Koptis, called the Supply Constrained Model , the world cannot afford expensive oil, so it cuts back on demand. Basically, as the price of oil moves too high, it negatively impacts economic activity.
Third, after the FEDs QE 3 program (end of 2012), the price of Brent crude fluctuated, but remained at $105-$110 until June of this year. The price stayed in this range due to high demand. Now, if we look at the chart below, we can see the price of U.S. Crude oil (WTI- West Texas Intermediate) versus demand.
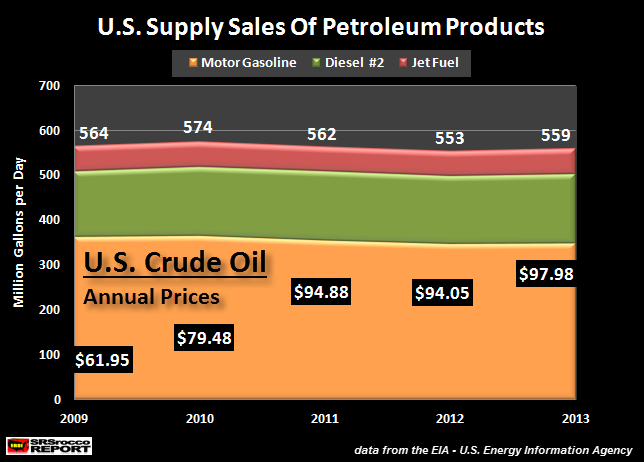
This chart represents total of motor gasoline, #2 diesel, and jet fuel supplied by the U.S. petroleum industry. Total supplies peaked in 2010 at 574 Mgpd (million gallons per day), fell to an average of 553 Mgpd in 2012 and then increased a bit to 559 Mgpd in 2013 (data from U.S. EIA Energy Information Agency).
Even though demand declined 21 Mgpd from 2010 to 2012, the average price of WTI Crude increased from $79.48 (2010) to $94.05 (2012). The majority of the declines came from the motor gasoline category (shown in orange). In 2009, total motor gasoline supply (consumption) was 363 Mgpd, compared to 349 Mgpd in 2013.
Some believe the decline in U.S. motor gasoline demand was due to increased fuel efficiency. While this sounds like a credible reason
that data states otherwise. This table is from the EIAs September 2014 Monthly Energy Review, reported data for the United States (data found here on pg 27).
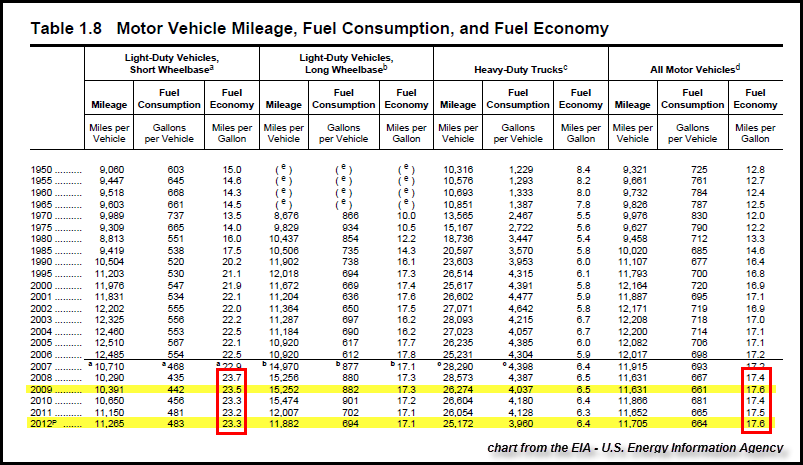
The first column represents fuel economy from U.S. light duty vehicles (cars and small trucks). U.S. fuel economy increased significantly from 22.9 mpg (miles per gallon) in 2007, to 23.7 mpg in 2008. However, after the price of oil declined from a peak of $147 in 2008 to a low of $33 in 2009, Americans ditched the small economical cars for the larger SUVs.
According to the data, the average fuel economy in this category for 2012 was 23.3 mpg compared to the high of 23.7 mpg in 2008. If we combine the statistics for all motor vehicles, including large semi-tractors, overall fuel economy remained the same at 17.6 mpg in 2009 to 17.6 mpg in 2012.
Regardless, total U.S. petroleum product supplies (consumption) declined from 574 Mgpd in 2010 to 559 Mgpd in 2013, while the price of U.S. WTI Crude increased from $79.48 to $97.98.
We must remember, OIL DRIVES the economy. In order for the U.S. SHALE OIL INDUSTRY to continue pumping out oil, it needs a sustained HIGH PRICE.
Gold & Silver Demand Increase While The Price Is Manipulated Lower
While demand for U.S. oil products slightly declined (or remained steady) from 2009 to 2013, this was the opposite for gold and silver. Lets first look at gold. Here is a five-year gold price chart:

We can see golds trend line is similar to the price of Brent crude until the end of 2012 when the price of oil remained steady, gold declined precipitously.
The next chart is total global gold demand. From 2009, total global gold demand increased from 3,493 mt (metric tons) in 2009, to a peak of 4,582 mt in 2011, and then a small decline to 4,416 mt in 2012. 2013 is a strange year because of the huge withdrawal of gold from ETF stocks. According to the World Gold Council, a net 881 mt of gold was withdrawn from ETFs in 2013.
Many in the precious metal community speculated that the massive draw-down of Gold ETFs, was due to a shortage caused by huge demand coming from the EAST (China) after the price take-down in the beginning of 2013. Supposedly, the Banking Cartel did not have the physical gold to deliver into the market, so it raided the only available stocks found in the Gold ETFs.
If we assume this was true, then it only makes sense to add this 881 mt figure to the net total of 3,756 mt published by the World Gold Council in 2013 for a grand total of 4,637 mt in global gold demand.
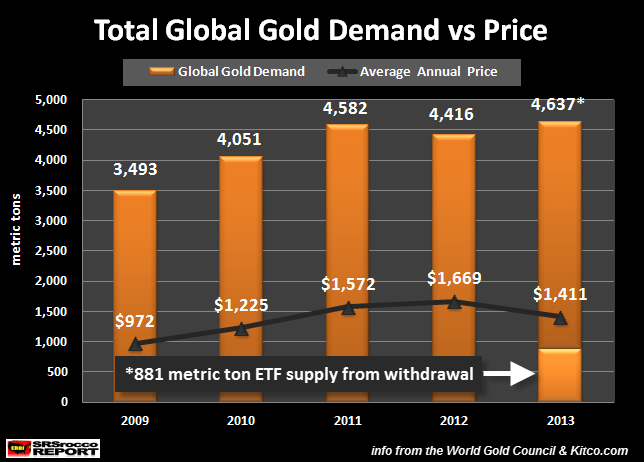
The World Gold Council deducts the 881 mt ETF withdrawal from demand to get that 3,756 mt figure. While this method might make sense in a fair and transparent market, its ridiculous to use when the entire system is totally rigged.
Not surprising
the five-year silver chart looks quite similar to gold:

Here we can see in the price of silver, follows the same trend change as gold. Silver was trading at $35 in 2012 (before QE3), and fell nearly 50% in 2013just eight months later.
This next chart does not show total global silver demand because I believe the change in NET BALANCE was more important:
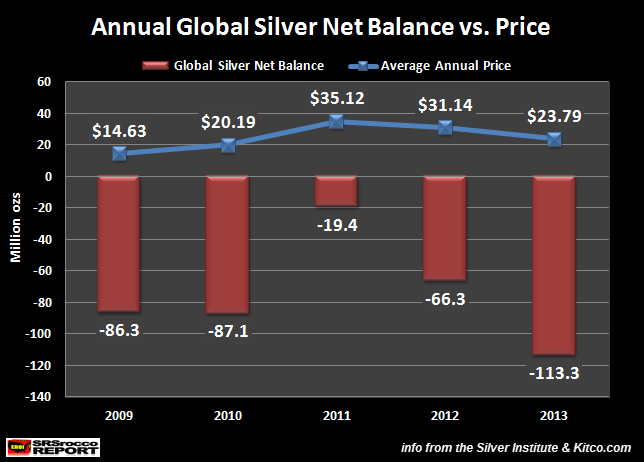
These figures came from the Silver Institutes website reporting data provided by Thomson Reuters GFMS (data here). How can the global silver market suffer a 113 million oz deficit in 2013, compared to the 19 million oz deficit in 2011, while the price falls more than $11??
According to the Silver Institutes figures, total global silver supply was 978 million oz, while total demand was 1,091 million oz (including 10 mt of ETF and Exchange build). Where did the market find 113 million oz of silver to supplement the shortfall?
This is the TRILLION DOLLAR question.
Matter-a-fact, the total annual deficits from 2009 to 2013 equaled a staggering 372 million oz. Who supplied 372 million oz to meet this silver demand? I believe this came from what is known as Implied Unreported Stocks that were over 2 billion oz in 1990 (data from CPM Groups 2014 Silver Yearbook). This 2+ billion oz went to supplement the annual silver deficits over the past 3 decades.
According to data provided by CPM Groups 2014 Silver Yearbook, that 2+ billion oz of Implied Unreported Silver Stocks are now nearly totally wiped out. I believe most of that silver went to feed the annual deficits and some made its way into the Silver ETFs.
Investors must realize that the Fiat Monetary Authorities will allow the price of oil to remain high because it is the foundation to economic activity and growth. The Banking Cartels main focus in the oil market isnt to manipulate oil prices higher to make profits, rather to allow HIGH COST oil to flow into the market. And
high cost oil are Shale Oil and Tar Sands.
Without these two sources of expensive unconventional oil, Global GDP growth would have peaked and declined years ago. Thus, putting a real KIBOSH in their control of the fragile fiat monetary system.. which needs a growing oil supply to survive.
The Banking Cartel needs to keep investors away from buying gold and silver because they are the BLINKING RED LIGHT that indicates something is very wrong with the financial system. To keep the public and investor demand limited in gold and silver, the Banking Cartel is using price suppression tactics, including negative press via the financial networks.
While they may have won the recent BATTLE, they will certainly lose the WAR. Those who see through all the SMOKE & MIRRORS will continue to acquire the precious metals even though many have lost faith.
Please check back for new articles and updates at the SRSrocco Report. You can also follow us at Twitter below:

| Digg This Article
-- Published: Thursday, 9 October 2014 | E-Mail | Print | Source: GoldSeek.com


