-- Published: Tuesday, 21 October 2014 | Print | Disqus
By Market Anthropology
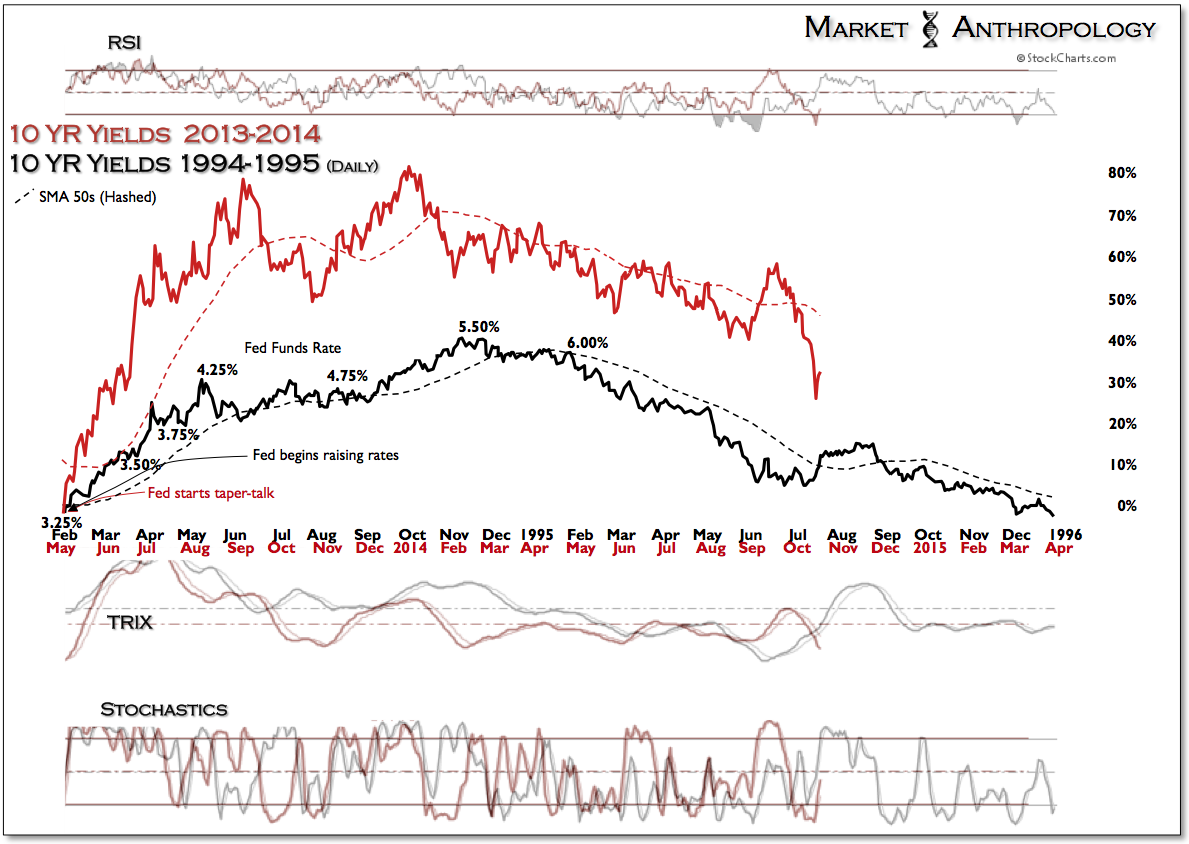
The expectation gapcrashed close last week - with all the subtlety of an elephant standing and leaving the room. All it took was a four week tour on the weak side of positioning, to panic participants out of their misplaced policy expectations of impending rate hikes by the Fed next year - or an imminent breakdown in the government bond market. Shortly after the equity markets opened Wednesday morning, 10-year yields collapsed some 14 percent below Tuesday's close, briefly touching 1.86% - the lowest since the Fed began their fireside taper-talks in May 2013. Likewise, 5-year yields collapsed 23 percent lower at the open, briefly touching below 1.2% - before recovering 10bps by the close. Just a few weeks back, participants had hung their hats on the notion that the Fed would need to act sooner rather than later, as economic conditions had improved and anxieties reigned supreme over what the Fed's exit plan would entail. For the week ending September 19th, which happened to mark the top in the S&P - as well as over three and a half year highs in 2 and 5-year yields, many believed the shorter end of the Treasury market was confirming exceptions that yields were headed higher - perhaps, materially so. This opinion was shared by a rather diverse group of personalities, that broadly influenced the ballast of the market - and included; hawks within the Fed itself, traders that continued to believe the over 30-year young bond bull was dead - as well as policy bulls that naturally saw real rates climbing as the Fed emerged triumphant from their extraordinary policy stance. If only they had listened to Yellen, who apparently didn't shared the same respective confidences of even the policy bulls themselves. Lower - longer. Lower - l o n g e r. For better or worst, there are two essential maxims we've had embroidered and framed, in navigating the intersection of markets and policy: listen to the leader and not the follower - and check your biases at the door. This sensibility was personified on Thursday, as Federal Reserve Bank of St. Louis President, James Bullard, quickly pivoted from last months tone of removing "considerable time" at the upcoming Fed meeting - to the possibility of maintaining QE for the foreseeable future. Perhaps follower is too kind. Nevertheless, we don't anticipate the Fed will take up QE4 anytime soon - or tighten, which would preserve Bullard's track record of handicapping the wrong pony, no matter which race. Although latent - hence the large expectation gap, the Treasury market has now caught up to expectations, as the calls for further tightening have finally been recognized as greatly misplaced. We have argued over the past year, that for all intents and purposes, the Fed has been tightening since they first brought up the taper in May 2013. At its most basic function, quantitative easing is enacted to instill expectations - beyond were conventional policy tools could apply. When the Fed began their fireside taper-talks in May 2013, they tightened in effect through a pivot in expectations. Considering the move in yields that followed, this was largely confirmed by the market - and why we have contrasted the trend in 10-year yields throughout this year with the arc of the unexpected rate tightening cycle that began in February 1994.
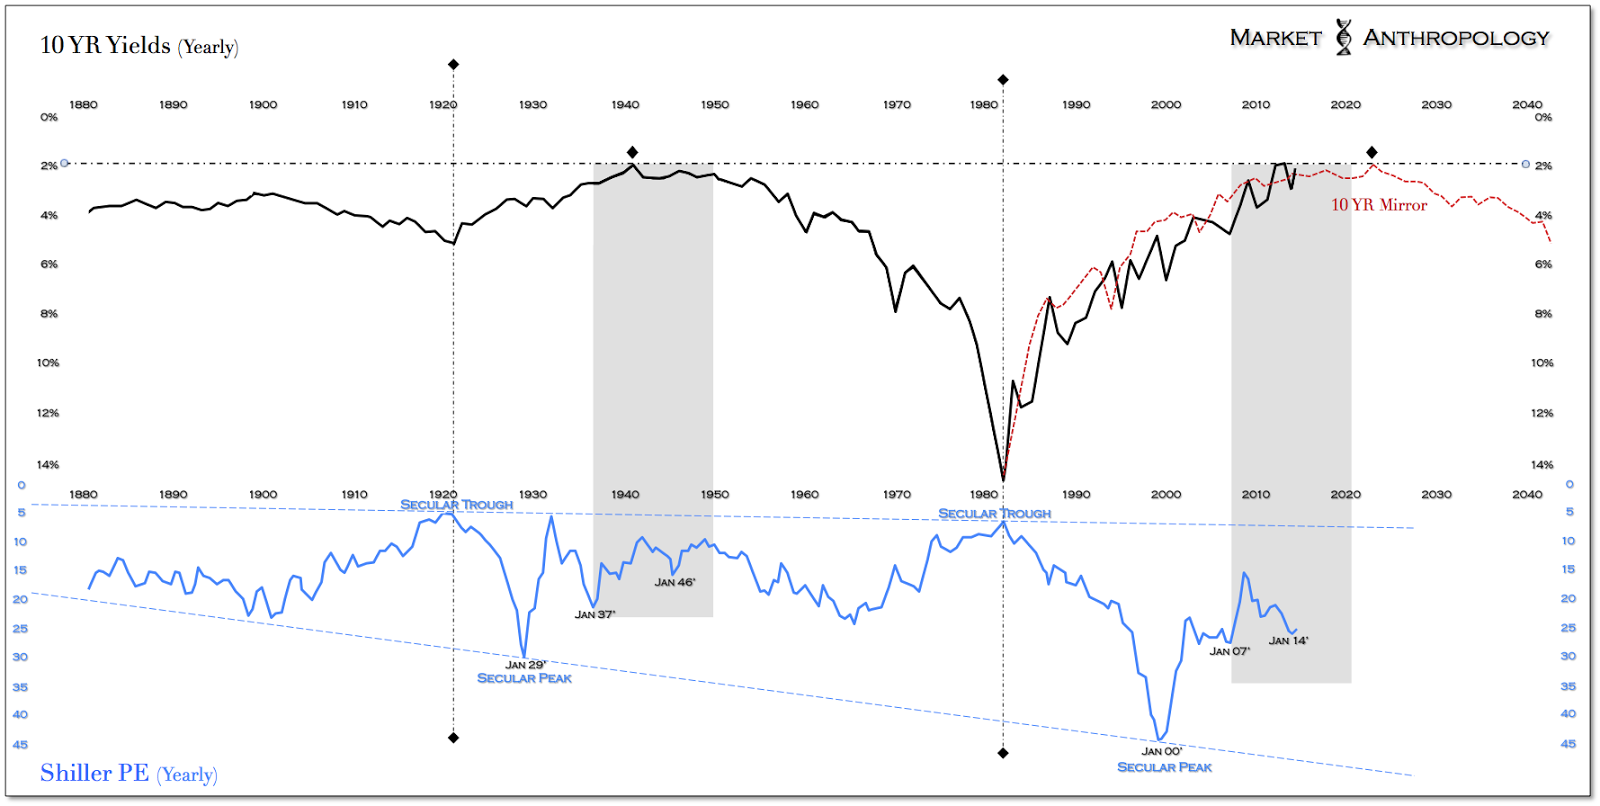
Building on the tenor of last weeks note, the similarities still resonate of a cyclical top in the US equity markets, reminiscent of the last time the government conspicuously supported the markets in like proportions through large-scale asset purchases. Not surprisingly, the 1940's were also a time period in which participants remained shell-shocked from the 1930's and maneuvered between the equity and Treasury markets, as if another depressionary and deflationary wave would unfurl when the Fed and Treasury stepped aside. When they finally did in 1946, the self-fulfilling prophesy manifested in a swift 30 percent revaluation in equities - while participants panicked and hunkered down in Treasuries expecting another chapter of the Great Depression to unfold. Sound familiar? Krugman apparently thinks so too. As the Fed looks to wind down QE later this month and with the equity markets coming under pressure once again, the natural comparative reaction is to assume the Fed will cow-tow to market pressures, as they have before; or in absence of that support - assume the worst and a downturn on par with the two previous bear markets (2007 and 2000), or as Krugman fears - a 1937-esque collapse. Broadly speaking, we don't find the same excesses available in the markets - both domestically and globally, or underlying economic conditions that are typically required to support declines of that magnitude. Moreover, we would argue that from a comparative perspective of valuation trends in equities relative to the long-term yield cycle (see below), the bear market that began in 2007 was our 1937. The third peak from the secular high would be our 1946, which just happens to be the last time the government spoon fed the markets and the mirror of the cycle in 10-year yields.
Over the past month as momentum in the equity markets has begun to cough out, volatility awoke from a long slumber. In doing so, the SPX completed on October 9th a 3 day series of large (1.5%) moves for the first time in over a year. Surprisingly, the definitions of this study (which was brought to our attention by the fine folks at Nautilus Capital Research) reflects a rare condition in the SPX, the likes of which have only occurred 9 times over the last 77 years - 5 of which have signaled around major equity peaks in 29', 37', 46', 00' and 07'. Last week, the SPX broke below its 200-day moving average for the first time in 476 days. As presented in another study by Nautilus, this is the 7th longest consecutive streak in over 100 years, sharing the mantle with the three peaks in 29', 37' and 46'.
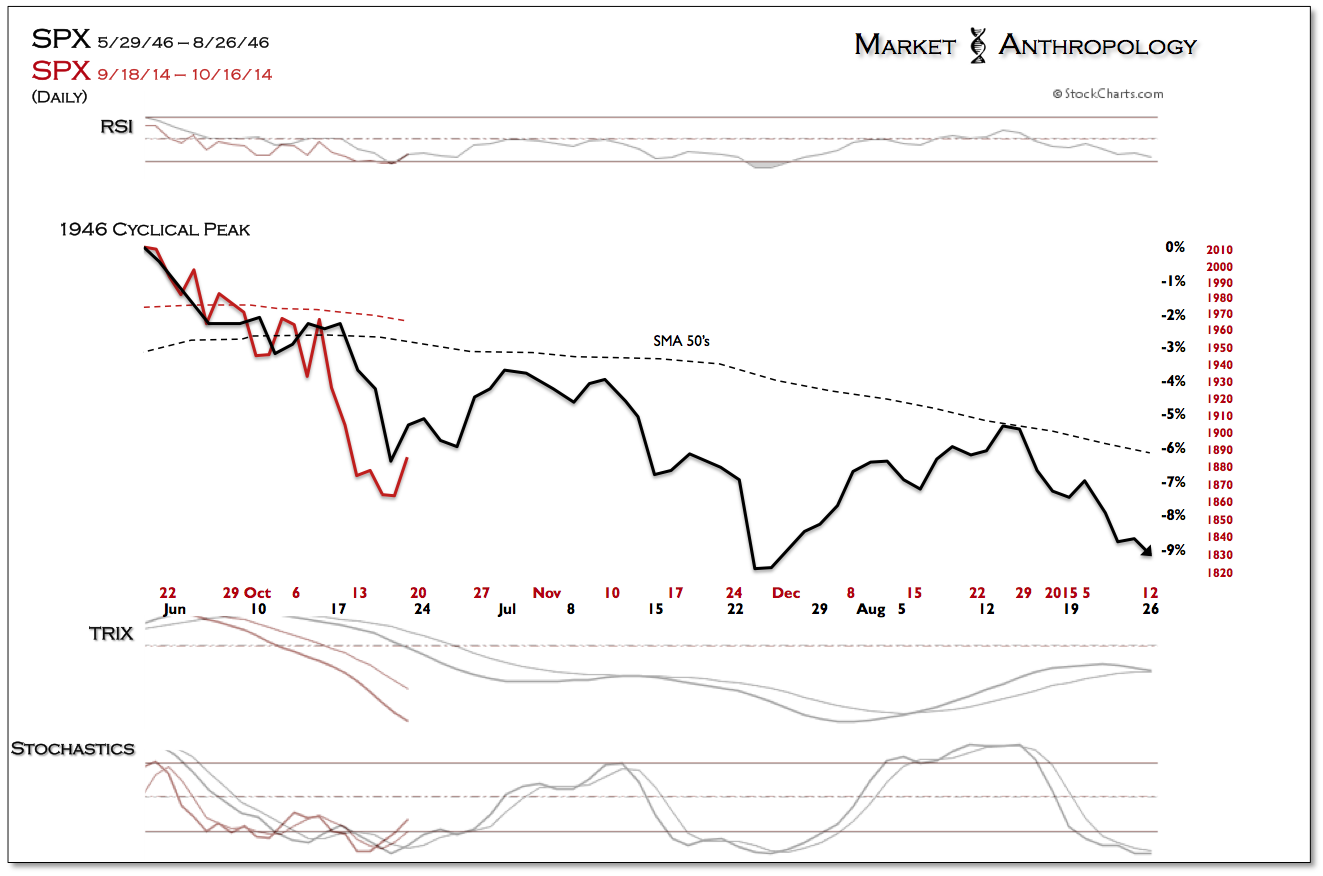
Overall, we find that the two studies reflect the expectation gap that just closed and a market environment sputtering from benevolent and complacent conditions, that one could argue has been greatly supported by the active and visible hand of the Fed. Taken in context with our previous work, we continue to find the historic parallels with the 1940's compelling and worthy of further contrast. As is the case with all comparative reasoning, we primarily use the work to generate a strategic outlook of what might lie ahead - based on similar market conditions in the past. It is rarely a refined and discriminative inference, but very much a composite sketch between quantitative and qualitative conditions. That said, below is a comparative momentum and performance study normalized between the cyclical peak in 1946 and the current high in the SPX on September 18th. Based on this study, the equity markets would retrace the decline over the next few weeks, before resuming the downtrend in November.
This retracement perspective is supported by the work of our friends over at EidoSearch, which provides quantitative expectation analysis - based on a comprehensive numerical search engine of historical market data. What makes EidoSearch unique, is that it utilizes innovative signal processing and classification technologies of the dedicated pattern itself, to generate quantitative forward looking projected ranges.
Based on the current trend in the SPX that began with the high set on September 18th and using a minimum pattern similarity of .85, the search found 89 similar instances (since 1980 in the SPX) - with the index up two thirds of the time over the next month with an average return of 1.8%.
All things considered, while we remain bearish on the SPX's intermediate-term prospects, we find further room to run for the retracement rally that began in the SPX last week.
The content on this site is protected
by U.S. and international copyright laws and is the property of GoldSeek.com
and/or the providers of the content under license. By "content" we mean any
information, mode of expression, or other materials and services found on GoldSeek.com.
This includes editorials, news, our writings, graphics, and any and all other
features found on the site. Please contact
us for any further information.
Live GoldSeek Visitor Map | Disclaimer
The views contained here may not represent the views of GoldSeek.com, Gold Seek LLC, its affiliates or advertisers. GoldSeek.com, Gold Seek LLC makes no representation, warranty or guarantee as to the accuracy
or completeness of the information (including news, editorials, prices, statistics,
analyses and the like) provided through its service. Any copying, reproduction
and/or redistribution of any of the documents, data, content or materials contained
on or within this website, without the express written consent of GoldSeek.com, Gold Seek LLC,
is strictly prohibited. In no event shall GoldSeek.com, Gold Seek LLC or its affiliates be
liable to any person for any decision made or action taken in reliance upon
the information provided herein.