


We finally have some movement within the gold complex, and for a welcomed change, its to the upside. It has been dicey lately, as the back and forth daily swings have been unnerving. Its not common within bear markets to see an asset form a Cycle Low and then just take off to the upside. This is why anyone trading the precious metals sector needs to understand that the Long traders carry with them a lot of anxiety. Past experiences have them guarded, which is why we see these frequent quick intra-day reversals theyre spooked far too easily.
Fortunately, we are into the timing band for these big Cycle Low events now. Within this report, I bolster the idea that were seeing evidence to support these lows as having pasted already. Shifting the main question now away from whether we have new Cycles in play over to a discussion on what these Cycles could potentially bring.
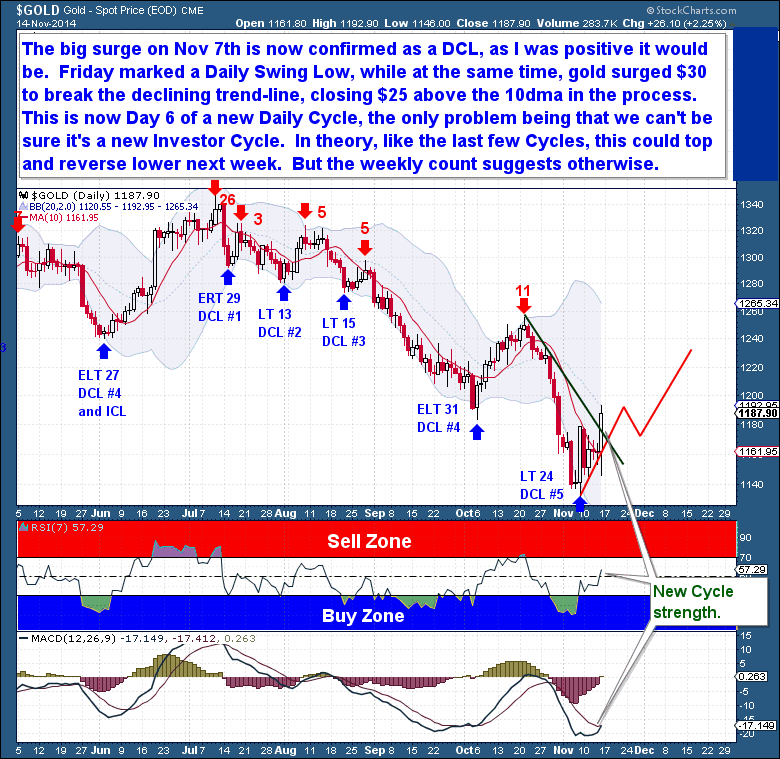
Almost since the day it occurred, I have expected the big surge back on Nov 7th to be marked as a Daily Cycle Low (DCL). And with Fridays repeat (upside) performance of the prior Friday, the $30 move finally marked a Daily Swing Low and a clean break of the declining trend-line. Along with the clear and bullish rise in our technical indicators, its safe to say that gold is into a new Daily Cycle.
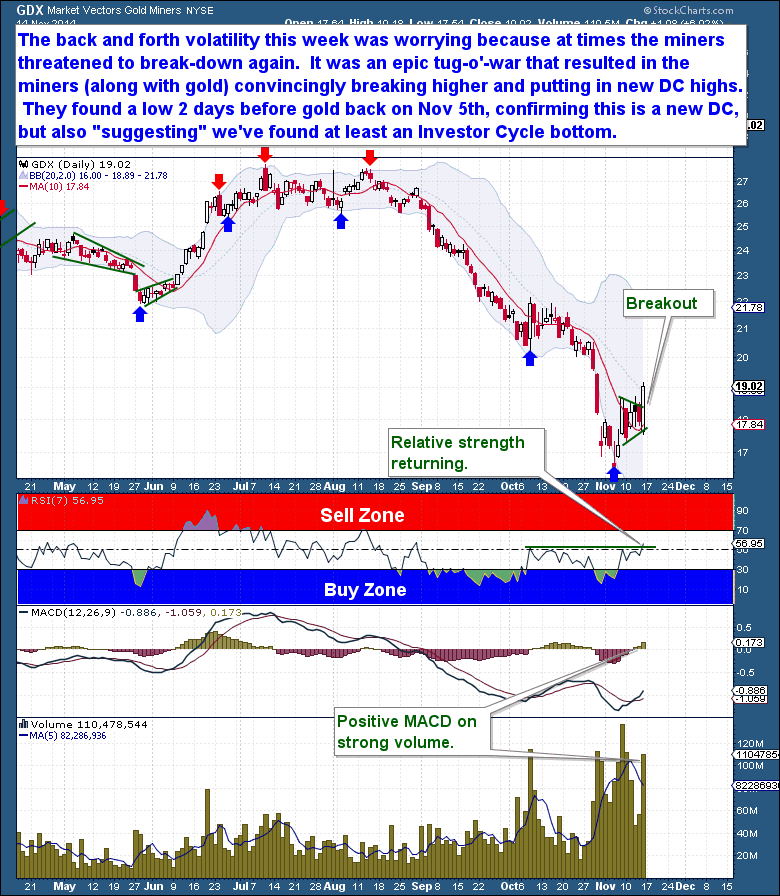
The miners are confirming this gold move and are encouragingly leading the Cycle again. The back and forth volatility this past week was worrying; in the sense they were showing us a potential gold decline was at hand. The mini triangle pattern, resulting from all this volatility did eventually resolve itself, with the miners convincingly breaking higher as confirmation gold was in a new Daily Cycle.
Im encouraged by the action within the miners because back on Nov 5th they did find a low 2 days before gold did. The sell-off they experienced, leading into that low, was of the extreme capitulation variety seen only during major (Yearly and Cyclical) Cycle turns. And because were in the timing band for a gold Investor and Yearly Cycle Low, this early recovery off a 40% crash is suggesting that we have found, in the least, an Investor Cycle bottom.
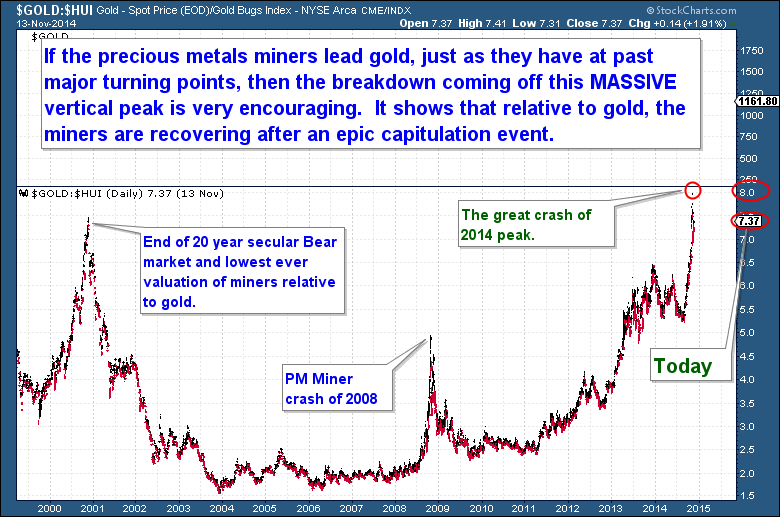
I presented the below gold to miners ratio chart a few weeks ago (members site) as a way to represent just how much the miners had been sold relative to gold. I find this chart important, not because it necessarily predicts where gold is heading, but that during major declines, the miners are sold-off indiscriminately and with extreme prejudice.
It is clear from the chart that relative to gold, the miners became the most undervalued in over 20 years. Having already decline some 65% up until this past summer, the miners since crash another 40% within the past 8 weeks, a classic capitulation event that I can only equate to events on (or bigger than) the scale seen during the 2000 and 2008 bear market lows. Im showing the chart again because the reversal shown by the miners this week holds promise of a much bigger turn. In all past cases, reversals on the ratio chart after massive vertical peak have always marked at least a Yearly Cycle Low.
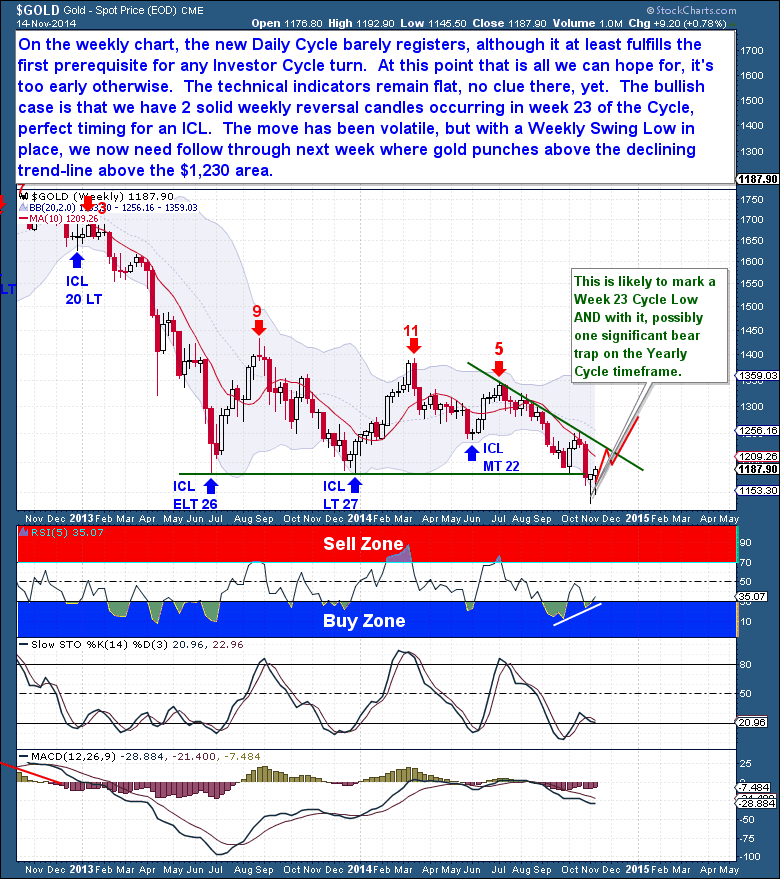
So we have rock solid action to support a new Daily Cycle. But on the weekly chart, that new Daily Cycle barely registers, except that it shows up as a pair of bullish hammer candles comfortably into the timing band for a Cycle Low. Although we can project our expectations, based on this ancillary evidence, the reality is that it just takes patience when waiting for actual confirmation of a new Investor Cycle.
At this point, seeing a new Daily Cycle is encouraging, because it holds the promise of marking a Cycle Low at the longer time-frames too. A DCL is after-all a prerequisite for any new Investor and Yearly Cycle Low, they are intertwined. Although the move so far has been (intra-day) volatile, gold has managed to close out the week with a Weekly Swing Low in place. The foundation stones have been laid.
What I like about this move is that nobody expects it to do much or go far. A long and punishing bear market has set the scene for a much larger counter-trend rally here. Yes, obviously caution is recommended, a bear market surprises to the downside with uncanny and unforgiving consistency.
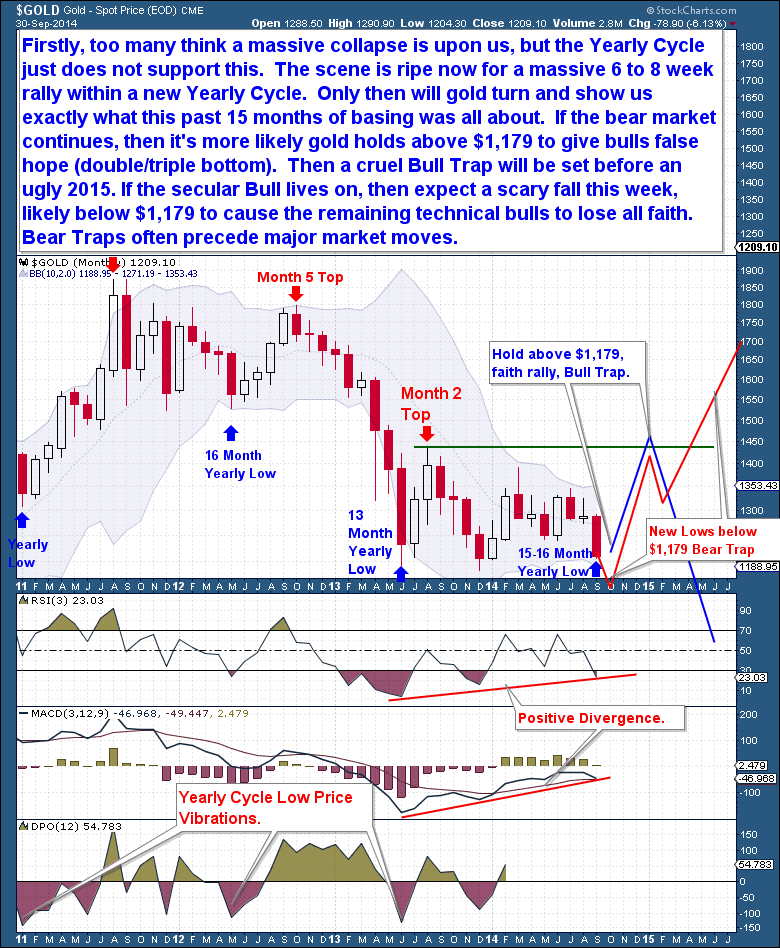
But I like the setup, because its exactly the type of contrarian environment that should support a powerful counter-trend rally. I particularly like the fact that gold dropped below the June 2013 lows, that technical break-down automatically turned a large percentage of technical traders against the sector. In past reports, over a month ago (see chart below from public post Gold Will Surprise in More Ways Than One, I had stated that losing the June 2013 Lows was potentially the more bullish scenario, because that development offered up the potential for a significant bear trap. I have found that many bear markets end on such technical break-downs, as the break-down encourages so many more speculators to join the foray on the short side. Its akin to that final vertical spike in a bull market.
Bear traps often proceed major market moves Early Oct chart.
As a result of seeing fresh 4 year lows, the COT report shows that a significant gold short position has amassed. Were at the level (near record) where Cycle Lows form, mainly because the position again gold is such that little further upside will set off a massive short squeeze. I always try to end with a balanced viewpoint, which is why I will remind everyone that the bear market demands respect. But its been all down for so long and its time for the Cycle to reverse. Form what I can tell, a new Investor and Yearly Cycle rally is now in progress, this outlook I favor with much more confidence this week.
The Financial Tap publishes two member reports per week, a weekly premium report and a midweek market update report. The reports cover the movements and trading opportunities of the Gold, S&P, Oil, $USD, US Bonds, and Natural Gas Cycles. Along with these reports, members enjoy access to two different portfolios and trade alerts. Both portfolios trade on varying time-frames (from days, weeks, to months), there is a portfolio to suit all member preferences.
View the Site: The Financial Tap
Youre just 1 minute away from profitable trades! please visit: http://thefinancialtap.com/landing/try#


