-- Published: Thursday, 20 November 2014 | Print | Disqus
Charts created using Omega TradeStation 2000i. Chart data supplied by Dial Data
There is a sense of déjà vu in the current stock market. Parabolic moves such as the current one are not that common. Yet over the past twenty years, the market is working on its third parabolic move. The refrain no doubt will be that this time is different. That refrain has been used repeatedly in the past to justify parabolic moves. But in the end it is the same. The market rises sharply then crashes.
The current parabolic up move has been steeper and longer than the previous two moves. The current up move got underway from the depths of the 2008 financial crash following the bailout of some of the biggest banks in the world, slashing interest rates effectively to zero and instituting QE. While the pundits praise the recovery the reality is that growth has been narrowly based benefitting primarily the well-off (the 1%) and the professional classes while the rest of the economy has languished in unemployment, and low paying Wal-Mart type jobs or as one pundit pointed out the country has become a nation of waiters and bartenders. Growth in employment has been primarily part-time jobs with few if any benefits.
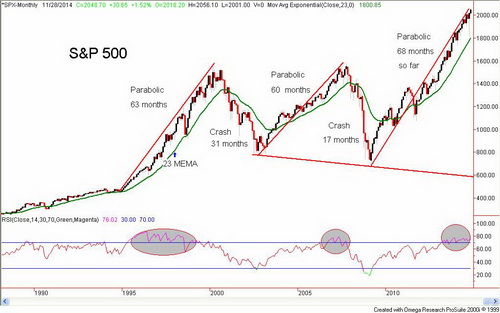
But the stock market has benefited as it did from 1995-2000 and 2002-2007 earlier periods of low interest rates and rapidly growing money supply as was the case 1995-2000 and a sea of liquidity plus low interest rates as was seen from 2002-2007. While the current run has gone on longer 68 months to date vs. 63 months 1995-2000 and 60 months 2002-2007, the gain has thus far fallen short of 1995-2000. To date the market as represented by the S&P 500 is up 208% vs. 251% from 1995-2000 and only 105% from 2002-2007. Once again, a period of ultra-low interest rates has characterized the period along with QE 1, 2 and 3.
More important is what happened once the market stopped going up. The 2000-2002 high tech/internet bear saw the S&P 500 fall 50%. The financial crash of 2007-2009 was worse as the S&P 500 fell 58%. The 2000-2002 collapse was drawn out taking 31 months to complete. The 2007-2009 crash was all over in 17 months.
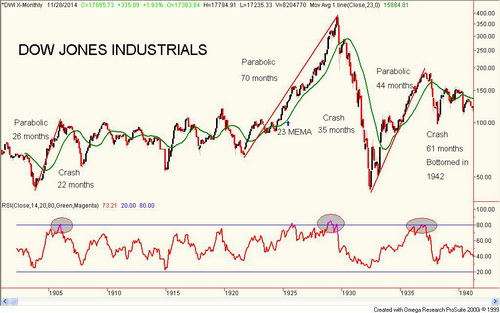
Market crashes of 50% or more dont happen very often. Yet in the space of roughly eight years, there were two of them. In looking back over the history of the Dow Jones Industrials (DJI) there were only three others that I could find and they all happened in the early part of the previous century. From November 1903 to January 1906, a period of 44 months the DJI rose 144%. What followed was the panic of 1907 when the stock market fell 49% over a period of 22 months from January 1906 to November 1907. The granddaddy of them all was the Roaring Twenties bull market that got underway in October 1923 and topped out in August 1929 (actual date was September 3, 1929) a period of 70 months. The gain was 349%. What followed was the Great Depression crash and the DJI collapsed 89% over the next 35 months bottoming in July 1932.
The market did recover from the great crash of 1929-1932 and from July 1932 to the top in March 1937 the market was up 382% a run that actually surpassed the Roaring Twenties. Nonetheless it remained well off the highs of 1929. The highs of 1929 were not taken out until 1954. What followed was another devastating crash. First, there was the panic of 1937 that bottomed in March 1938 as the DJI fell 50%. The recovery over the next year was feeble and as war broke out in 1939/1940, the market started a secondary decline. The bottom didnt come until April 1942 and by that time, the market had lost 53% from the highs of March 1937.
There have been other sharp up moves in the stock markets but few as impressive as the 1923-1929 run and the 1932-1937 run. Then again, they werent followed by a devastating 50% market collapse either. The 1982-1987 bull market did see the DJI gain 256% and it lasted 60 months. But the subsequent crash was merely a flash as it lasted only about two months and lost 36%.
Argumentively one could say that the up move from March 2009 has not just been straight up with few interruptions. A parabolic move never is just straight up. The correction that occurred April 2011 to October 2011 did see the DJI fall about 17%. To date that has been the only serious correction since the bull got underway in March 2009. But generally this could be considered a parabolic move or as some would call a bubble market. In a bubble market greed and euphoria is high and complacency is low. In other words this time its different.
The market pundits call it climbing a wall of worry. That may be right but then they dont normally last this long. At 68 months, this bull has run almost as long as the 1923-1929 market. And everyone knows how that one ended. The current rise has also been the steepest. By comparison, the 2002-2007 bull appears as almost a gentle rise. Still the RSI indicator has not been in overbought territory as long as it was from 1995-2000. That period saw the RSI remain almost exclusively above 70 the entire time. Todays market has seen the RSI remain above 70 longer than it did during any of the 1903-1907, 1923-1929 and 1932-1937 rises.
Charts created using Omega TradeStation 2000i. Chart data supplied by Dial Data
An overbought RSI is not the only negative sign. Currently the S&P 500 is 13.7% above the 23 month exponential MA. That is not as bad as it was in 2000 when the S&P 500 was more than 18% over the 23 month MA. But it is higher than the 10% over at the 2007 peak. Those overages are actually pikers. At the heights in 1906, the DJI was 41.6% over the 23 EMA. In 1929, the peak was 37.7% over and in 1937 the top was 20.6% over the 23 month EMA. By comparison, todays market is a gentle rise.
While the US stock markets have been making new highs for the most part no one else is. European stock markets remain below their highs as does most Asian markets. The small cap Russell 2000 remains below its all-time high. Markets should be making highs together or at least confirming each other. Only the large cap US markets appear to be making weekly and daily new highs. This is a divergence that needs to be resolved.
There should also be concern about the growing spread between high yield bonds (junk) and US Treasuries. This spread has been widening of late although it is still nowhere near where it was during the 2008 financial crash nor is it at levels that should raise alarms. Nonetheless, the widening spread is to be at least noted. As the stock markets were making their highs in 2007, the yield spread between high yield and US Treasuries had already begun to widen. Once again, the stock markets are making new highs as the yield spread widens. During the 2011 correction, the yield spread widened as the market fell so the two were in tandem.
Could the stock market really take off in a blow off? The simple answer is yes it could. But it may not do that until at least a correction of some magnitude completes. It may only be a 10% pullback but as long as 1,800 holds for the S&P 500 then the market can remain in a bull mode. Even a break under 1,800 would have to be confirmed. But given the length of time that this market has been moving higher in a parabolic mode and warning signs flashing of impending danger this may not be the time to be re-loading looking for another big upside move.
It has been unusual that there has been three parabolic moves to the upside over the past twenty years. Two of them ended badly. Odds are that this one may not end so well either. The bottom of that channel is currently down around 600. That is a long way from todays level.
Copyright 2014 All rights reserved David Chapman
www.davidchapman.com
| Digg This Article
-- Published: Thursday, 20 November 2014 | E-Mail | Print | Source: GoldSeek.com


