-- Published: Tuesday, 16 December 2014 | Print | Disqus
By Steve St. Angelo, SRSrocco Report
The Great Bakken Oil Field suffered a setback in October as production declined 1,598 barrels per day compared to the previous month. The industry blames the decline on drillers scaling back on production due to the new flaring mandate that requires companies to capture natural gas as well as the rapid fall in oil prices.
While these factors will impact future production, there are additional red flags warning that the Bakken may be already heading for BIG TROUBLE. And nothing spells trouble more than the huge loss of Bakken oil production due to its high decline rate.
Each month the EIA U.S. Energy Information Agency puts out a Productivity Report on the different shale oil and gas fields. The EIAs first Productivity Report was published in October 2013. If we compare the rate of change in the Bakken from the first issued report to the most recently published data, the decline in monthly production continues to increase:
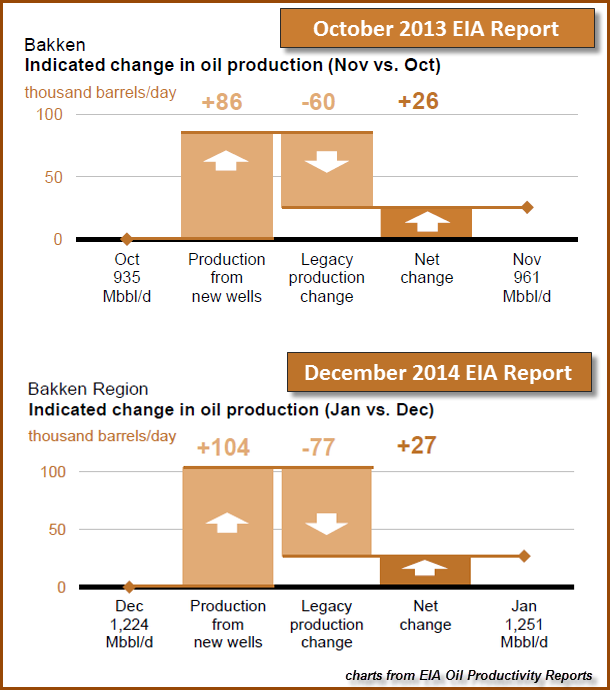
According to the October 2013 Report (Top), the Bakken added 86,000 barrels of day (bd) of production from new wells, while suffering a loss of 60,000 bd, netting a gain of 24,000 bd for November. When the EIA publishes these reports, they are estimating the production and decline rate for the following month.
On the bottom of the chart, the EIA forecasts the Bakken will produce 104,000 bd of new production in January with a loss of 77,000 bd, netting an increase of 27,000 bd for the month. As we can see, the Bakken monthly decline rate has increased from 60,000 bd in November 2013, to an estimated 77, 000 bd in January 2014.
Basically, the Bakken now has to produce at least 77,000 barrels a day of new production each month just to stay flat. This is up 17,000 bd or 28% in just a little more than a year. So, the EIA believes the Bakken will continue to grow its oil supply in January by adding a net 27,000 bd of production. However, there is good evidence that production at the Bakken may actually decline rather than increase.
Here was the EIAs forecast for the Bakkens October production:
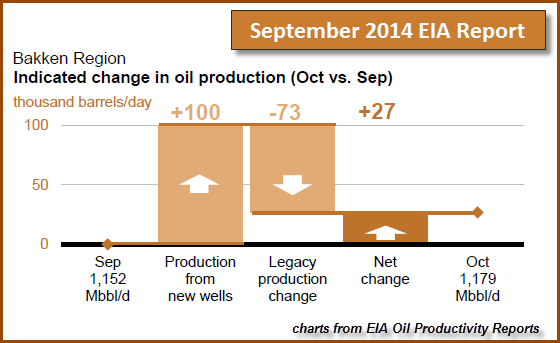
In the EIAs September 2014 Report, they stated the Bakken would bring on 100,000 bd of new production, lose 73,000 bd due to the decline rate , netting 27,000 bd for October. Unfortunately for the EIA, the North Dakota Industrial Commission just released their statistics showing the Bakken production was down 1,598 barrels per day to 1,118,010 bd.
So, the EIA forecasted October incorrectly. For sake of clarity, the figure of 1,179 Mbbl/d for October shown on the bottom right hand of the EIA chart equals 1,179,000 barrels per day, which also includes Montanas portion of the Bakken. The EIA is publishing total Bakken production in both North Dakota and Montana, while North Dakota Industrial Commission only reports production for the state.
Regardless, Bakken oil production declined in October and chances are, the EIA may have overestimated production in the following months. Ron Paterson who runs the Peakoilbarrel.com website, does a great job updating U.S. and global oil production figures. Here is his graph comparing the EIAs estimated production until January versus North Dakotas actual production:

As you can see, the EIA forecasts (GREY) a continued increased of Bakken oil production, while North Dakota Industrial Commission shows a drop in Bakken (BLUE) and total state production (ORANGE) in October. While the majority of North Dakota oil production comes from the Bakken, a small percentage is produced in other parts of the state outside the Bakken oil field.
You will also notice that declines have taken place during the winter months due to harsh conditions. However, the Bakken may be facing BIGGER PROBLEMS than frigid winter conditions. In Patersons recent article, Bakken Sweet Spots Are Petering Out:
The Bakken, at least through the September North Dakota Industrial Commission production report, has given no real indication that the Bakken is even close to peaking. But a closer look at the data makes me believe that is all about to change.
The NDIC issues a Daily Activity Report where they list permits issued as well as wells completed and wells released from the tight hole confidential list. These reports usually, but not always, also give the number of barrels of oil per day and barrels of water per day for the first 24 hours of production. I have gone through every day, back to November 1st, 2013 and collected the data on every well listed that gives production numbers and copied that data to Excel. In that one year and three weeks I have gathered the data form every one of the 2,171 wells that give production numbers. Sorting these wells by well number, which is the original permit number, gives some startling results:
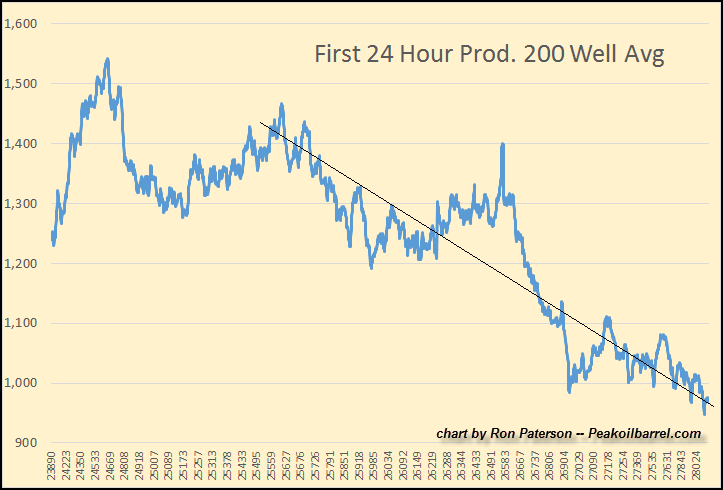
Basically, Ron plotted North Dakota Bakkens new wells first 24 hour oil production by permit number. Each well has a permit number and as new wells come online the permit number increases. So, comparing the older permit number wells to the newer ones, Ron believes the newer wells are not producing as much (in the first 24 hours) as did wells a year ago.
There is some debate to why this is the case, and if you go to the article linked above, you can read the interesting comments discussing this issue. Anyhow, the Bakken oil field contains a limited number of Sweet Spots, and when they run out, production will decline regardless of oil prices.
DECLINE RATES: Another Nail In the Coffin for Bakken & Eagle Ford Shale Oil Production
As I mentioned above, the Bakken continues to suffer from an ever-increasing loss of oil production due to high decline rates. In my first article on the subject, The Coming Bust Of The Great Bakken Oil Field, I published the following chart:
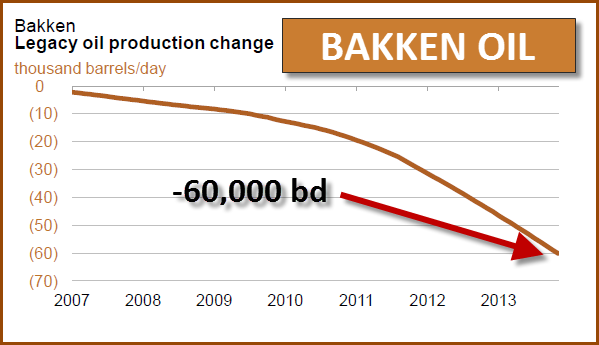
According to the EIAs figures, the Bakkens monthly decline rate didnt started to increase until the end of 2009 when it went over 10,000 barrels per day. Just to make sure I dont confuse any readers, the Legacy oil production change shown in the chart above and in the EIAs Productivity Reports are estimated on a monthly basis.
The chart came from their first report published on October 2013 showing the Bakken would lose 60,000 barrels per day of production in November 2013. Again, these EIA reports are estimated production and decline rate figures for the following month.
Now, if you think the Bakken losing 77,000 bd of production in January (shown at the top of the article) is high, take a look at rate of chance in the Eagle Ford shale oil field:

In a little more than a year, the Eagle Ford monthly loss of oil production increased from 81,000 bd to a staggering 131,000 bd. This is an amazing 62% loss of monthly oil production and the only way the Eagle Ford can grow supply is by seriously increasing production from new wells.
As we can see from the chart above, the Eagle Ford only had to add 105,000 bd of new production in November 2013 to add a net of 24,000 bd of growth. However, it must now add 160,000 bd of new production in January just to show a growth of 30,000 bd. It will be interesting to see if the EIA has overestimated January production at the Eagle Ford as it did with the Bakken.
Unfortunately, at some point the companies drilling and producing oil in the Bakken and Eagle Ford will be unable to add enough new production to offset the declines. I put together a chart showing the total loss of monthly oil production from these two fields combined.

The Bakken and Eagle Ford lost a total of 141,000 bd in November 2013, but in January are foretasted to lose a stunning 208,000 bd of production. While its true that the EIA is also estimating monthly production losses as well as new supply, I believe their predictions on the decline rates are more accurate than new production.
This means, a total 208,000 bd monthly loss of oil production from the Bakken and Eagle Ford amount to a staggering annual loss of 2,496,000 bd:
12 months X -208,000 bd = -2,496,000 bd
I know all these figures might be a little confusing to some readers, but the simple fact of it all is this
the loss of oil production due to high decline rates will soon make it impossible for the Bakken or Eagle Ford to continue growing production.
In a nutshell, these two fields are now losing nearly 2.5 million barrels a day of production each year. Thats a hell of a lot of production to offset.
Furthermore, the falling oil price will also make a BAD SITUATION WORSE for the companies drilling and extracting shale in these two fields. I also found this comment from a reader on Rons Peakoilbarrel blog quite interesting:
mbnewtrain says:
November 23, 2014 at 1:50 am
I just returned from North Dakota a week ago. Guy I worked with at an company that supplies some of drillers and support companies has a friend that lives in Williston, but sometimes works in Fargo (where I work on assignment). Williston guy said oil cos. dont have help wanted advertisements out anymore, and the number of trucks bringing supplies to Bakken has fallen off a lot. The locals in Bakken formation area are definitely not seeing population growth or increased business activity. Many there are worried that this is the start of the boom to bust cycle.
Of course this is anecdotal evidence, but it truly seems as if the mood at the Bakken is changing. I believe we will soon start to hear news in the media stating that economic activity, hiring and equipment sales will be peaking and heading south.
Once the Great Bakken and Eagle Ford Fields head into terminal decline, the GREAT ILLUSION of prosperity in the United States will be over. This will have severe consequences for the U.S. Dollar and Treasury Market.
Investors who see the WRITING ON THE WALL will make sure they have protected their wealth in hard assets such as gold and silver before the Shale Oil Dominoes fall.
Please check back for new articles and updates at the SRSrocco Report. You can also follow us at Twitter below:

| Digg This Article
-- Published: Tuesday, 16 December 2014 | E-Mail | Print | Source: GoldSeek.com


