

The glory days of the Great Bakken Oil Field are soon coming to an end. With the collapse of the price of West Texas Intermediate Crude, shale oil production from the Bakken is in big trouble. How much trouble? Well, if we understand how much of its production growth came in 2014, the situation is dire indeed.
Ironically, Americans have been lulled into believing that the United States is heading towards energy independence, while the opposite is the case. Not only has the Bakken given us a false sense of energy security, when it finally peaks it will decline in stunning rapid fashion. This is what the media, oil industry and public fail to realize.
The rate of Bakken oil production growth over the past six years was quite impressive. However, it did so based on certain requirements:
1) High oil prices
2) Low interest financing
3) Massive drilling program
Without these three conditions, the majority of oil in the Bakken would have remained in the ground. According to the EIAs January Drilling Productivity Report, the Bakken is estimated to produce a record 1.28 million barrels a day (mbd) in January. Thats a lot of oil, but actually not that much in the whole scheme of things.
According to an interesting statistic from Bakkenboomorbust.com, what North Dakota produces in one day, 1,187,206 barrels of oil (Nov. 2014), the U.S. burns in 81 minutes, and the world in 20 minutes. So, while the Bakken has provided a much needed domestic supply of oil, its still a drop in the bucket.
(Note: the 1,187,206 barrels of oil per day is for the entire state of North Dakota including conventional and unconventional oil outside the Bakken)
Furthermore, the Bakken oil supply is not sustainable especially at the current low oil price. This is especially true if we look at the following chart. Rune Likvern of FrationalFlow, posted this chart in his most recent article:

This chart shows the increase of North Dakota (ND) Bakken oil production from 2008 to October 2014. I took his chart and added some annotations below:

Each color in the chart represents new production in a given year. As you can see, 50% of ND Bakken oil production growth came in 2014 (actually, from Jan-Oct 2014). Which means, if no new wells were drilled in 2014, total oil production from the ND Bakken would be half or 550,000 barrels per day.
Also, two important additional factors to notice from the chart is the INCREASED rate of production growth and slope of decline in later years. In 2008, 2009 and 2010, the increase of oil production and level of decline were relatively shallow. However, in 2011 this picked up considerably and by 2014, its experiencing the sharpest angles ever.
If you look at the production in 2014 (Grey color), you will see the overall production line and decline curves are steeper than ever. Basically, the companies drilling in the Bakken are drilling faster and faster just to keep production growing. This drilling frenzy may have continued for a period longer if oil prices remained high, but with the collapse of West Texas Intermediate below $50 a barrel (and possibly lower to $30), production at the Bakken is in real trouble.

Moreover, the companies producing oil in the Bakken pay between $10-$15 per barrel for transportation, which cuts the market price even further.
Rune also put together this chart showing the estimated FREE CASH FLOW from the companies drilling and producing oil in the Bakken. The BLACK BARS represent estimated monthly increases or decreases in total free cash flow in the Bakken, while the RED AREA shows the estimated cumulative free cash flow.
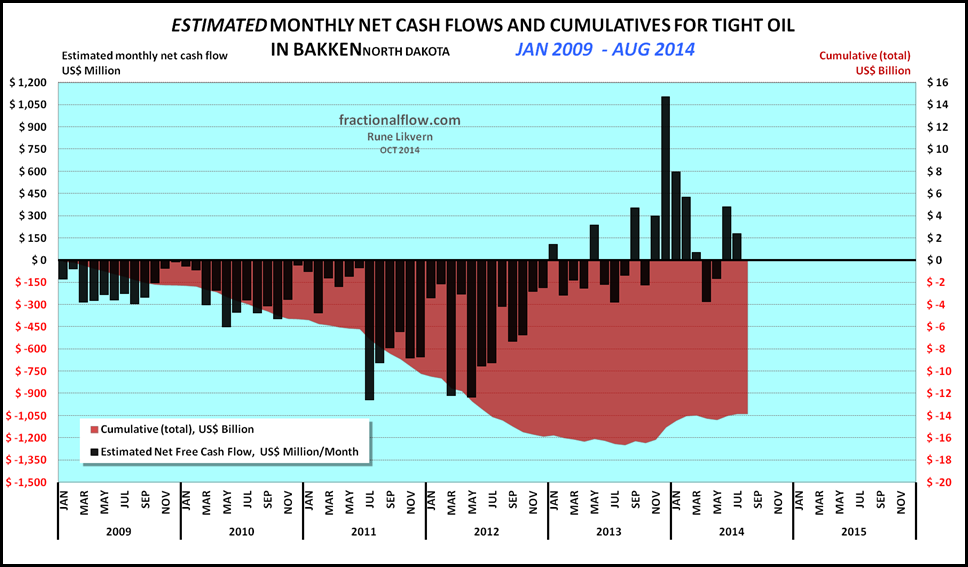
Cumulative free cash flow continued to decline in the RED from 2009 to 2012, then it bottomed and started to reverse in 2014. This was due to large monthly positive free cash flows at the end of 2013 and beginning of 2014. Unfortunately, this was during the time when the price of oil was north of $90-100 a barrel.
I would imagine the cumulative free cash flow will continue to head into record negative territory if the price of oil remains low. This will considerably impact oil production in the Bakken this year and we are already seeing signs of trouble.
According to the most recent data put out by the North Dakota Department of Natural Resources, Bakken oil production has leveled off substantially in the past several months:
North Dakota Bakken Oil Production (barrels per day = bd)
JUN 2013 = 759,226 bd
NOV 2013 = 912,946 bd
INCREASE = +153,720 bd
JUN 2014 = 1,027,841 bd
NOV 2014 = 1,123,305 bd
INCREASE = +95,464 bd
The increase in ND Bakken oil production from JUN-NOV 2014 was only 95,464 bd, compared to the 153,720 bd from JUN-NOV 2013. And its even worse than that if we compare the past three months.
ND Bakken oil production from SEP-NOV 2014 increased a lousy 3,698 bd in two months, while production during the same period last year jumped 43,591 bd more than ten times the rate. Folks, the Bakken may be showing signs of peaking already.
We must remember, the Bakken has over 500 wells waiting to be fracked, so the day of reckoning will be postponed a bit as the industry works through this backlog. Although, the Bakken Bust may already be underway as the once great influx of people into North Dakota has peaked and in decline.
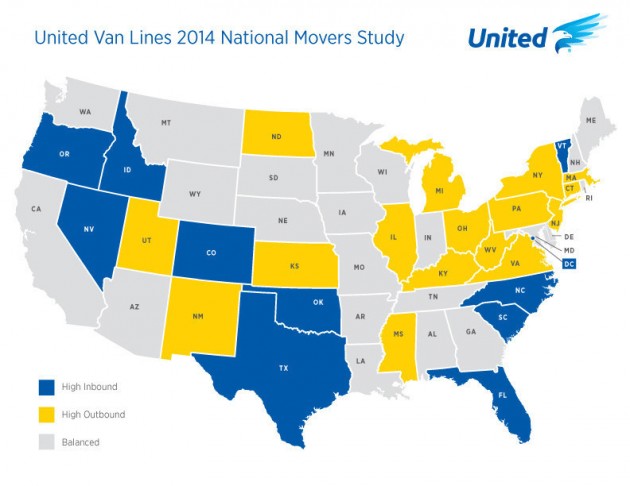
According to the United Van Lines 2014 National Movers Survey, North Dakota has the 5th highest outbound migration rate 61 percent in the country.
I believe the peak and decline of U.S. Shale Oil Production will be the final straw that breaks the back of the U.S. economy. Of course there are over a dozen black swans flying around the world currently that could push the entire global financial and economic system over the cliff, but the end of the Shale Oil Miracle will certainly destroy the value of paper assets much greater than American realize.
This is why I highly recommend investors purchase physical gold and silver. When the collapse finally arrives, these two precious metals will be some of the safest assets to own and their values may rise to levels most thought unimaginable.
Please check back for new articles and updates at the SRSrocco Report. You can also follow us at Twitter below:
![]()


