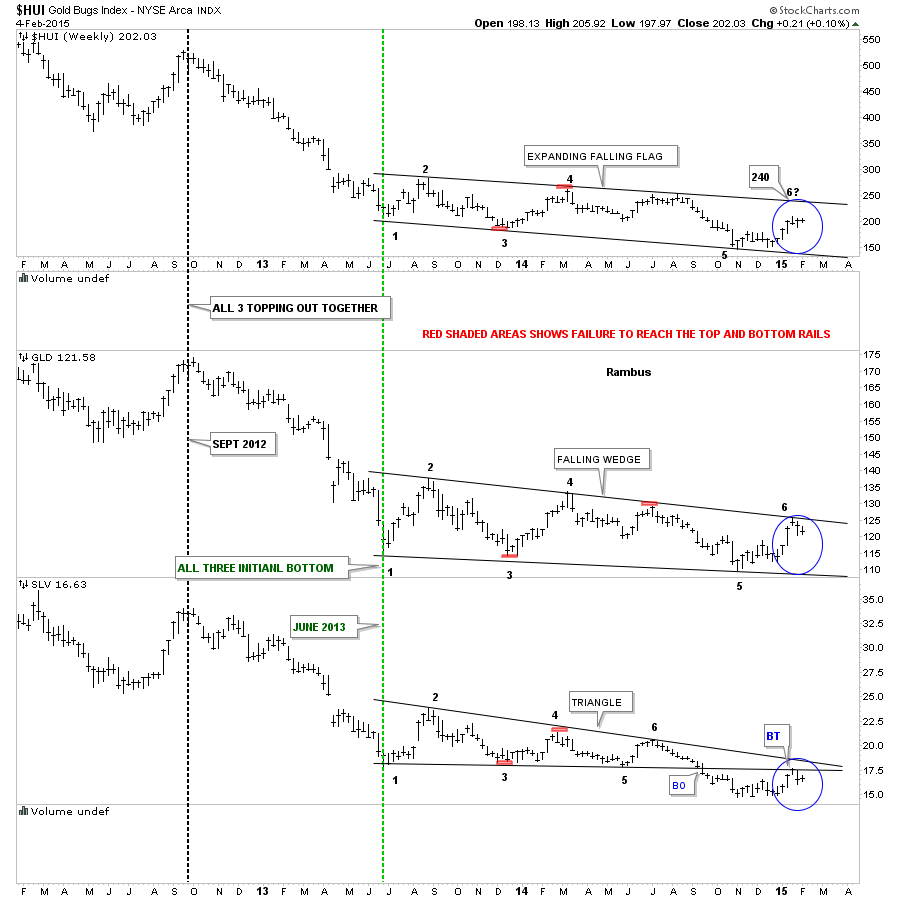
Tonight I would like to look at the precious metals complex and see how things are moving along. Consolidating would be an understatement. The PM complex has been in a very large consolidation pattern going all the way back to the June 2012 low where the HUI, GLD and SLV all bottomed together. From that low all three have been chopping in a falling type pattern making lower lows and lower highs. The combo chart below shows the three distinct but slightly different 18 month consolidation patterns starting at the June of 2013 low. The top chart shows the HUI that has yet to put in a 6th reversal point in its big consolidation pattern. It doesnt have to have a 6th reversal point as it already has enough but if it does the top rail would come in around the 240 area. If you look at the last four weekly bars you can see the closing price for each week are very close to each other meaning there has been very little headway being made either up or down aggravating the bulls and bears alike. Also the 18 month consolidation pattern is expanding unlike GLD which is falling and contracting and SLV which has a triangle. The GLD chart in the middle shows the price action touching the top rail completing the last reversal point number six and falling away. SLV on the bottom chart has been clearly the weakest of the three as it broke out of its triangle in September of last year. Three weeks ago SLV paid a visit to the bottom rail of its triangle as a backtest and is falling away. So we have the HUI in no mans land right now with GLD finding resistance at the top rail of its falling wedge and SLV finding resistance at the bottom rail of its triangle consolidation pattern during the backtest three weeks ago. This combo chart gives you a good overview of where were at and where weve been.
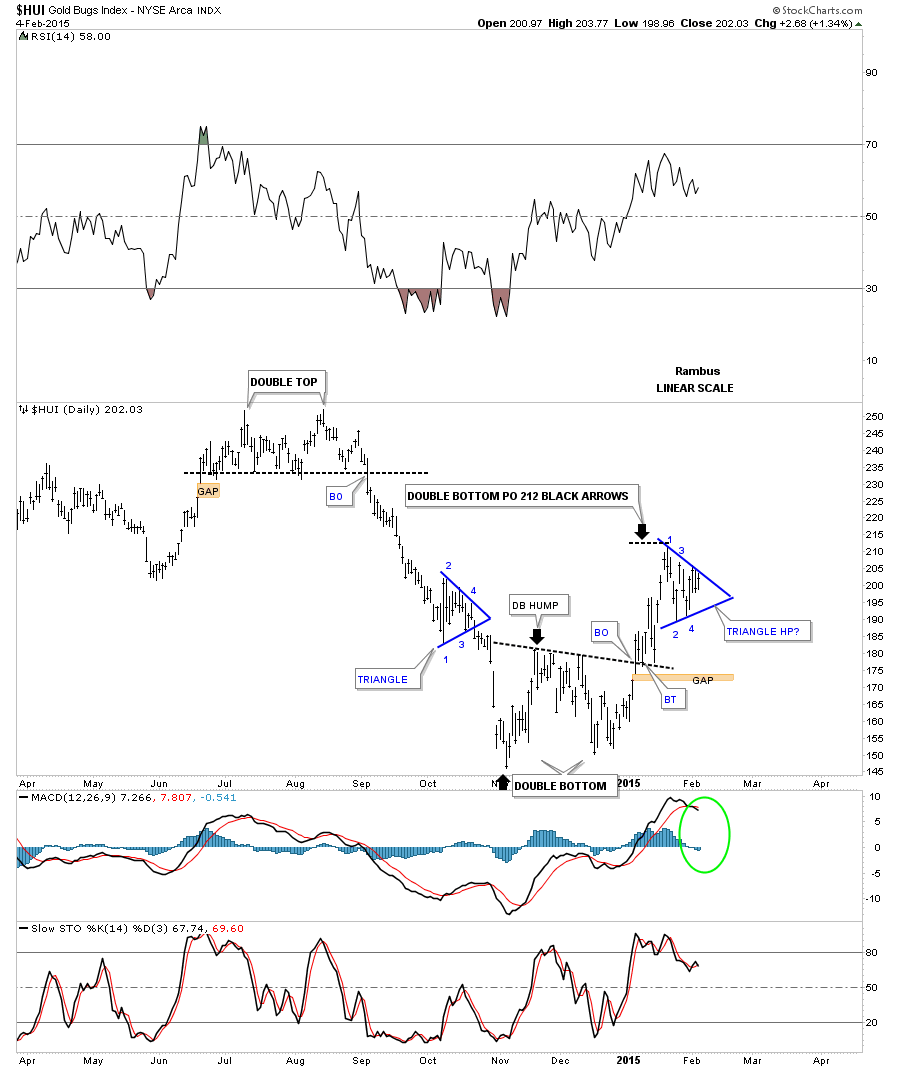
Now I would like to do an in depth report on the HUI starting with the 2 hour chart, in linear scale, and focus on what we have in place at the moment. The first chart pattern is the double bottom that started to form in November of last year with the second bottom coming in late December. Ive measured the double bottom price objective using the black arrows. Just measure the distance of the first two black arrows and add that distance to the breakout point on the double bottom which gives us a price target to 212 which the HUI has achieved. Since the first reversal point the HUI has been chopping out the blue triangle. At this point we still dont know if its going to be a consolidation pattern to the upside or a 5 point reversal triangle to the downside. If the HUI breaks out to the upside then I would have to view the blue triangle as a consolidation pattern which would be a halfway pattern. To get the price objective we would measure the distance from the breakout from the double bottom trendline to the first reversal point in the blue triangle. We then take that distance and add it to the breakout of the blue triangle which would give us a price objective up to the 238 area or the top of the falling expanding wedge I showed you on the combo chart above. If that is what the markets want to give us then well take it but first we have to see the breakout of the blue triangle.
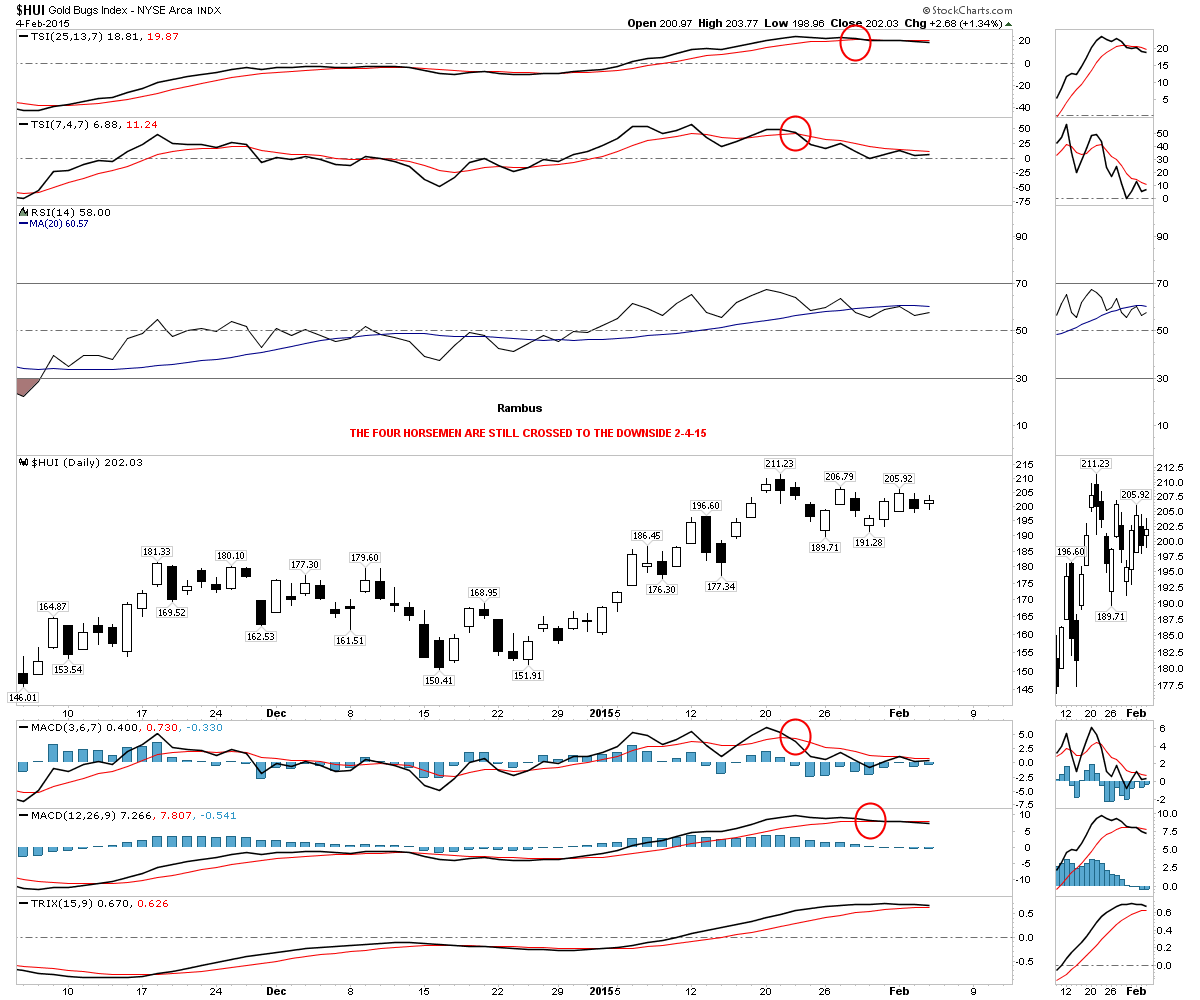
The four horsemen are still all crossed to the downside.
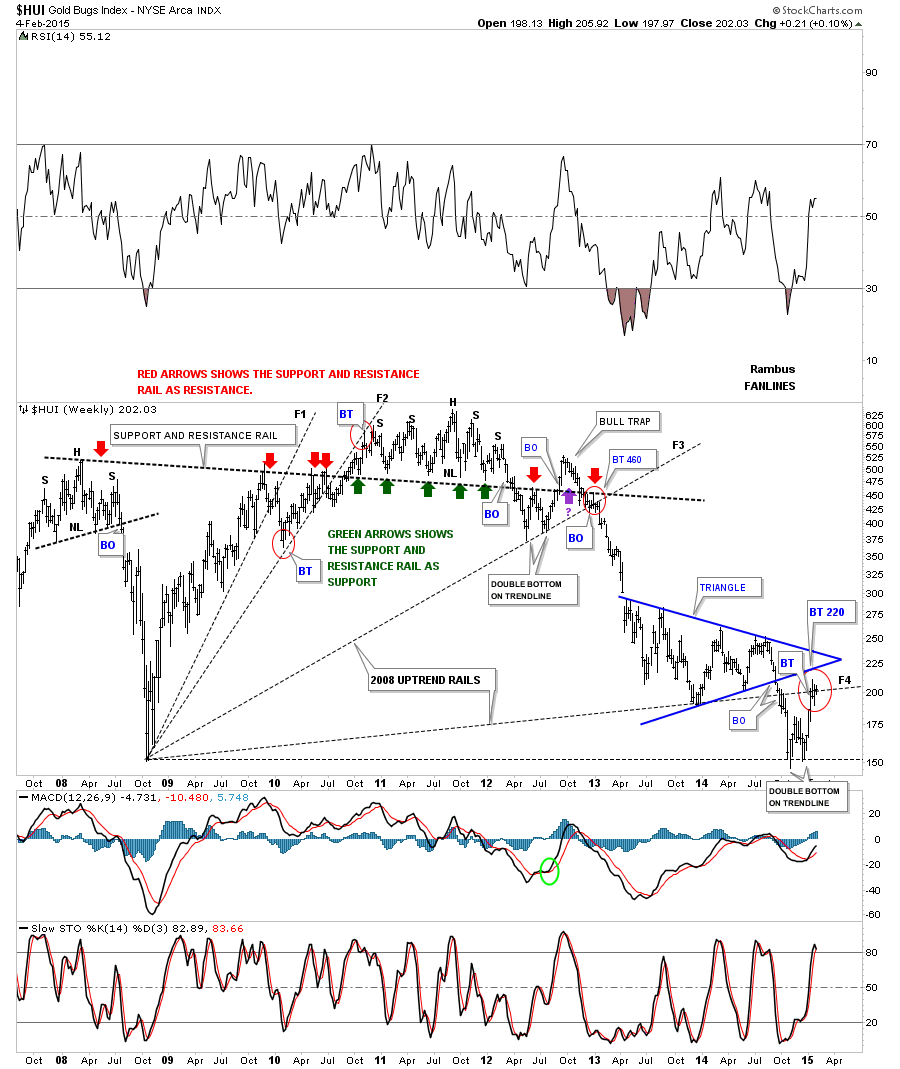
If the HUI is going to get to the 240 area then it has some overhead resistance its going to have to deal with first. Below is a weekly chart for the HUI that shows some fanlines made off the 2008 crash low. The HUI is currently testing fanline #4 with the bottom rail of the blue triangle just overhead at 220. The red circles shows where the backtests took place in the past which is common with fanlines.
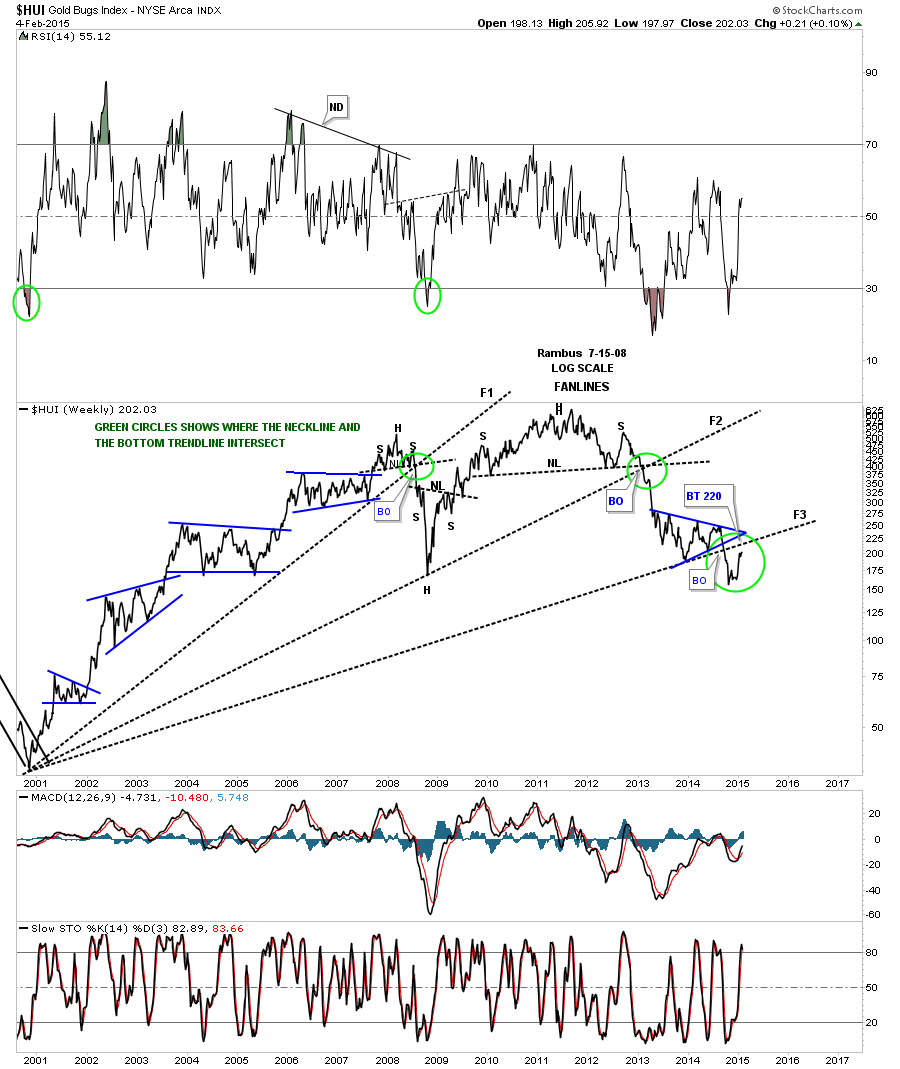
Now I would like to show you some fanlines that began at the 2000 bear market low. Fanline #1 showed up when the 2008 H&S top broke down. Fanline #2 came into play when the massive H&S top gave way in 2011. Fanline #3 gave way last September when the blue triangle broke down. A backtest to the underside of fanline #3 would come in around the 220 area, green circles.
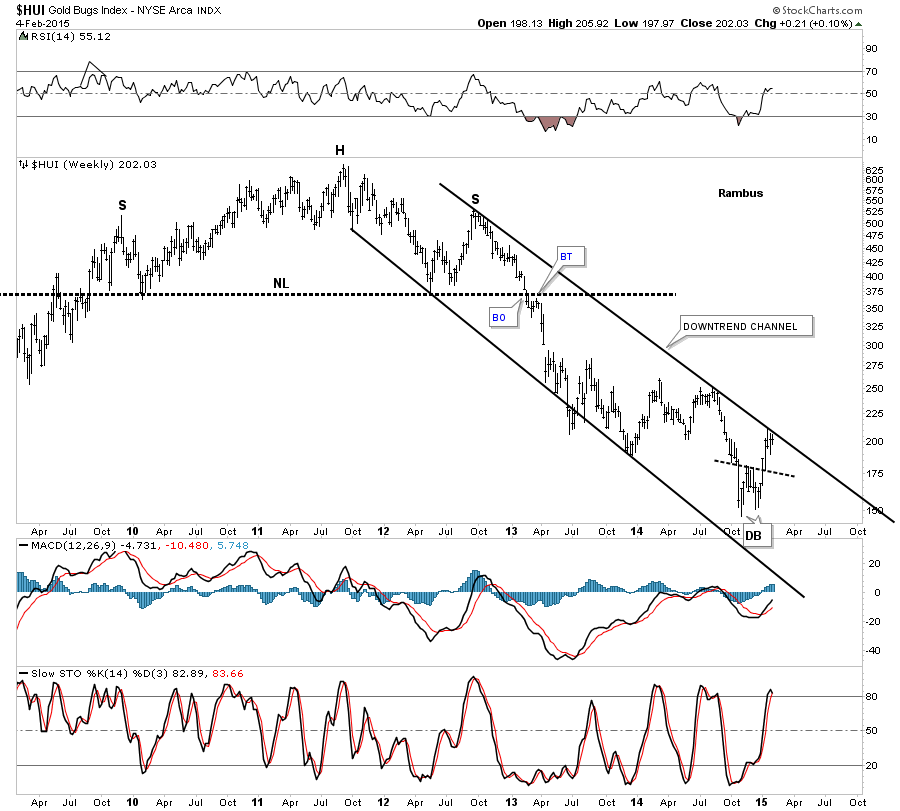
Below is another weekly chart for the HUI that shows a downtrend channel that the HUI is currently testing from below.
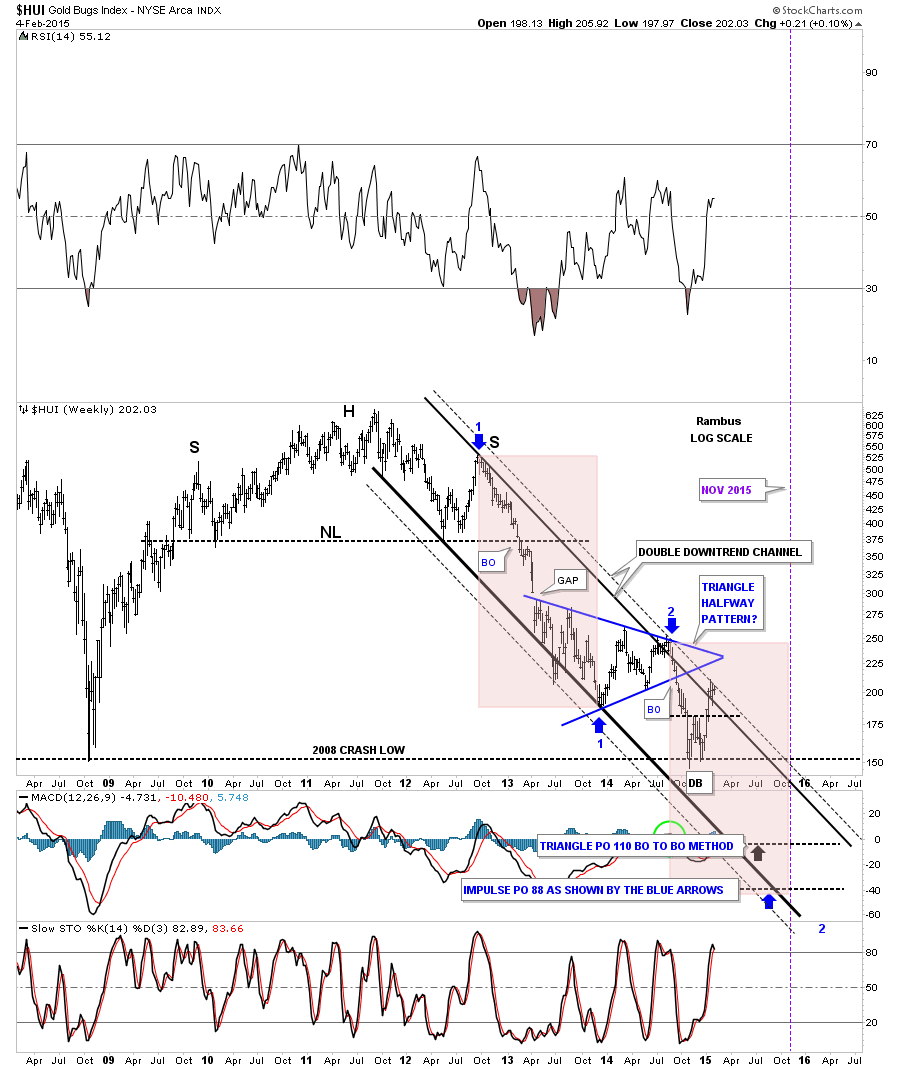
Below is a slightly different look at the downtrend channel that I originally showed you about 4 or 5 months or so ago. Its what they call a double downtrend channel where you have an outside trendline, dashed, on both sides of the main downtrend channel. As you can see the HUI is now in its third week of testing the outer black dashed trendline from below. The higher pink shaded area shows the first impulse move down in time and price. Ive added the lower pink shaded area, which is exactly the same size as the higher one, that may show us where to look for the ultimate low in November of this year.
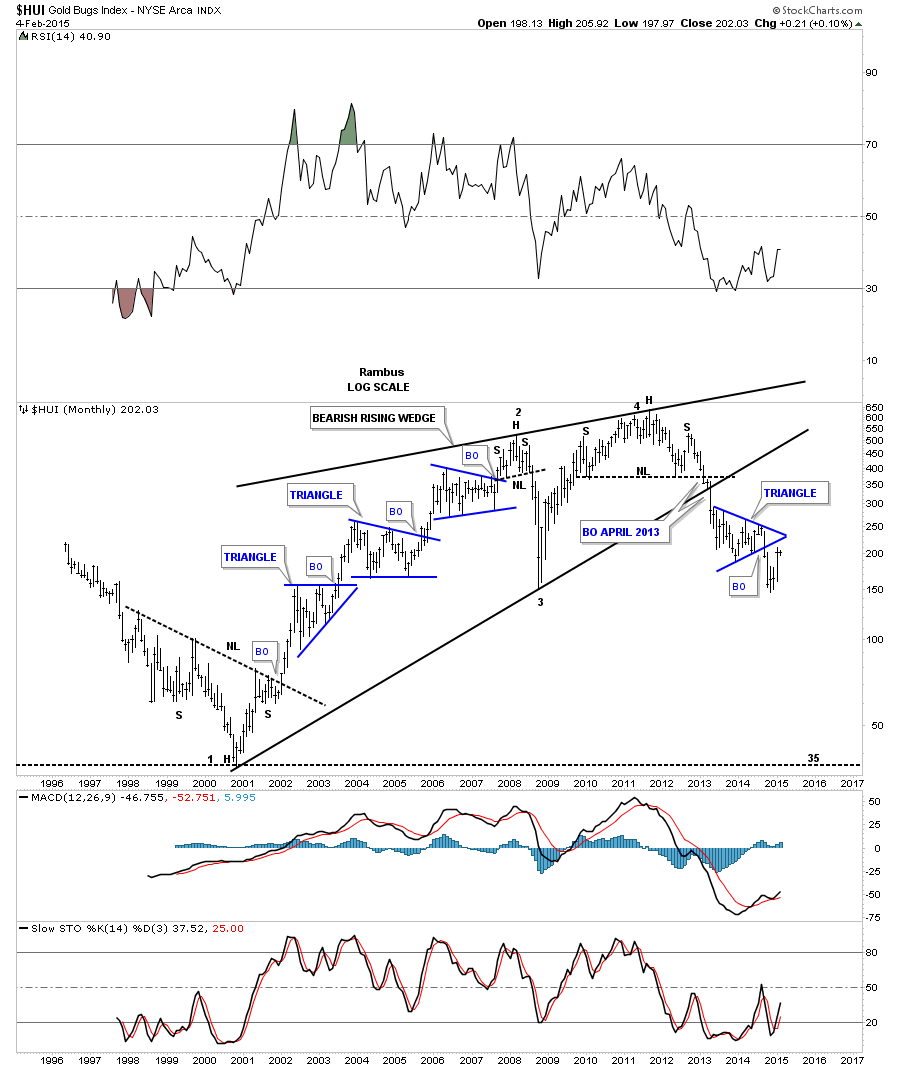
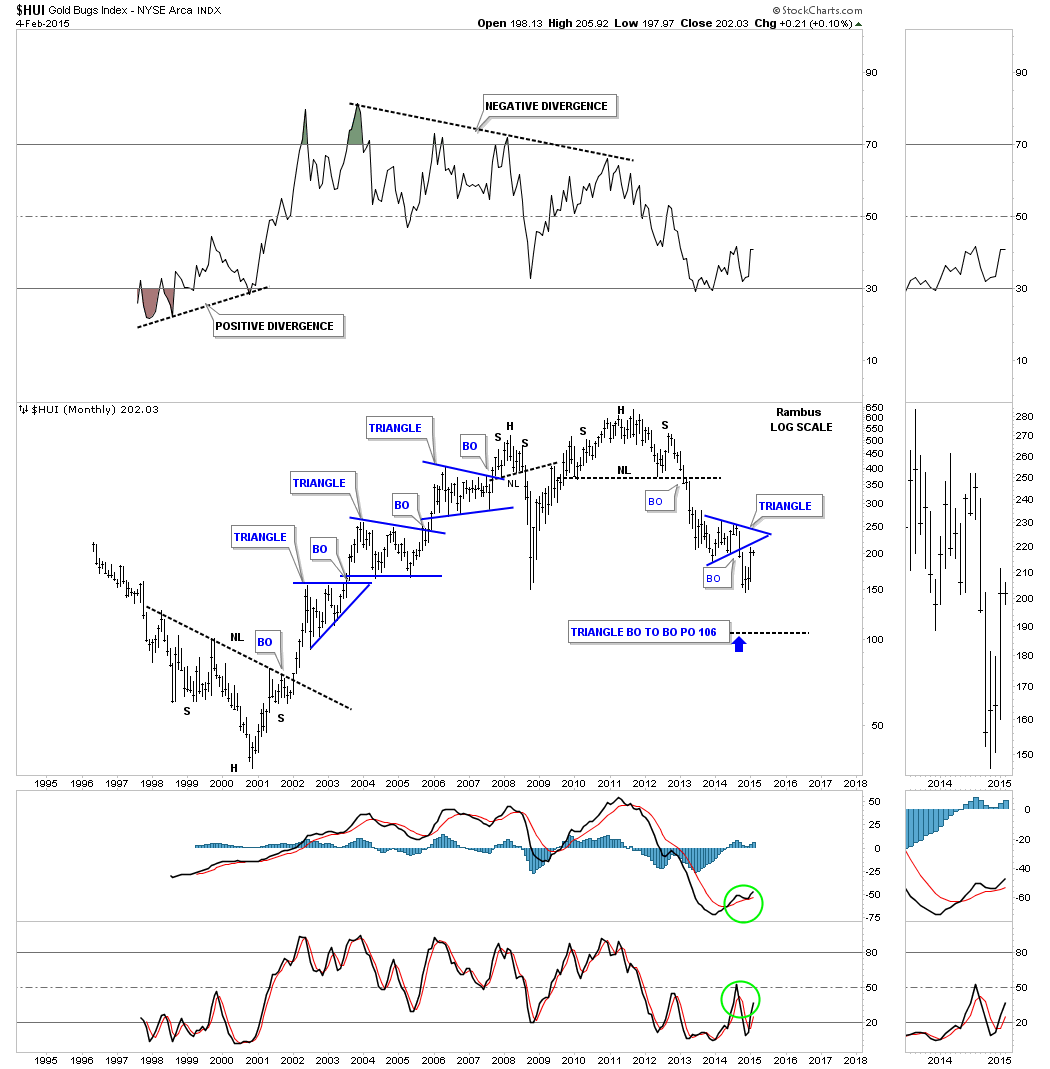
Now I would like to show you some long term charts so you can see where the HUI has been and where it may go in the future. This next chart for the HUI shows its entire history going all the way back to 1995. Note the huge bottom that formed in the late 1990s that gave the HUI the energy to have a 10 year bull market. You can see the smaller blue triangle consolidation patterns that formed during the bull market years. Next you can see the beautiful and symmetrical H&S top that reversed the 10 year bull market that has led to our most recent low. Note how much different the chart looks when you compare the left side bull market years to the right side bear market years.
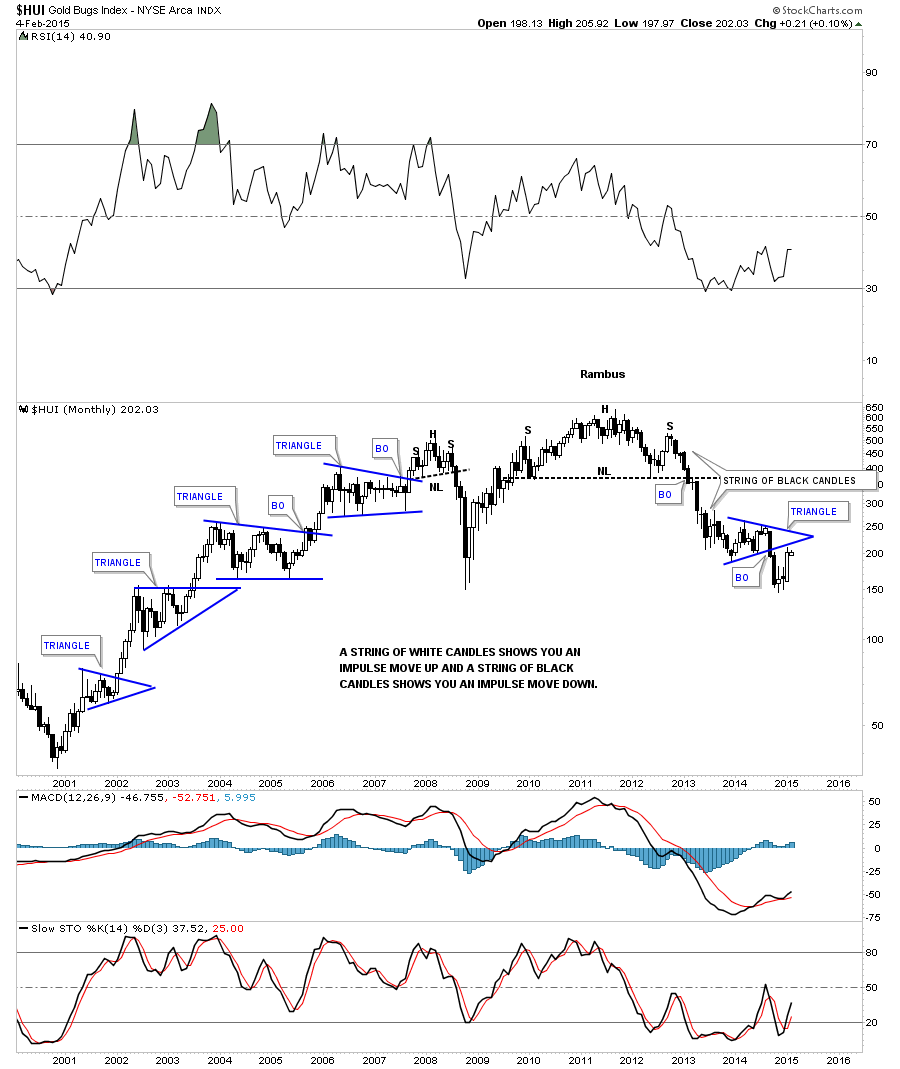
Below is a monthly candlestick chart that shows you when youre in an impulse move either up or down. When you see a string of white candle, all in a row, you know your in an impulse move up and when you see a string of black candle you know your in an impulse move down. When you see a mixture of black and white candle you know your probably in a consolidation zone as the present picture shows.
Lets look at one last long term monthly chart for the HUI that shows the bull market took on the shape of a rising wedge. Note the breakout in April of 2013 that took out the neckline of the massive H&S top and also took out the bottom rail of the rising wedge in one big long bar. Thats been almost two years ago already. There is little doubt that were in a bear market its just that these consolidation and backtesting phases can be long drawn out affairs. As you can see during the bull market years the same thing happened going up. A bull market is much easier to trade because one can hold on to your stocks if you didnt catch the exact low, which nobody does, and wait for the next leg up to get you back in the game. So we wait for further clues to help guide us in this never ending quest to slay the PM Dragon . All the best Rambus