

The U.S. Empire continues to disintegrate from within due to the worst oil productivity in the world. This collapse is due to a falling EROI Energy Returned On Invested. While this has been a long and ongoing process, the rate of decline is speeding up as the U.S. Shale Oil Industry is in deep trouble.
Unfortunately, most investors are clueless to the falling EROI and its impact on the U.S. and Global economies. The (EROI) Energy Returned On Invested is the fundamental driving force behind the worlds financial and economic system. However, you wont find one word about it from any economist, analyst or MSM talking head on CNBC, Bloomberg or Fox Business.
The basics of the EROI are easy to understand. It takes energy to produce energy. If the energy cost to produce energy is very low, then we have a HIGH EROI. This was true in the United States during the early 1930s. The U.S. oil and gas industry had an EROI of 100/1. Thus, 100 barrels of oil were produced for market from the cost of only one barrel of energy.
Then by 1970, the U.S. oil and gas EROI fell to 30/1, and at last study was about 10/1. Now, some readers may think this huge fall in the U.S. Energy EROI was due to the collapse in value of the Dollar. While this seems like a valid assumption at face value, the collapse in the Dollars value did not cause the huge decline in the U.S. energy EROI.
It just takes more energy today to produce energy especially in the United States. It took a barrel worth of energy to produce 100 U.S. oil barrels in the 1930s and today we only get 10 barrels of oil. And its even worse than that. The typical Shale Oil Well has an EROI of 5/1. No one in their right mind would produce North Dakota (ND) Bakken shale oil in the 1930s .even if the technology was available. Why would a company produce 5 barrels of oil for the cost of one barrel of energy in the ND Bakken when they could produce 100 barrels in such states such as Texas, Oklahoma and California?
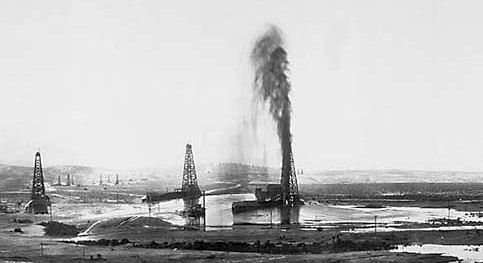
For example, the Lakeview Gusher in 1910, had an estimated EROI of 35,000 to 1. The Kern County, California Lakeview Gusher produced 18,000 barrels per day initially with a peak of 100,000 barrels per day. Unfortunately 9 million barrels of oil escaped on the ground before the well was brought under control Only half of that oil was saved for market (Wikipedia). According to Adam Brandt, Professor at the Department of Energy Resources at Standford, he said the following in a comment at the TheOilDrum:
Early oilfields had EROIs in the 100s to 1000s. For example, the Lakeview Gusher had an EROI of at least 35,000 (calculation I did with Charlie Hall for the Discovery Channel but did not publish yet).
With the easy to get oil now gone forever, the world has gone on a drilling frenzy to continue producing oil. Ron Patterson, who has the PeakOilBarrel.com website, discussed this in his recent article, Worldwide Drilling Productivity Report. I highly recommend taking a look at the article as the evidence is clear that the EROI of the worlds oil production continues to decline.
Ron, was nice enough to email me his excel data and charts in which I made some changes. I have included some of his charts below.
The United States Has The Worst Oil Productivity In The World
This is the chart that should wake up the LIVING DEAD. As we can see, the U.S. has the lowest oil production to drilling rig ratio on the planet. Using Rons data taken from the EIA U.S. Energy Information Agency website, the U.S. produced an average of 4,577 barrels a day (bd) per drilling rig compared to nearly 60,000 bd for the Middle East:
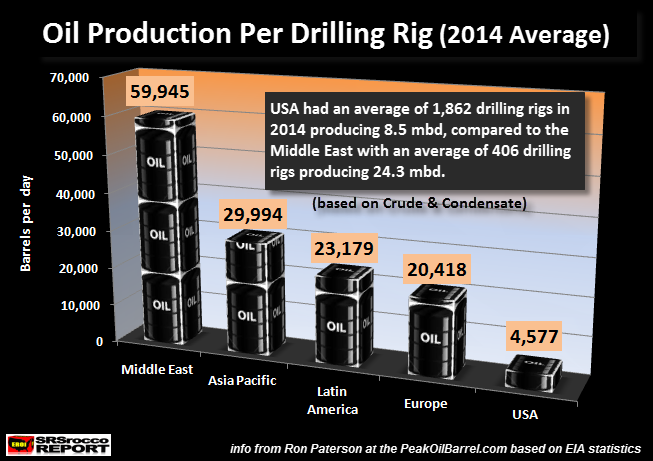
(Note: Oil production quoted as Crude & Condensate production)
The United States oil industry is 13 times LESS EFFICIENT in producing oil than the Middle East (59,945 bd vs 4,577 bd), 4.5 times less efficient than Europe (20,418 bd), 5 times less efficient than Latin America (23,179 bd) and 6.5 times worse than the Asia-Pacific region (29,994 bd).
Amazingly, the entire Middle East had an average of 406 drilling rigs in 2014, while producing an average of 24. 5 million barrels per day (mbd) of oil. Compare this to the United States that had an average of 1,862 drilling rigs producing an average of 8.5 mbd of oil in 2014. The U.S. had nearly 5 times the number of drilling rigs than the Middle East, but produced a third of Middle East oil production.
Now, these drilling rig figures are Total Drilling Rig Counts, which includes those that are drilling for natural gas as well as oil. Even though the U.S. has a percentage of its rigs drilling for natural gas, this is also true for other regions in the world. If I was to remove the number of gas drilling rigs, it wouldnt change the lousy oil productivity of the United States all that much.
According to Baker Hughes data, the U.S. had 1422 rigs drilling for oil in January 2014, compared to 358 for gas. If we take the 1422 oil drilling rigs and divide by the 8.0 mbd of oil production in January, we get a 5,626 barrels per day for each drilling rig. This isnt much of an improvement over the 4,577 bd average in 2014 using the total average rig count of 1862 in 2014.
When I say it wasnt much of an improvement, it was a gain of 1,000+ barrels per drilling rig when we only use oil rig data. However, comparing this to other regions in the world, it didnt change the overall percentage difference all that much.
Entire World Suffering From Falling EROI: Oil Productivity Declines Across The Globe
Even though the United States has the worst oil productivity on the planet, all regions in the world are suffering from a falling EROI Energy Returned On Invested. This is shown in the next several charts (courtesy of Ron Patterson). The Middle East may still be the most efficient oil producer in the world, but as we can see from the chart below, its oil production per rig is down considerably since 2000:
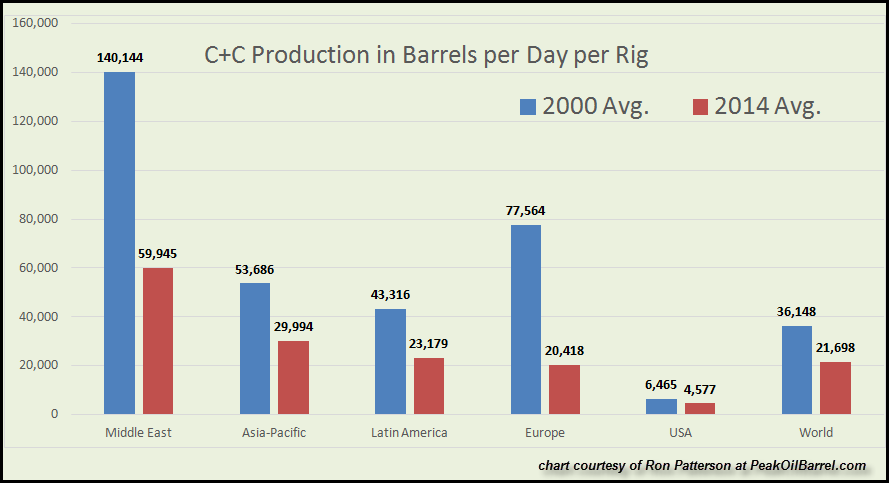
In 2000, the Middle East produced a staggering 140,144 barrels per day (bd) of oil for each drilling rig, compared to 59,945 bd in 2014. This is a 57% decline in oil productivity per drilling rig in 14 years. While it appears that the Middle East has the biggest decline in overall oil production per well, Europe has the worst percentage decline. Europe oil productivity declined 73%, from 77,564 bd of oil per rig in 2000 to 20,418 in 2014.
Furthermore, if we look at the worlds oil production per drilling rig (last bar on the right of the graph), it declined 40%, from 36,148 bd in 2000 to 21,698 in 2014. Here are two more charts showing the increased number of drilling rigs compared to total oil production:

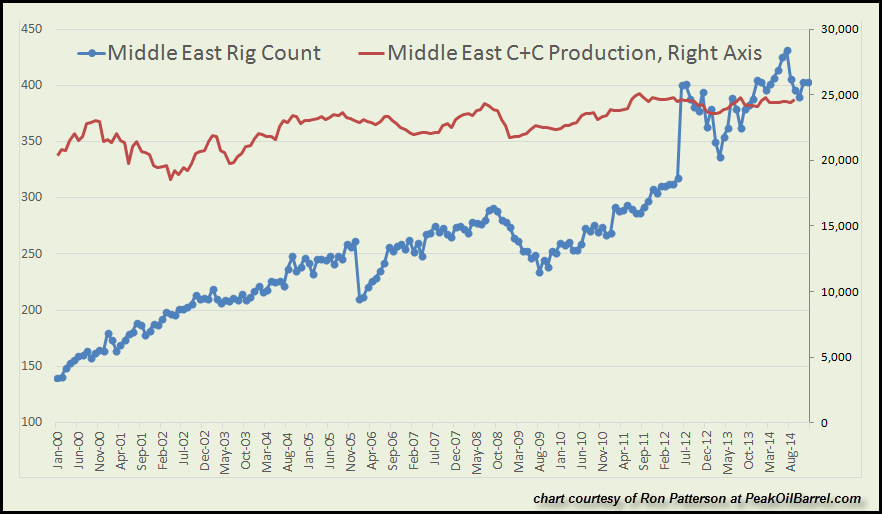
You will notice in the first chart, the number of European drilling rigs (BLUE) increases as oil production (RED) declines. On the other hand, in the second chart, Middle East oil production does continue to increase (20%), however, its total rig count jumps from 104 in 2000, to 406 in 2014 a 290% increase.
Folks, it just takes more energy shown by an increased number of drilling rigs to produce oil today than it did in 2000. Moreover, as oil productivity continues to decline going forward, so will the EROI. As the EROI falls below a certain level, our modern societies based on massive infrastructure (designed for high EROI) will come under severe stress resulting in an epic collapse.
The U.S. Empire Will Collapse Due To Its Falling EROI
I have not written many articles on the EROI Energy Returned On Invested, because it is not well received by the precious metal community at large. Of course there are few enlightened folks in the bunch, but for some strange reason, the gold and silver bugs continue to be ignorant to the destructive forces of a falling EROI.
You see, it doesnt matter how many economists or precious metal analysts state that returning to a Gold Standard will save us from a total economic collapse. While I admire and respect Peter Schiff warning of the housing and banking collapse on the top financial networks prior to 2007 as well as the continued financial disintegration today, Mr. Schiff fails to understand the falling EROI and its impact on the U.S. and Global Economies.
Backing the U.S. Dollar or other world fiat currencies with Gold will not solve the falling EROI as shown in the charts above. Matter-a-fact, I believe if the world was on a true Gold Standard, then Shale Oil and Tar Sands oil would not be affordable. The only way we have been able to bring this low quality high-cost oil to market is due to the massive monetary printing and stimulus by the Fed and Central Banks.
Once we have the collapse of the highly leveraged global financial paper system, we will also witness the collapse of the world oil industry especially the marginal producers such as Shale and Tar Sands.
The United States has been fortunate to survive on low oil productivity per drilling rig due to the Dollar being the worlds reserve currency. By flooding the world with an increasing amount U.S. Treasury debt, the U.S. imports a great deal of high EROI oil from the Middle East and other oil-producing countries.
If it wasnt for the United States Triple A Credit Card Rating, its economy would have collapsed years ago. Why? Its low 4,577 barrels per day of oil per drilling rig is not a sustainable EROI model. Basically, the U.S. economy could not sustain itself on its own energy production without exploiting the world by exchanging PAPER GARBAGE TREASURIES for real goods and services.
The day is approaching when the producers of the world such as the BRICS countries will no longer take paper IOUs for goods and services. The falling EROI is the key fundamental factor that shows the U.S. Empire is indeed in serious trouble.
While I dont rejoice in this understanding, all we can do is plan and protect ourselves when the inevitable happens. The best way I know how to survive this coming EROI collapse is by investing in gold and silver. Of course there is no guarantee of the value of these physical precious metal assets after the collapse, but I dont see much else worth investing in.
This will be discussed in more detail in future articles and reports.
Please check back for new articles and updates at the SRSrocco Report. You can also follow us at Twitter below:
![]()


