-- Published: Wednesday, 18 February 2015 | Print | Disqus
By Steve St. Angelo, SRSrocco Report
The U.S. and West are in serious financial danger as the highly leveraged debt-based fiat monetary system becomes weaker each passing day. You wouldnt know this was the case by the way the paper price of gold and silver are trading today. It doesnt seem to matter the disaster ready to unfold in Europe if (probably when) Greece makes its exit.
Regardless, the current global gold market structure reveals a severe out-of-balance situation. While the West, especially the U.S., continues to dominate the global financial system with the finest printing press on the planet, the East (BRICS) now control the lions share of the physical gold market.
Unfortunately, the majority of investors who receive their information from the Main Stream Media (MSM), have no clue just how weak and vulnerable the current global financial system has become. However, I believe we may be witnessing a peak in the broader stock-paper investment markets. The chart below is the current total value of the U.S. Retirement Market:

Here we can see that the total U.S. Retirement market increased significantly since the U.S. Investment Banking and Housing Collapse in 2008. In just one year, the value of the U.S. Retirement Market declined 21%, from $18 trillion in 2007 to $14.2 trillion in 2008. This should provide a guideline on how bad things will get when the broader markets finally head into the toilet once again.
In order to keep Americans believing in the biggest Paper Ponzi Scheme in history, the Fed along with its favorite member banks embarked on a massive official monetary-liquidity injection policy from 2009 onwards. As trillions of dollars of paper leverage made its way into the system, the U.S. Retirement market grew like a cancerous tumor.
In just six lousy years, the value of the U.S. Retirement Market increased a staggering $10 trillion to reach a lofty $24.2 trillion in Q2 2014. This was an astonishing 70% increase in this short time period. However, you will notice that the value did not rise in Q3 2014, but remained the same.
Was this due to the so-called winding down of the Feds QE policy? Some believe the Fed is still buying U.S. Treasuries, but in a more covert fashion through channels with other assorted corrupt central banks. Either way, the U.S. Retirement Market seems to have hit a peak and will be facing a sharp decline in the future. Of course, its impossible to forecast when the FAN HITS THE CRAPPER, but at least we know, all bubbles must POP eventually.
BRICS Countries Control The Market When It Comes To Gold
As I mentioned in the beginning of the article, the BRICS countries now control the overwhelming percentage of the global gold market. While the Western Central Banks along with their puppets in the MSM continue to brainwash its citizens into believing PAPER IS WEALTH, the EAST knows better by acquiring PHYSICAL GOLD, hand over fist.
Before I provide that chart, lets look at the BRICS vs WEST in gold production. Brazil, Russia, China and South Africa produced 915 metric tons (mt) of gold in 2014
according to the recently released USGS 2015 Gold Mineral Commodity Summary. The USGS and World Gold Council (using GFMS data) differ in their figures, but its not by much.
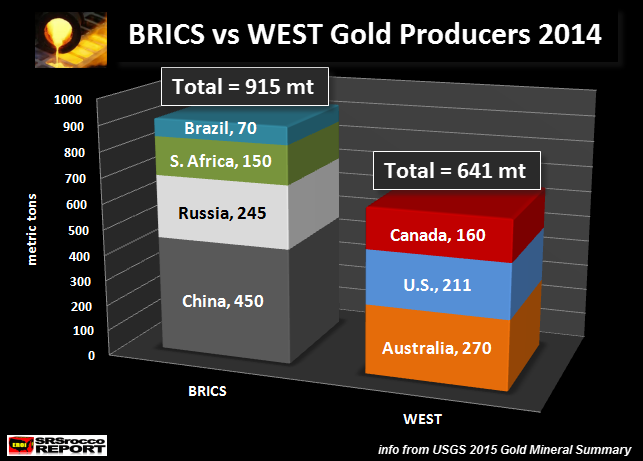
The WEST gold producers, Australia, U.S. and Canada produced 641 mt in 2014
. 30% less than the EAST. I didnt include any data for Europe as the USGS didnt break it down. But, according to the 2014 GFMS World Gold Survey, Europe (Finland, Sweden, Spain & Other) produced approximately 21 mt of gold in 2013. So, if you want to throw in an additional 20 (or so) mt of European gold for the WEST, be my guest.
Not only do the BRICS countries produce more gold than the WEST, they took the loins share of global gold demand. According to the World Gold Council 2014 Full Year Demand Trend Report, China, India and Russia consumed 1,901 mt of gold in 2014, compared to a total of 545 mt for the WEST:
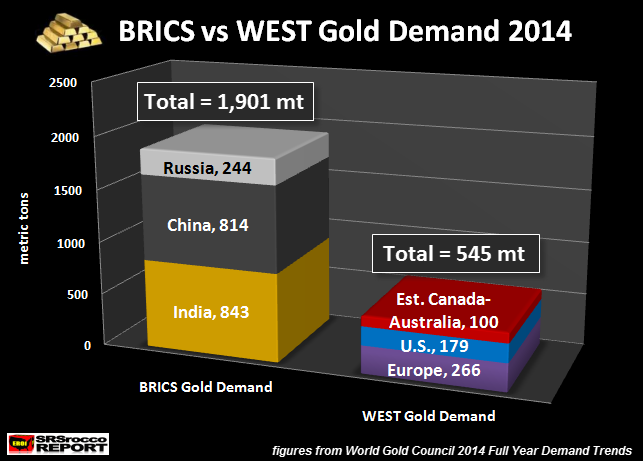
The World Gold Council (WGC) does not breakdown gold demand in all countries, but just by the top consumers. The WEST saw the majority of its gold demand in Europe (266 mt), the United States (179 mt) and an estimated 100 mt for Australia and Canada. The WGC did not provide data for either Australia and Canada, so I estimated 100 mt using 2013 figures from the 2014 World Gold Survey as a guideline.
The total gold demand for these seven countries was 2,446 mt. The BRICS took 78% of that amount, while WEST only received 22% of the total. Furthermore, Europe received the majority of Western demand at 266 mt or nearly 50% of the total. The major Western gold producers Australia, the United States and Canada only consumed an estimated 279 mt of gold in 2014, while their combined production was 641 mt.
The reality is this
the BRICS consumed 108% more gold than they produced, while the the WEST acquired 85% of their production and exported the rest. Again, European countries consumed the most gold in the West, but their total gold production was less than 10% of that amount. Thus, Australia, the U.S. and Canada shipped a large percentage of their gold overseas.
What we are seeing here is a perfect example of GRESHAMS LAW at work (Wikipedia):
When a government overvalues one type of money and undervalues another, the undervalued money will leave the country or disappear from circulation into hoards, while the overvalued money will flood into circulation.[1] It is commonly stated as: Bad money drives out good.
The undervalued money is GOLD, and its leaving the Western country(s) and disappearing into BRICS hoards. Most of the BRICS gold demand in 2014 went to individual Indian (843 mt) and Chinese (814 mt) investors, whereas most of Russias consumption (244 mt) was from Central Bank purchases (173 mt) and jewelry (71 mt).
Now, this data is from the World Gold Council, who according to Koos Jansen, underestimated total Chinese gold consumption in 2013 by 1,000 mt. In his most recent article, Koos Jansen vs WGC/GFMS/CPM Update, Koos believes actual Chinese gold demand was at least 1,800 mt in 2014.
Koos spent a great deal of time detailing gold supply and demand figures for China in that article which I highly recommend. Koos states that the WGC actually revised Chinas gold consumption from 1,066 mt in 2013 to 1,312 mt. If Koos is correct, and I believe his figures are more accurate, than this is a more realistic picture of BRICS gold demand in 2014:
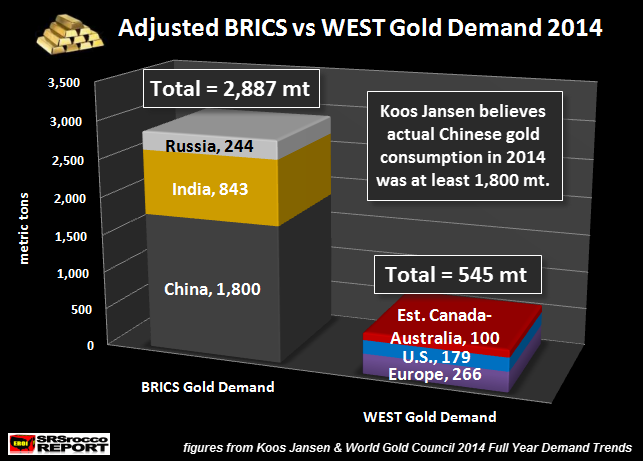
Using these adjusted figures, the BRICS countries consumed at least 2,887 mt of gold in 2014. Thus, total gold demand for these seven countries revised upward to 3,432 mt, giving the BRICS 84% of the total amount, while the WEST now only accounts for 16%.
There must be a pretty good reason the World Gold Council is underestimating Chinese gold demand. If the World Gold Council stated Chinese gold demand of 1,800 mt compared to the 814 mt in their report, it would totally destroy their supply-demand balance.
The World Gold Council shows a total of 4,278 mt of gold supply in 2014 with 3,924 mt of demand and 354 mt of OTC investment and stock flows. Basically, that 354 mt is a supposed surplus that made its way into the OPAQUE OTC DARK MARKET (OTC- Over-the-counter).
If we consider Koos Jansens higher Chinese gold demand figure, the global gold market would have suffered a 632 mt deficit in 2014 rather than a 354 mt surplus. Of course, this cant be shown in the official data as that would make the entire gold market look quite silly to say the least.
Even though the PAPER RIGGED market shows another big sell-off in the precious metals today, we can certainly guarantee the BRICS are adding more gold to their holdings. Already Shanghai Gold Exchange withdrawals are 315 mt for the first 5 weeks of the year. This is a hefty amount for the Chinese, given the fact that record withdrawals took place as the price of gold shot up $130 in January.
The markets will continue to price gold and silver as if they were second class assets, only good enough for 1-2% of the fringe population to acquire. Unfortunately for the 98%, time is running out for the grand illusion called the highly leverage derivatives FIAT MONETARY REGIME.
When the great MONETARY RESET finally arrives, it will probably be much worse than most realize. Owning gold and silver may turn out to be one of the few bright lights in a sea of dark.
Please check back for new articles and updates at the SRSrocco Report. You can also follow us at Twitter below:

| Digg This Article
-- Published: Wednesday, 18 February 2015 | E-Mail | Print | Source: GoldSeek.com


