

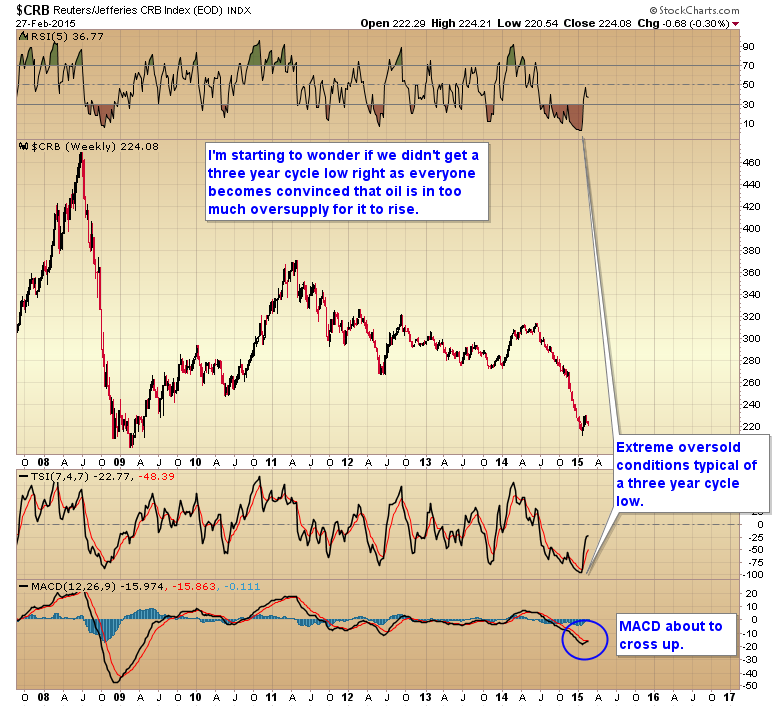
As most of you whove followed me over the years already know, Im not really expecting a final three year cycle low in the CRB until later in the year. However there are a few signs popping up that could be indicating that 3 year cycle low is going to come earlier than expected. And by earlier I mean it may have already occurred.
First I want to talk a little bit about oil. I think everyone knows by now that the fundamentals for oil are completely broken, there is simply too much supply, and price will never be able to rise by any significant amount anytime in the near future. Im starting to see outrageous predictions of $20 oil. However, that is exactly the kind of sentiment I would expect to see at a three year cycle low.
Moving on to some long term charts, you can see that the CRB has reached the kind of oversold levels indicative of a major three year cycle low. By some measures the CRB is more oversold than either of the last two major cyclical bottoms in 2009 & 2012.
Clearly the main driver forcing commodities lower is that the dollar has been in a seven year bull market. However, seven years is just about a normal duration for a dollar bull, and as you can see in the chart below the dollar has retraced 50% of the previous decline, which is coincidentally the same retracement that the previous bull accomplished prior to a bear market. Note the extreme overbought conditions on the monthly chart. With interest rates at virtually 0, and little incentive to raise them in the near future one has to wonder how much upside is left in this bull.
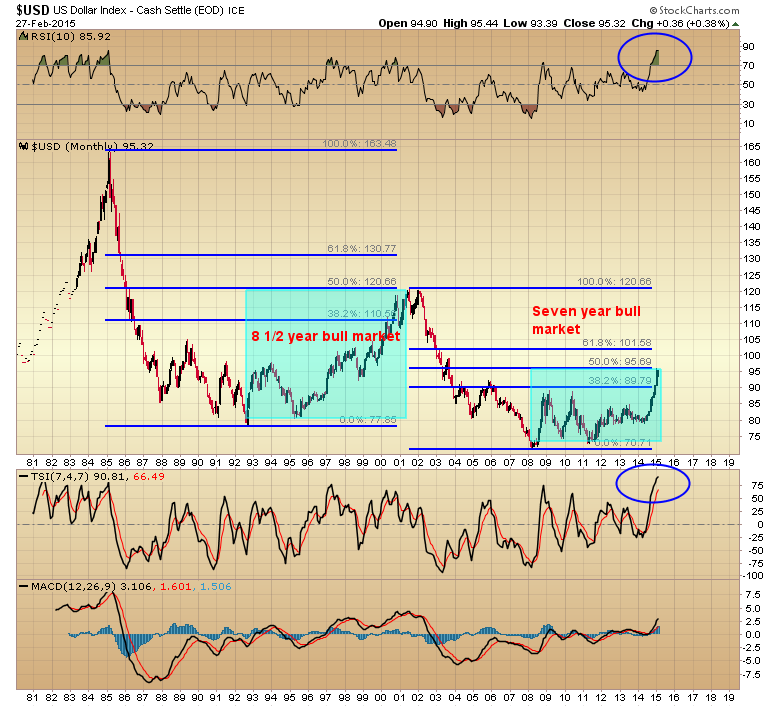
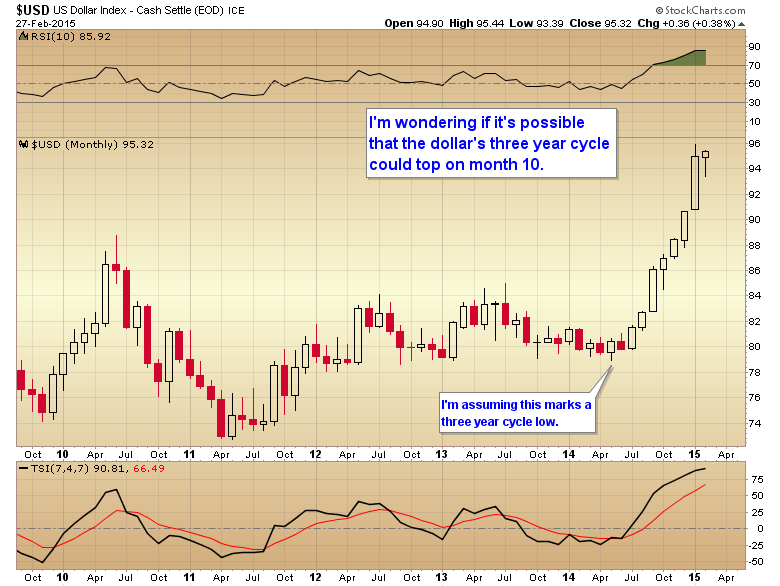
The last thing that anyone is expecting right now would be for the dollars three year cycle to top in a left translated fashion on month 10. I think everyone is expecting the dollar and euro to go to par sometime this year (as am I). I just wonder if it might do the exact opposite and catch everyone on the wrong side of the boat.
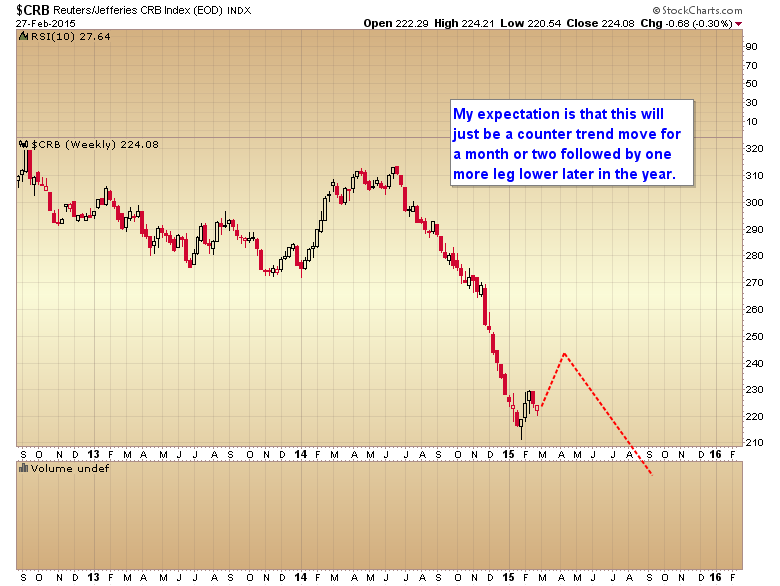
And yes I know, my expectation has been for a counter trend move early in the year followed by one more drop into a three year cycle low in the summer or early fall. And that does still remain the most likely scenario.
However, the mining stocks (and energy stocks) are not been behaving like they usually do during an intermediate degree decline, and that has me wondering if gold didnt possibly make a final bottom back in November, and is leading the CRBs 3 year cycle low by a couple of months just like it did in 2009. As a matter of fact, the weekly chart of the HUI is exhibiting a number of bullish patterns.
Notice how the recent correction has formed as a bull flag instead of the usual close back below the 10 week moving average, and acceleration downward that we typically see during an intermediate degree correction. As a matter of fact the miners tacked on 4% this week and closed back above the 10 week moving average. Several of the majors like Newmont and Barrick Gold have broken out to new highs. That is a bit unusual during an intermediate degree decline. Usually once the mining stocks lose the 10 week moving average it doesnt get recovered again until after a final intermediate bottom forms. Also notice that the recent low held support at 180.
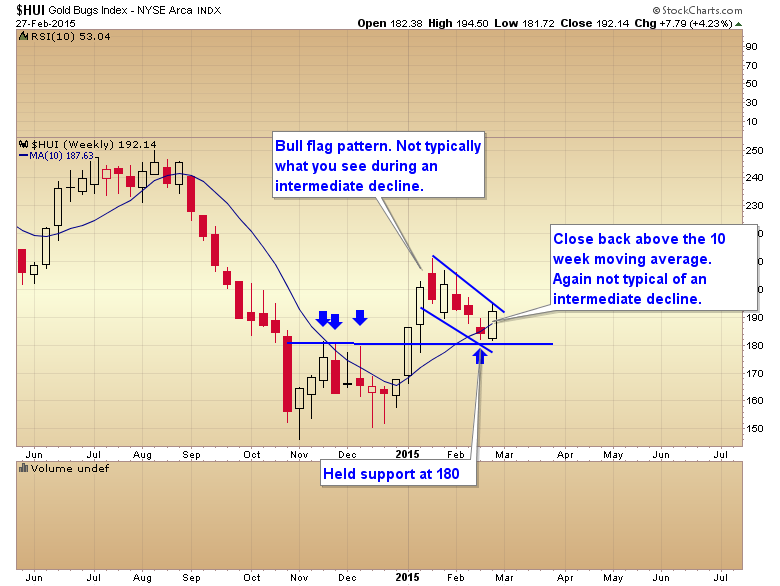
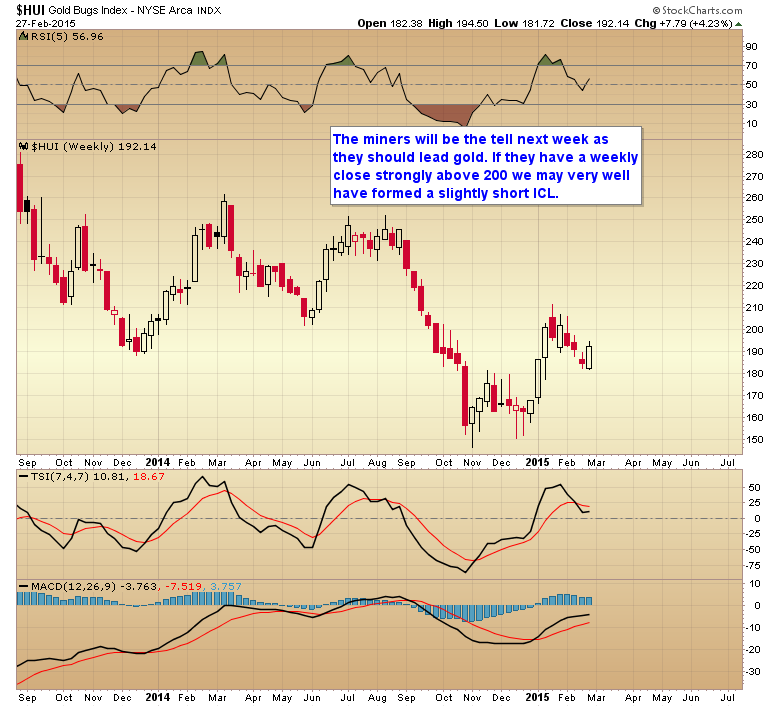
I think next week is going to go a long way towards clearing up whether we are just looking at a weak bounce out of a daily cycle low, to be followed by another leg lower, or whether gold may have just printed a slightly shortened intermediate cycle low (Ill explain in a minute). If the HUI can close strongly above 200 by next Friday, and survive the employment report Im going to start leaning in favor of the short ICL scenario.
Now let me explain what Im looking at as it pertains to gold and the possible short ICL. To begin with my preferred scenario is still the bearish one where gold rallies just far enough to break its cycle trend line and then continues down into an ICL in the normal timing band for that event (still 5-6 weeks away). In this scenario resistance in the 1250 ish zone would turn gold back down. That 1250 zone is going to be an important milepost this week. If gold makes it through that level then the short ICL scenario is going to gain a lot of traction.
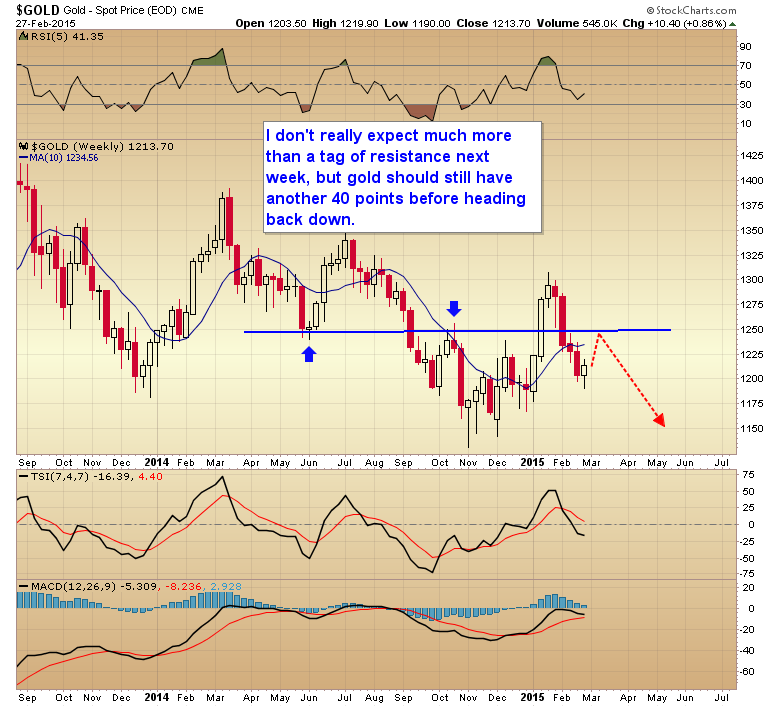
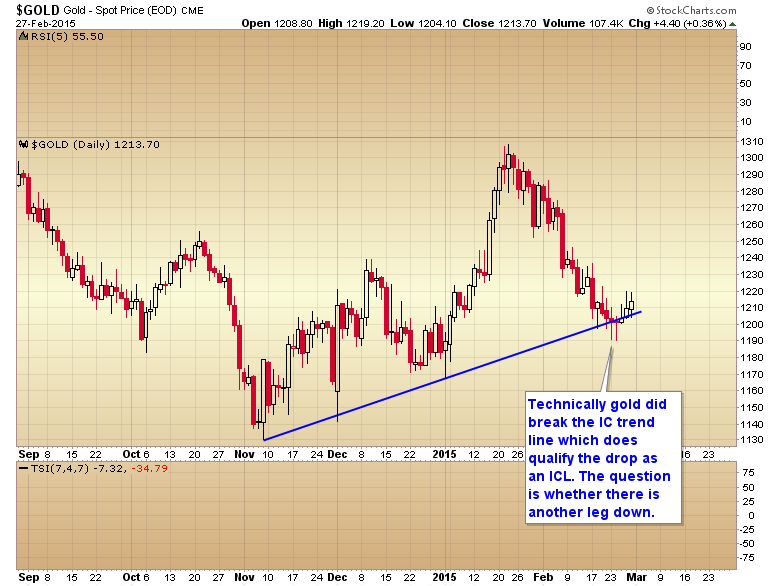
Now for the bullish scenario. As most of you know in order to confirm an ICL an asset has to break its intermediate trend line. Surprisingly gold did that, at least marginally this week. Granted this could mean that the intermediate decline has only just begun, and after a weak bounce gold will continue down into a final ICL in the normal timing band for that event, complete with a bloodbath phase. Or It could be that gold dipped just far enough to complete the broken trend line requirement, and then formed a shortened intermediate cycle low.
This could turn out to be the case as the dollar starts to move down into its own intermediate cycle low in the weeks ahead. If gold resumes its normal inverse relationship with the dollar then it could be that gold printed a short ICL and the low probability bullish scenario will come to fruition.
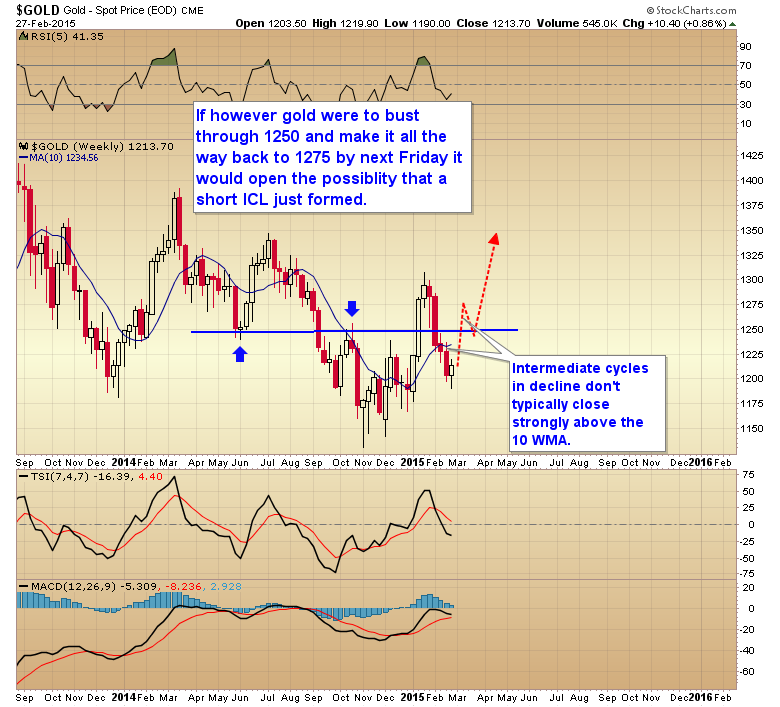
So next week I want to see how gold handles resistance at $1250, and how quickly it gets there. If gold were to reach that $1250 level by Tuesday or Wednesday it would increase the odds of breaking through that resistance zone. But even more important I want to see how the miners perform next week. If the miners end the week with another 5 to 7% gain, and survive the employment report, that is indicative of a new intermediate cycle rally beginning, rather than a counter trend bounce in an overall intermediate decline.
So a word of caution, I dont want to get everyones hopes up too much, and definitely do not start buying call options willy-nilly, as the bear scenario is still by far the most likely outcome. Shortened ICLs are rare, but they do happen from time to time. That being said, the miners are not acting like they have before during intermediate declines and that warrants at least a small bit of cautious optimism. Like I said, a small glimmer of hope for the long suffering gold bulls.
Click here to follow my daily reports next week as it could be a pivotal week for gold.


