-- Published: Tuesday, 10 March 2015 | Print | Disqus
By Art Berman
U.S. tight oil production may fall 600,000 barrels per day by June 2015 based on reasonable projections of current rig counts.
I compared the decrease in rig counts that began in late 2014 to the rig count decrease in 2008 and 2009 following the Financial Crisis. I projected current total rig counts according to three scenarios out to June 5, 2015 shown in the chart below. I then applied those decline rates to rig counts and production in the 4 major tight oil plays: the Bakken, D-J Niobrara, Eagle Ford and Permian basin.

Comparison of rig count decrease in 2008-2009 and 2014-2015. Source: Baker Hughes (chart from The Petroleum Truth Report)
In 2008-2009, the U.S. rig count dropped from 2,031 to 876 over a period of 283 days. As of February 13, 2015, the rig count has fallen from 1,931 to 1,358 over a period of 151 days. The current rate of decrease is greater than in 2008-2009. I used the 2008-2009 rig count trend as a general guide for rate of change and duration recognizing that there are differences between the two events. Other than the rate of decrease, the most notable difference is that in 2008-2009, there was more vertical drilling than in 2014-2015 and that rig efficiency was lower in 2008-2009 as a result.
I believe that I have accommodated that difference by using EIA production per rig and legacy production change data from the February 2015 Drilling Productivity Report. I used that data in conjunction with projected rig count decline rates to forecast future production for each play. The results are summarized in the following table.
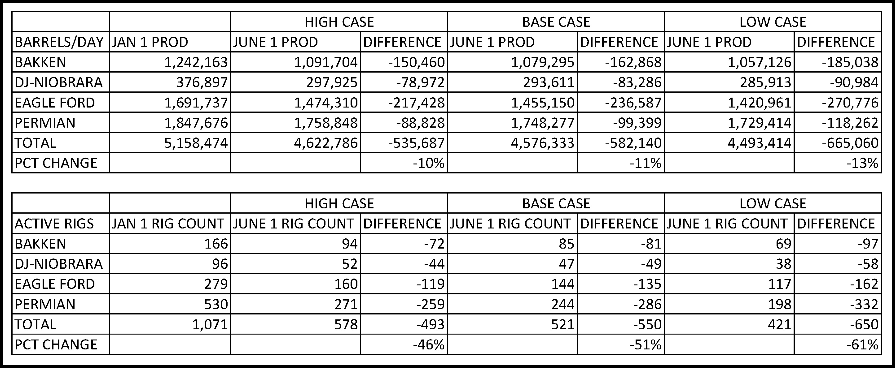
Summary table showing forecasted production and rig counts for the base, high and low cases for key tight oil plays. (table from The Petroleum Truth Report)
Source: Labyrinth Consulting Services, Inc.
Production for these four tight oil plays alone may fall by approximately 582,000 barrels of oil per day by early June 2015 in the base case. A decrease of about 536,000 barrels per day is estimated for the high case and a decrease of about 665,000 for the low case. Production decline will also occur outside of these plays so the total drop in U.S. production will be greater.
This is significant because the EIA world liquids production surplus for January 2015 is 0.97 million barrels per day and the estimate for June 2015 is 0.63 million barrels per day (EIA February STEO). In other words, the estimated decline in U.S. tight oil production should correct a substantial proportion of the world supply surplus by mid-year.
This suggests that prices may rebound strongly in the second half of 2015 even without an OPEC production cut assuming that demand does not falter.
This article was written by Art Berman at The Petroleum Truth Report. The original article was titled Tight Oil Production Will Fall 600,000 Barrels Per Day By June and can be found by clicking on the link.
| Digg This Article
-- Published: Tuesday, 10 March 2015 | E-Mail | Print | Source: GoldSeek.com


