

By Frank Holmes
For the first time in its 84-year history, American Airlines was cleared for landing in the S&P 500 Index.
Joining rivals Southwest Airlines and Delta Air Lines, the once-beleaguered carrier is the newest member of the prestigious club for the nations largest companies by market capitalization.
Not bad for a company that, only four years ago, found itself in bankruptcy court.

But in a classic Cinderella-story transformation, American succeeded at charting a new course for itself. In 2013 it merged with U.S. Airways, making it the biggest airline group in the world. The company now has a market cap of nearly $37 billion and controls 627 active jets in its fleet.
Americans ascension is a perfect reflection of the now-robust airline industry as a whole. As recently as a decade ago, about 70 percent of U.S. carriers were operating under Chapter 11 bankruptcy protection. Fast forward to 2014, and the industry saw its most profitable year ever. To generate more revenue and save money, airlines have aggressively implemented new policies in the last few years, including adding additional seats on aircraft, streamlining operations and focusing on fuel-efficiency measures.
American Airlines stock is already up more than 51 percent for the 12-month period, compared to the S&P 500s 14 percent, and is currently trading close to all-time highs. Its inclusion in the S&P 500 should further help its stock price climb higher, as many funds that track the index will now be compelled to purchase shares.
Low oil prices have benefited American more so than some of its competitors, as the carrier didnt buy derivatives on fuel and was therefore not locked into higher prices before they began to tumble last summer.
Many analysts predict that the next airline to join the S&P could be United Continental.
Dollar Overbought, Gold Oversold
In a recent Frank Talk I revisited the relationship between the U.S. dollar and gold. For the ninth straight month, the greenback has strengthened, which has weighed heavily on the yellow metal. The inverse relationship between the two is key to understanding the Fear Trade.
As I discussed in the blog post, the dollar is extendedthe greatest standard deviation in a decadeand it appears due for a correction.

Conversely, the gold selloff is overdone and looking for a rally.
Next week well be looking out for the latest consumer price index (CPI), or inflationary number. Its important to be aware of this number because the inflation rate has a large influence on gold prices.
The weekend before last I presented at the Investment U conference in St. Petersburg, Florida, where I had the pleasure of hearing Oxford Clubs natural resources strategist, Sean Brodrick, speak. He reminded his audience why so many investors see gold as a safe haven, saying that, unlike the dollar, gold will never go to zero.
As always, I advocate that 10 percent of your portfolio consist of gold: 5 percent in bullion and 5 percent in gold stocks, then rebalance every year.
Munis Still Make Sense
Safety is part of the reason why the municipal bond market is today worth $3.65 trillion. To determine just how safe munis have been for investors, Moodys looked at more than 54,000 municipal bond issuers and 5,600 high-yield corporate bond issuers between 1970 and 2011. What they found is that only 71 muni issuers defaulted, whereas corporate bond defaults for the period rose to more than 1,800.
Whats more, even lower-rated munis have historically had better credit quality than high-rated corporate bonds. In a similar study, Moodys reported that since 1970, adequate Baa-rated munis have had a default rate of 0.30 percent. But of the corporate bonds that received the highest, extremely strong rating, 0.50 percent failed to meet their obligations.
Munis had a stellar 2014, delivering positive returns all 12 months of the year. This helped the asset class outperform both corporate bonds and high-yield corporate bonds.
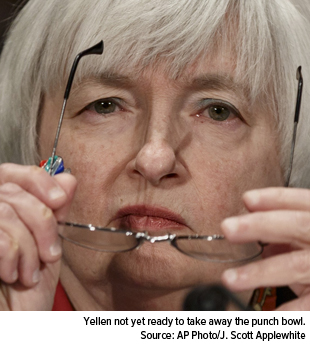 Rightfully so, many bond investors are concerned of what might happen to their holdings when the Federal Reserve decides to raise rates, which could happen sometime this year. When interest rates rise, bond prices drop. For this reason, the bond market reacted positively to Fed Chair Janet Yellens announcement last Wednesday that a rate hike wouldnt occur just yet. Short-term munis are where investors want to be when rates inevitably increase.
Recently weve also seen a spike in bond yields. John Derrick, portfolio manager of our Near-Term Tax Free Fund (NEARX), has prudently put fund assets to work, using the following oscillator, among other tools, to determine the most opportune times to deploy capital.
Note that were using the two-year Treasury as a proxy for interest rate moves. Munis have tended to track these macro trends.

NEARX has delivered 20 straight years of positive growth in a variety of interest rate environments. Out of 25,000 equity and bond funds, only 30 have done this. Since 1999the first year he began managing the fundJohn has achieved this rare feat by picking only investment-grade munis with short-term maturities. Short-term bonds are less sensitive to rate increases than longer-term bonds that are locked into rates for greater periods of time.

Please consider carefully a funds investment objectives, risks, charges and expenses. For this and other important information, obtain a fund prospectus by visiting www.usfunds.com or by calling 1-800-US-FUNDS (1-800-873-8637). Read it carefully before investing. Distributed by U.S. Global Brokerage, Inc.
| One-Year | Five-Year | Ten-Year | Gross Expense Ratio | Expense Cap | |
|---|---|---|---|---|---|
| Near-Term Tax Free Fund | 3.07% | 2.64% | 2.98% | 1.21% | 0.45% |
Expense ratio as stated in the most recent prospectus. The expense cap is a contractual limit through December 31, 2015, for the Near-Term Tax Free Fund, on total fund operating expenses (exclusive of acquired fund fees and expenses, extraordinary expenses, taxes, brokerage commissions and interest). Performance data quoted above is historical. Past performance is no guarantee of future results. Results reflect the reinvestment of dividends and other earnings. For a portion of periods, the fund had expense limitations, without which returns would have been lower. Current performance may be higher or lower than the performance data quoted. The principal value and investment return of an investment will fluctuate so that your shares, when redeemed, may be worth more or less than their original cost. Performance does not include the effect of any direct fees described in the funds prospectus which, if applicable, would lower your total returns. Performance quoted for periods of one year or less is cumulative and not annualized. Obtain performance data current to the most recent month-end at www.usfunds.com or 1-800-US-FUNDS.
Bond funds are subject to interest-rate risk; their value declines as interest rates rise. Tax-exempt income is federal income tax free. A portion of this income may be subject to state and local income taxes, and if applicable, may subject certain investors to the Alternative Minimum Tax as well. The Near-Term Tax Free Fund may invest up to 20% of its assets in securities that pay taxable interest. Income or fund distributions attributable to capital gains are usually subject to both state and federal income taxes. The Near-Term Tax Free Fund may be exposed to risks related to a concentration of investments in a particular state or geographic area. These investments present risks resulting from changes in economic conditions of the region or issuer.
The S&P 500 Stock Index is a widely recognized capitalization-weighted index of 500 common stock prices in U.S. companies.
The Consumer Price Index (CPI) is one of the most widely recognized price measures for tracking the price of a market basket of goods and services purchased by individuals. The weights of components are based on consumer spending patterns.
The S&P Municipal Bond Index is a broad, market value-weighted index that seeks to measure the performance of the U.S. municipal bond market.
The Bloomberg USD High Yield Corporate Bond Index is a rules-based, market-value weighted index engineered to measure publicly issued non-investment grade USD fixed-rate, taxable, corporate bonds. To be included in the index, a security must have a minimum par amount of 250MM.
The Bloomberg U.S. Corporate Bond Index is a rules-based market-value weighted index engineered to measure the investment grade, fixed-rate, taxable, corporate bond market. It includes USD-denominated securities publicly issued by U.S. and non-U.S. corporate issuers. To be included in the index, a security must have a minimum par amount of 250MM.
Fund portfolios are actively managed, and holdings may change daily. Holdings are reported as of the most recent quarter-end. Holdings in the Near-Term Tax Free Fund as a percentage of net assets as of 12/31/2014: American Airlines 0.00%, Southwest Airlines Co. 0.00%, Delta Air Lines, Inc. 0.00%, United Continental Holdings, Inc. 0.00%.
Standard deviation is a measure of the dispersion of a set of data from its mean. The more spread apart the data, the higher the deviation. Standard deviation is also known as historical volatility.
All opinions expressed and data provided are subject to change without notice. Some of these opinions may not be appropriate to every investor. By clicking the link(s) above, you will be directed to a third-party website(s). U.S. Global Investors does not endorse all information supplied by this/these website(s) and is not responsible for its/their content.


