-- Published: Friday, 27 March 2015 | Print | Disqus
By Steve St. Angelo, SRSrocco Report
There is this silly notion that the United States will become energy independent in the next several years, thus making it unnecessary to import oil from Middle Eastern countries such as Saudi Arabia. While some fairy tales in life may come true…. U.S. energy independence isn’t one of them.
Even though the U.S. is supposedly producing more oil than it has in 42 years, this is a party that won’t last long. According to the U.S. Energy Information Agency (EIA), the United States produced an amazing 9.4 million barrels per day (mbd) during the week of 3/20/15, compared to 9.3 mbd of oil back in December, 1972.
That being said, there still seems to be a significant percentage of mortals out there who believe “Peak Oil” is complete nonsense as the Abiotic Oil Theory proves that oil fields continue to refill from the black gold that is produced deep inside the creamy nougat center of the earth.
One individual who continues to regurgitate this Abiotic Oil Theory is Jerome Corsi, the author of Black Gold Stranglehold. Corsi, who is a frequent guest on the late night talk show Coast-to-Coast-Am, believes high oil prices over the past decade were due to the manipulation by the greedy corrupt major oil companies.
Well, Mr. Corsi might know how to write a great book to get the conspiracy folks all worked up, but applying simple 4th grade math totally destroys his faulty theories.
The Falling EROI (Energy Returned On Invested) from 100/1 in the 1930’s to Shale Oil at 5/1 today, proves that oil fields ARE NOT filling back up. For clarification, the EROI of 100/1 means the U.S. oil industry was burning one barrel of oil in the 1930’s to produce 100 barrels for the market.
If the U.S. oil fields were refilling, then why are the poor slobs wasting time losing money drilling in the Bakken?? The oil industry in the U.S. was finding new oil fields during the early 1900’s with EROI in the 100’s and 1,000’s. Again, why on earth would the majority of these greedy corrupt oil companies continue so suffer from negative Free Cash Flow operating in the Bakken, if all they had to do was extract much more profitable oil that was refilling in old fields?
You see, the logic and common sense here is very simple and easy to understand. I am completely surprised at how seemingly intelligent individuals can fall for some of the most INSANE THEORIES.
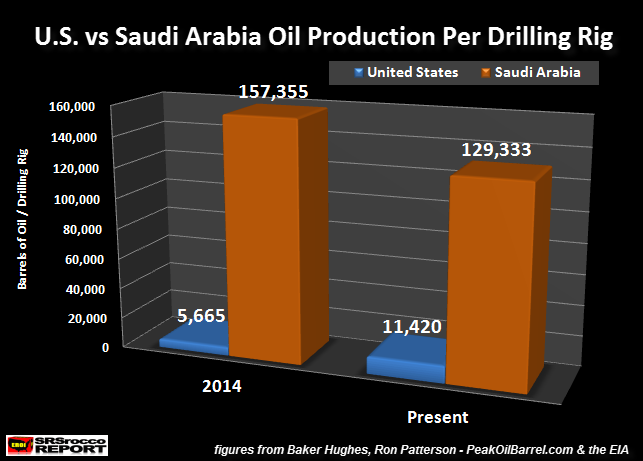
Okay, here is the chart that also reveals why the United States is UP A CREEK WITHOUT A PADDLE. In 2014, the U.S. produced a lousy 5,665 barrels of oil per drilling rig compared to Saudi Arabia at a staggering 157,335 per drilling rig. Saudi Arabia produced 27 times more oil per oil drilling rig than the U.S. in 2014.

I gather Saudi Arabia’s oil fields are doing a much better job refilling than ours. Of course, I am only kidding.
The average oil drilling rig number for the U.S. in 2014 was 1,527 versus Saudi Arabia at a whopping 62… LOL. However, the current low oil price has cut the U.S. oil drilling rig fleet nearly in half from a high of 1,600 in 2014, to 825 today. According to data from Euan Mearns at Energy Matters, Saudi Arabia’s oil rig count increased to 75 in February.
If you look at the right bar in the chart above, you will see that due to the U.S. cutting its oil drilling rig fleet in half since 2014, its average oil production per rig has doubled. Again… LOL. This is not a good sign. Even though the Saudi’s average declined a bit from 157,335 barrels per rig in 2014 down to 129,333 presently, they can afford to increase their drilling rigs while the U.S. oil industry has done the opposite. The U.S. oil industry is in BIG TROUBLE.
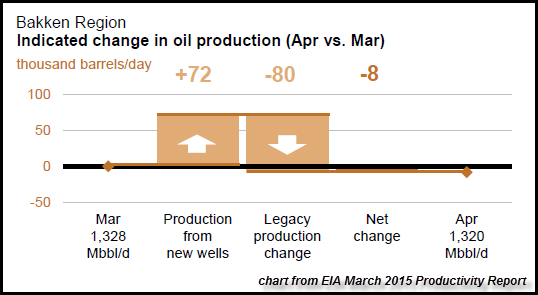
How much trouble?? Well, this next chart just may give us an idea of what’s to come.

According to the EIA’s recently released March 2015 Productivity Report, the Bakken is forecasted to show a decline in production in April by 8,000 barrels per day. This may only be a small number, but this is only an estimate… which may be totally inaccurate.
The North Dakota Department of Mineral Resources released their Production Report for January which stated the following:

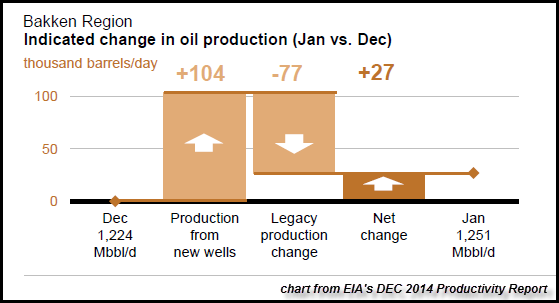
Here we can see that the Bakken’s production declined from 1,227,483 barrels per day in December, to 1,190,490 in January 2015. If we look at the U.S. EIA’s Productivity Report for the same month, this was their estimate:

Something is very wrong here. The U.S. EIA shows an increase of 27,000 barrels per day in January while the North Dakota DMR publishes a decline of 37,000 barrels per day. Again, the EIA’s reports are estimates.
So, if North Dakota is already showing a decline in Bakken oil production in January, how bad would it be by the middle of the year? I believe energy analyst Art Berman may indeed be correct forecasting Shale Oil Production Will Fall By 600,000 Barrels Per Day By June.
The United States will never become energy independent as its shale oil industry’s costs and decline rates are just too damn high. Furthermore, the U.S. still imported 6.9 million barrels per day of oil during the week of 3/20/15. There is no way the United States will ever close that gap.
For all the folks who still believe in the Abiotic Oil Theory or that the U.S. contains a trillion barrels of oil resources in the west, logic and common sense is not on your side. If the companies drilling in the Bakken with an EROI of 5/1 are losing money and are in debt up to their eyeballs, who in their right mind is going to extract the trillion barrels of lousy oil shale in the western U.S. at a lousy EROI of 2/1???
Note: Shale oil in the Bakken is technically called “Tight Oil”. However, shale oil should not be confused with oil shale. Oil shale is not even oil. To extract oil from oil shale, the shale has to be crushed and then heated to remove the oil. So, crappy low EROI oil shale resources should not be placed in the same category as high EROI light sweet crude.
Anyone who quotes the U.S. has a trillion barrels of oil resources (including that lousy oil shale), is doing so out of complete ignorance and stupidity.
Please check back for new articles and updates at the SRSrocco Report. You can also follow us at Twitter below:

| Digg This Article
-- Published: Friday, 27 March 2015 | E-Mail | Print | Source: GoldSeek.com

