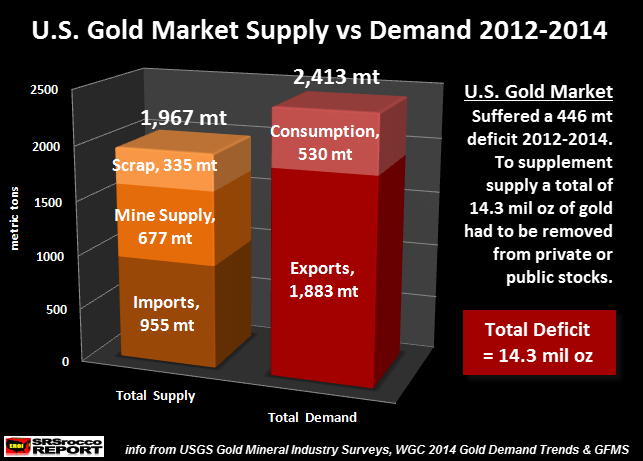
With all the data finally out, the United States gold market suffered a massive deficit over the past three years. How large was this deficit? Actually, large enough to supply all the gold for the U.S. Mint’s production of its Gold Eagles for the past twenty years… a huge amount indeed.
While the U.S. gold market enjoyed some annual surpluses in previous years, the amount of the gold that left the country since 2012 was quite remarkable. In order to calculate a surplus or deficit in the U.S. gold market, we have to include the following data:
Total Supply = Imports + Mine Supply + Recycled Scrap
Total Demand = Exports + Consumption
By inputting this data over the past three years, we have the following chart:
From 2012 to 2014 the U.S. imported 955 metric tons (mt) of gold, had mine production of 677 mt, and recycled 335 of scrap for a total of 1,967 mt of supply. In contrast, total demand was significantly higher including 1,883 mt of gold exports and 530 mt of consumption for a grand total of 2,413 mt.
Here is the breakdown of the annual U.S. gold market deficits:
2012 = 139 mt
2013 = 228 mt
2014 = 79 mt
Total = 446 mt
As we can see, the U.S. gold market suffered a huge 446 mt deficit since 2012. The annual gold deficit was the highest in 2013 due to record exports and consumption of 880 mt compared to lower imports, mine supply and scrap of 652 mt.
By converting this 446 mt figure to troy ounces we get a massive 14.3 million ounces (Moz) of gold. As I mentioned in the beginning of the article, this deficit was large enough to supply all the gold for twenty years worth of U.S. Mint Gold Eagle sales. Since 1995, the U.S. Mint produced and sold 14.6 Moz of Gold Eagles. Yeah, I realize it’s a tad bit more than the 14.3 Moz U.S. gold market deficit (2012-2014), but it’s close enough.
So, where did all this gold come from? That’s a good question. Probably some of it came from the U.S. Comex gold inventories which declined from 11.5 Moz in 2012 to 7.8 Moz currently. However, the decline of gold inventories at the Comex was less than 3 Moz, so this wasn’t enough to supplement the 14.3 Moz deficit.
It’s really impossible to know which public or private stocks were drained to fill this huge U.S. gold market deficit, but we can certainly guarantee for sure… it did happen.
I highly doubt the Fed would want to see the price of gold (in U.S. Dollars) falling below $1,100, as some major bank forecasts have stated will occur in the next several years. I would imagine the Fed has a pretty good idea of the amount of gold fleeing the U.S. to countries abroad. If the paper Dollar price of gold were to fall below $1,100, this would be another huge buying opportunity for the EAST.
At some point, the Greatest Financial Ponzi Scheme in history will unravel just like the Bernie Madoff scam. Unfortunately, this will impact the majority of U.S. citizens who have no idea that the Great American Dream will turn into a horrible nightmare.
NOTE: On the subject of the supposed long-term U.S. Gold Deficit stated by some well-known precious metal analysts, please read my comment below:
Please check back for new articles and updates at the SRSrocco Report. You can also follow us at Twitter below:


