Tonight I would like to show you some really big consolidation patterns in regards to some big cap tech stocks mainly the networking and semiconductors. I have shown you some of these big bases in the past but now Im going to create a brand new portfolio based just on these big patterns. It definitely wont be as exciting as trading in and out all the time as the game plan will be to hold these stocks for a minimum of two years, no trading. This will be an investment portfolio based on these massive consolidation patterns. Big base or consolidation patterns equals big moves.
Im seeing too many of these big bases breaking out and the stocks moving higher without our participation. This will be a low stress way to make some serious money if you have the discipline to hang on when there is a correction. Think if you had bought some of the better stocks back at the 2009 crash low and held on over these last six years or so. Its much easier said than done. At any rate Im going to show you some stocks that I think have a great future regardless of why the stock markets are going to crash and burn any day now. Thats is basically all weve heard since the 2009 crash low and here we are now with many stock market indexes making multi year highs.
For most folks I would think that they should have at least a minimum of 50% of their portfolio in some of the better long term stocks. With the stock markets consolidating for long periods of time this will keep you out of trouble trying to catch every twist and turn that is virtually impossible to trade.
The two areas Im going to focus in on are the semiconductors and the networking areas as I believe they have some catching up to do compared to some other areas of the markets like the biotech and healthcare that have and are still a good place to park some capital.
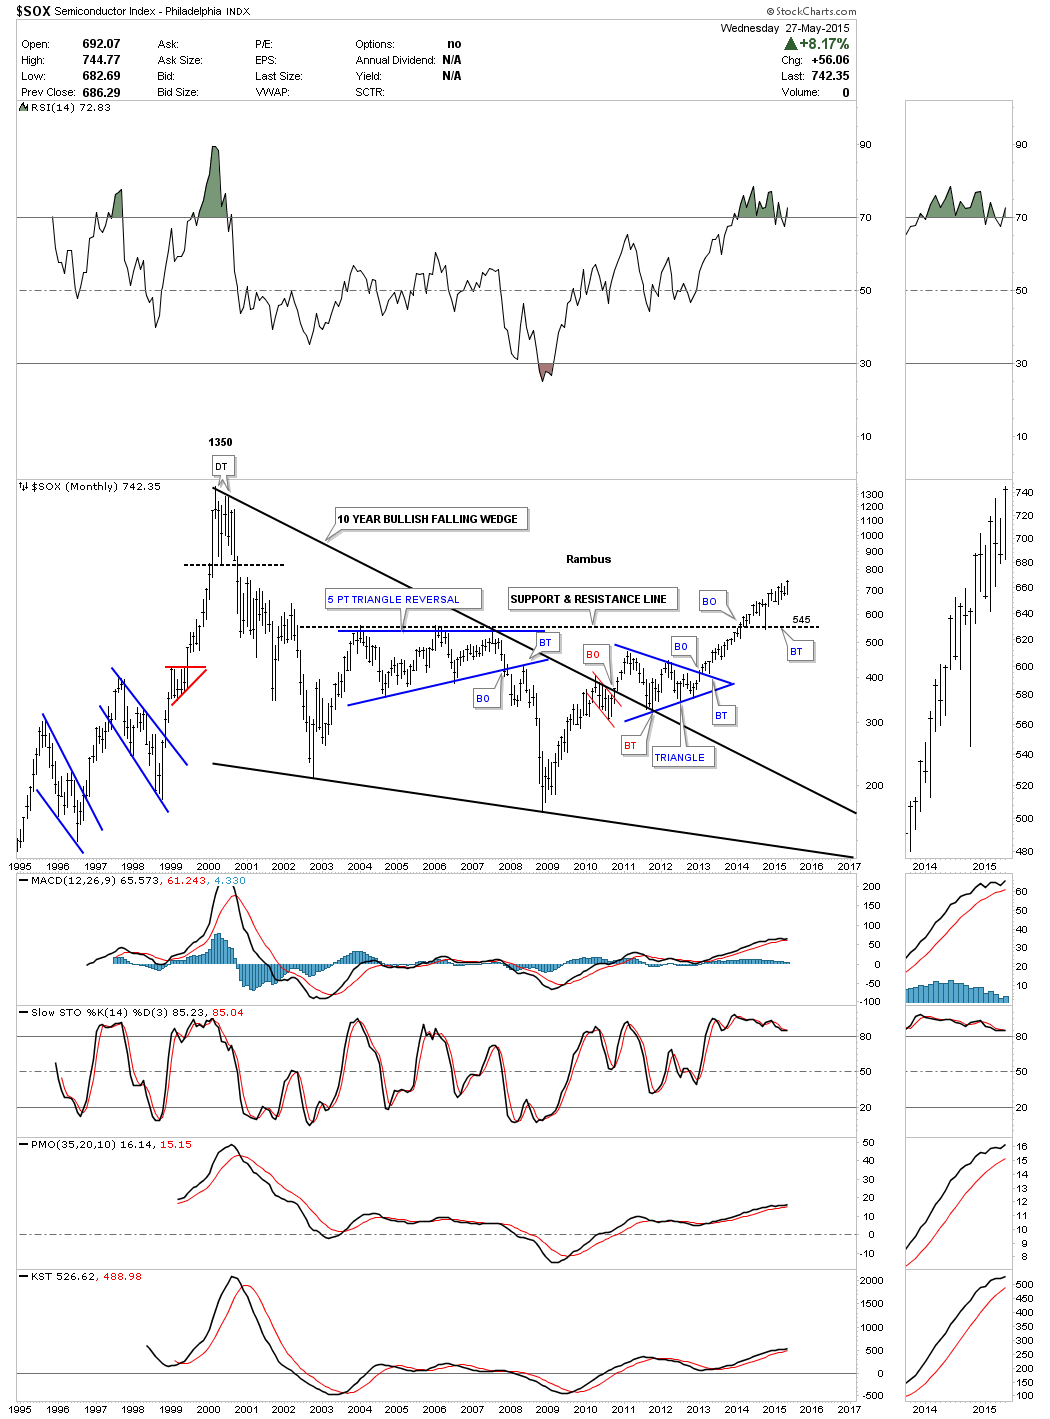
Lets start by looking at the two indexes the $SOX semiconductor index and the $NWX networking index. I have shown you this long term monthly chart for the SOX several times in the past which is showing us one of those massive consolidation pattern, the 10 year bullish falling wedge. From a Chartology perspective its a pretty as it gets. Note the breakout from the black dashed horizontal support and resistance line about a year and a half ago with the backtest from the top which found support during the October low of last year and the quick bounce to the present. Also note the very last bar on the right hand side of the chart which shows the SOX hitting new multi year high this month.
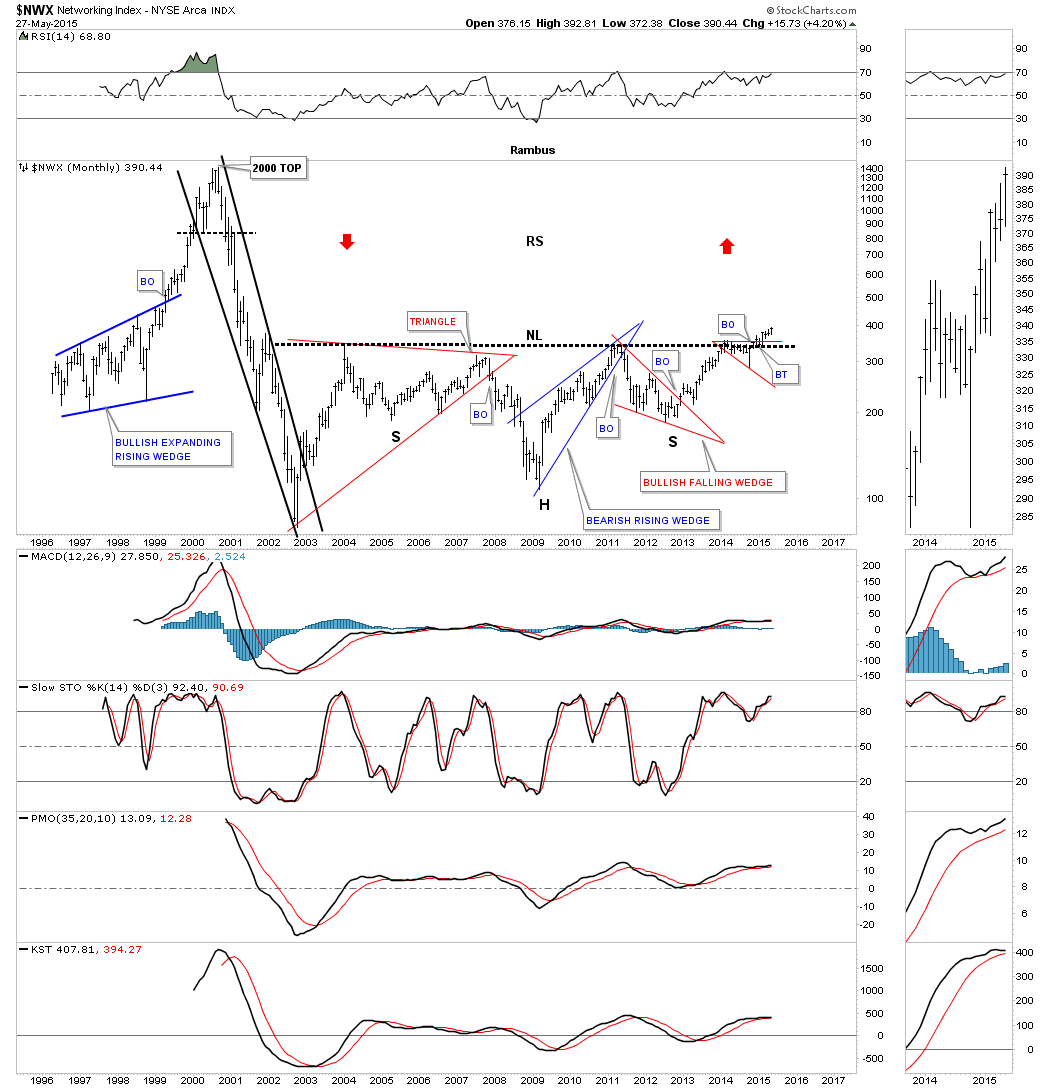
I first showed you this long term monthly chart for the $NWX when it first broke out from that massive 12 year inverse H&S pattern. As you can see it has had a nice backtest to the neckline shortly after breaking out. One of the reasons I like this chart so much is because of the steep decline that occurred after the 2000 peak. There is a good chance we will see some nice reverse symmetry back up over the same area NWX declined after the 2000 top was put in.
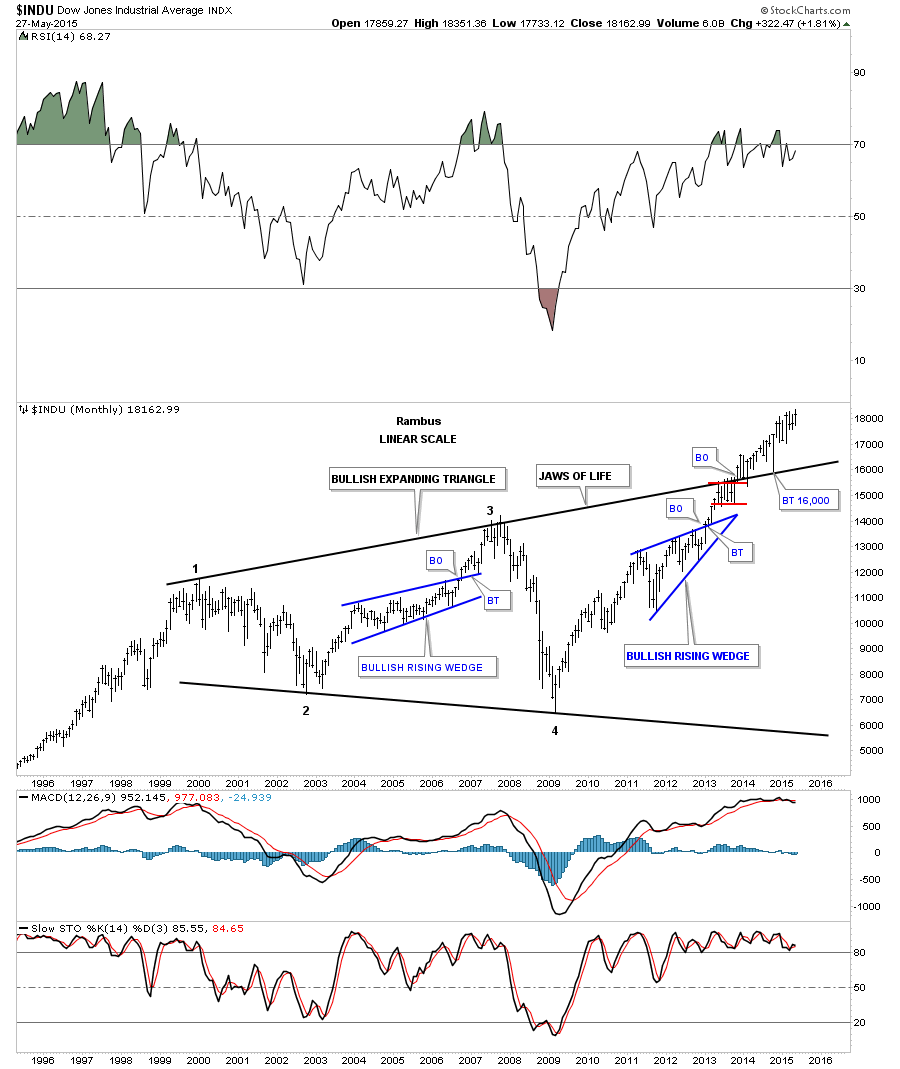
Ive shown you this long term monthly chart for the INDU which I call my, JAW OF LIFE CHART, which so many analysis are calling the JAWS OF DEATH. I have shown you this chart for close to a year and a half and it still just keeps on going up. Big pattern big move. We still have a few more days left of trading in May which may show the INDU making another brand new all time high. This is the reality which few want to accept. Note the spike low to the top rail during the October low last year at 16,000. Picture perfect.
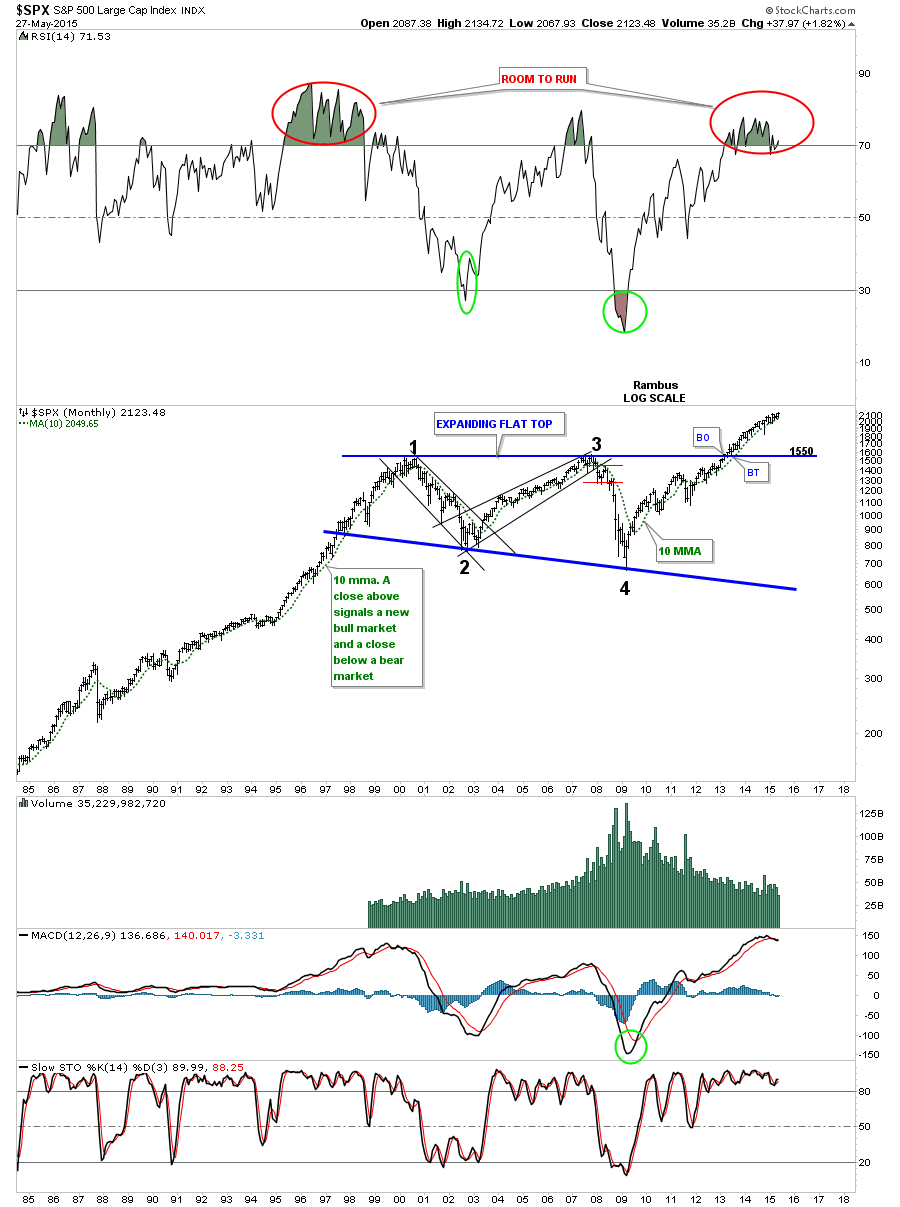
The SPX shows a massive 13 year expanding flat top triangle that broke out in 2013 and hasnt looked back.
Below is a long term monthly chart for the RUT 2000 which shows a massive 13 year black bullish expanding rising wedge. Note the breakout that created the blue expanding flat top triangle that formed right on top of the black rail of the expanding rising wedge. The backtest in October was pretty strong but looked where it closed the month, right at the top of the monthly bar. Note the last four bars on this monthly chart that shows the breakout and the backtest, this month, to the top blue rail. This is exactly what you want to see from the longer term perspective.

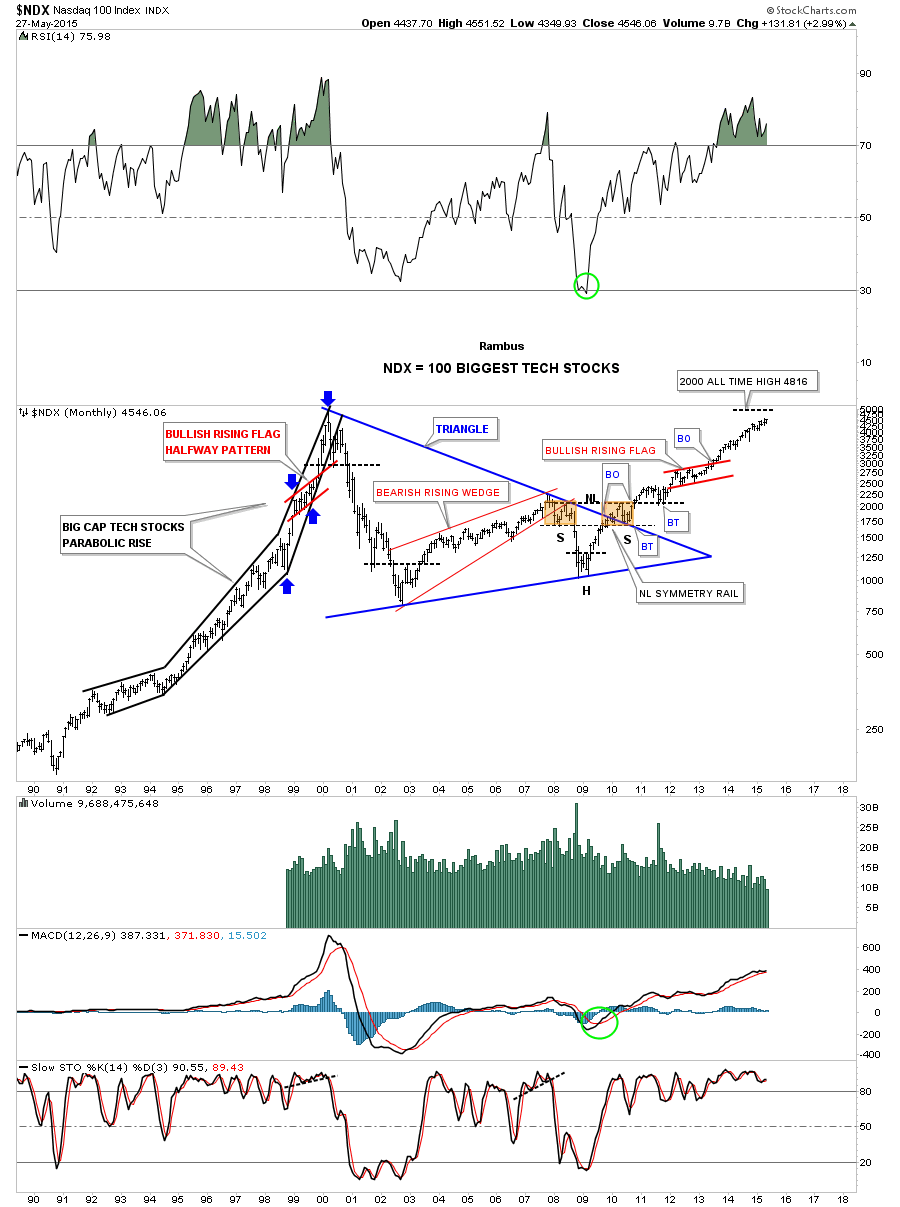
Below is a long term chart for the NDX 100 which is made up of the 100 biggest tech stocks. This chart shows it made a huge ten year triangle consolidation pattern before it broke out to the upside. As you can see it is closing in on its all time highs made back in 2000.
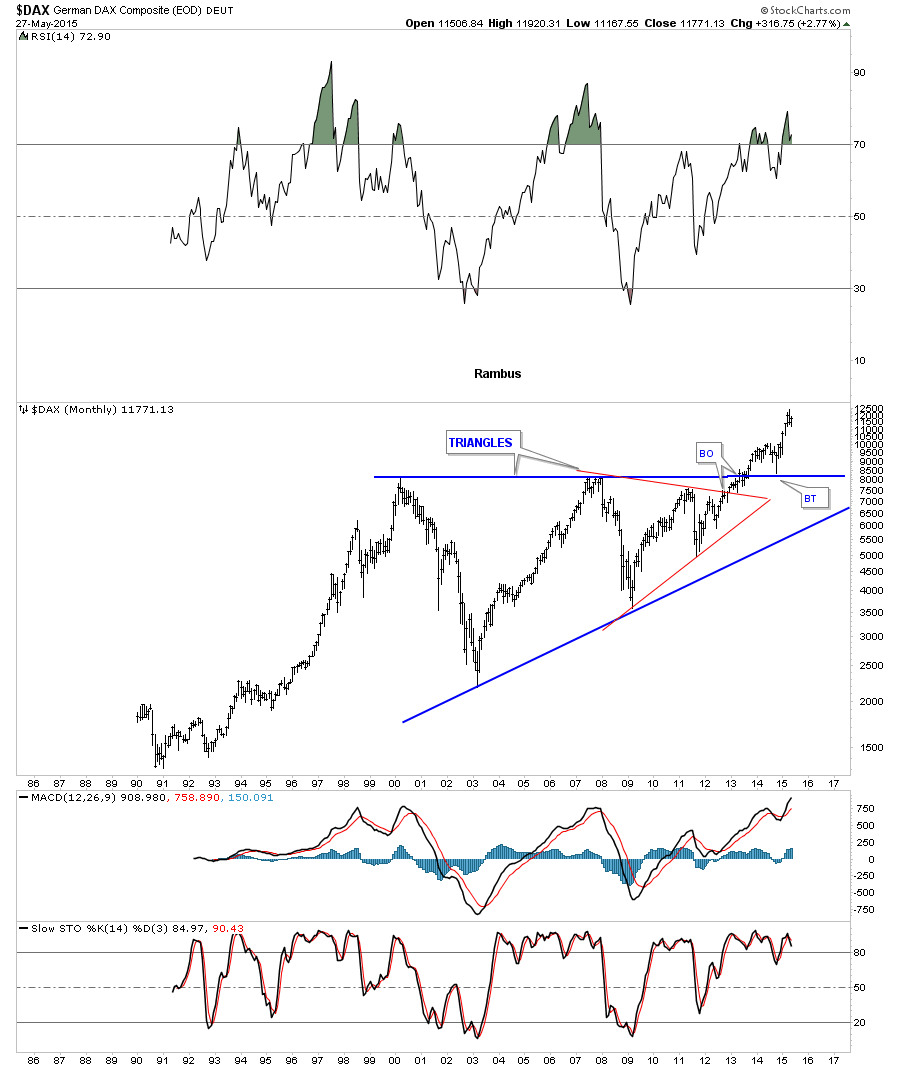
Even some of the European stock markets are getting into the act. Below is a long term monthly chart for the DAX that shows its big 13 year triangle consolidation pattern. Note how the top blue rail held support during the October correction last year.
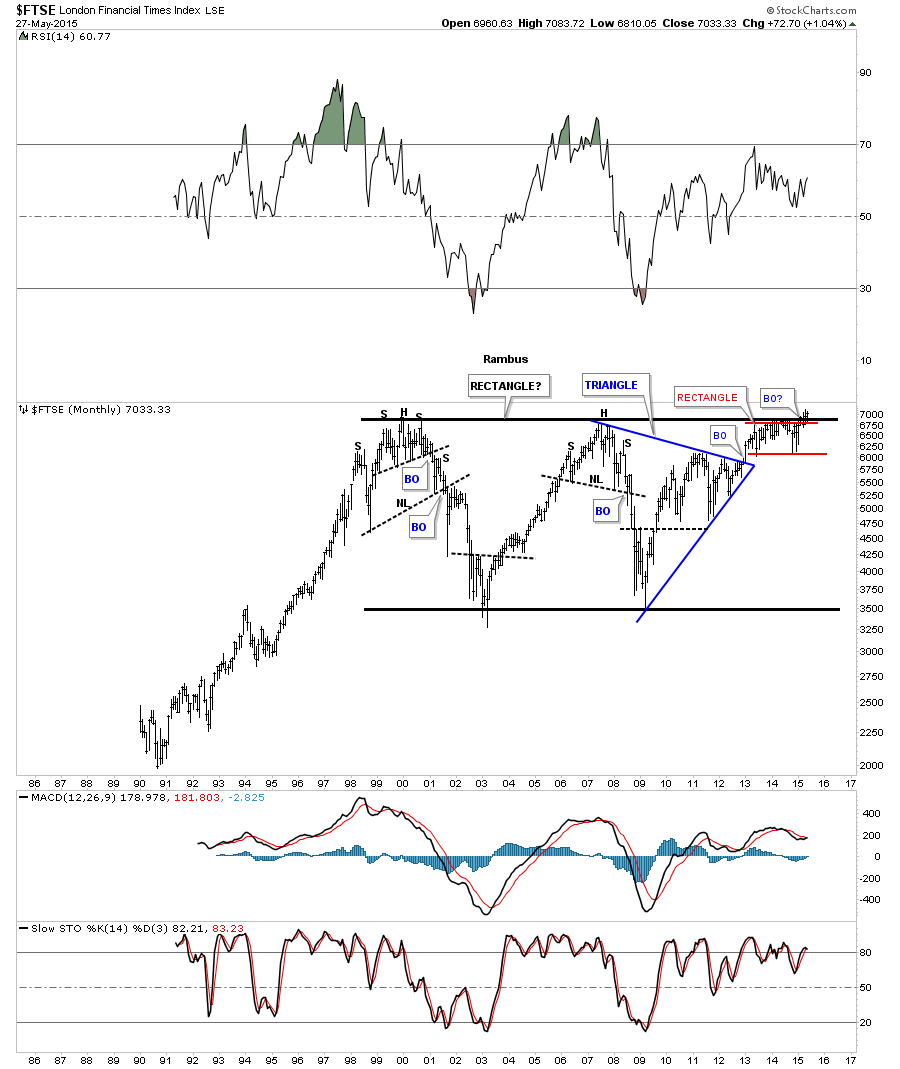
The FTSE is now just breaking out of a massive 15 rectangle consolidation pattern. Note the smaller red consolidation pattern that has formed just below the top rail of the 15 year rectangle. This is usually a very bullish setup.
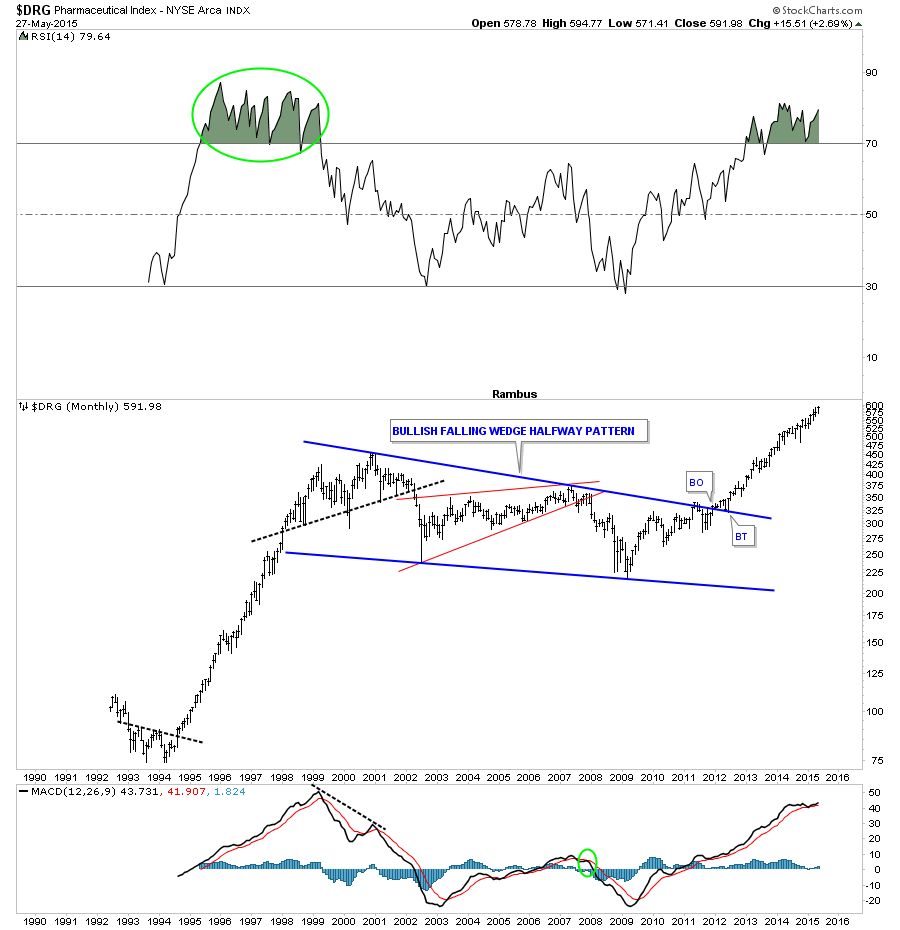
Below is a monthly chart for $DRG, pharmaceutical index, that shows it created a massive 12 year bullish falling wedge. As this index is further along in its impulse move vs some of the tech indexes weve looked at earlier you can begin to see how the big bullish falling wedge is showing up between the lower impulse move up and the new impulse move up that started at the last reversal point in the blue falling wedge. Think of this chart as a template for some of the indexes we looked at above that are just breaking out of their massive consolidation patterns.
Right now I have about 20 semiconductor and networking stocks that have similar massive consolidation patterns that are and have been in breakout mode for sometime now. I plan on showing you some of these stocks over the next several days that I will put into a new long term portfolio that WILL NOT BE TRADED. This portfolio will be a buy and hold portfolio. With this portfolio Im going to let the markets work for us and not the other way around. Sit tight and be right. All the best Rambus