-- Published: Monday, 13 July 2015 | Print | Disqus
By Rambus
In this Weekend Report Im going to show you some more of the same precious metals stocks weve been following as more are joining the impulse move to the downside adding confirmation. Unlike the US stocks markets that have been trading sideways since the December high of last year, the precious metals stocks are in a confirmed impulse move down and thats where the real money is made.
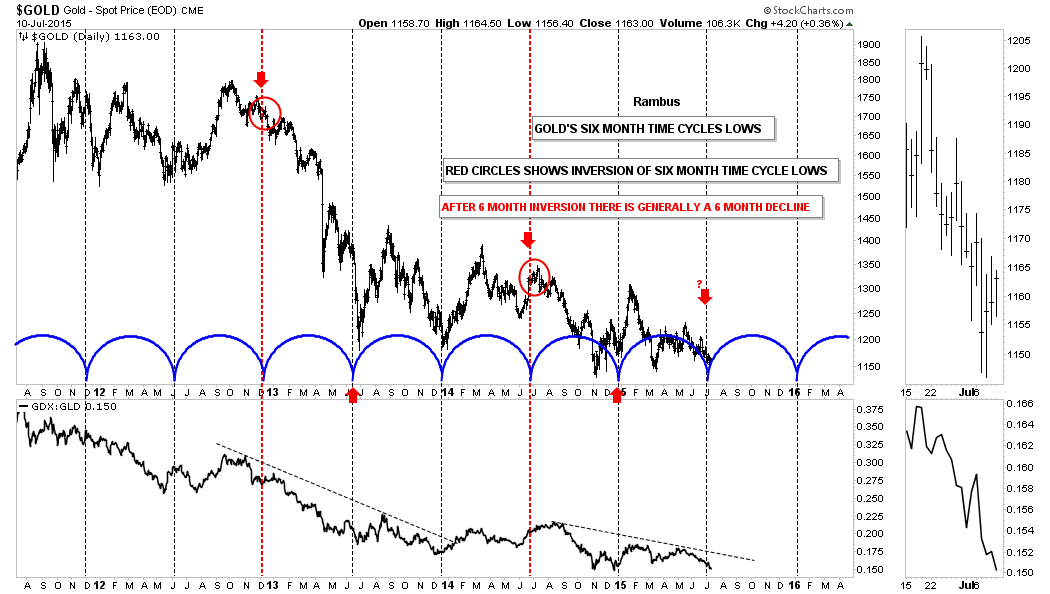
Before we get into the individual precious metal stocks I know a lot of folks follow the six month time cycles for gold which has a good track record for finding a good low to buy. There is defiantly a six month cycle bottom but sometimes it inverts meaning it will be a top instead of a bottom. As it stands right now we are at the point where the six month time cycle is due. On the three year chart below is the six month time cycles that I have followed for many years which shows this time of the year is often a good place to take a position. Also on this six month time cycles chart you will see two inverted six month time cycles that show, instead of making a low, gold was making a high, red arrows. When that six month cycle bottom inverts gold generally will decline for close to six months, red circles. Our current situation is shown by the last red arrow on the right hand side of the chart with the question mark.
The next chart for gold shows the six month time cycles going back to the 2008 crash low. From the crash low in 2008 to the bull market top in 2011 you could bet the farm that the six month time cycle bottom was going to come into play. Along with the Chartology at the time, red consolidation pattern, that near parabolic rally was a whole lot easier to play than our four year bear market that is punctuated by just two consolidation patterns so far, the blue two year rectangle at the top of the chart and our current two year falling wedge pattern that still hasnt broken down yet. This six month time cycle is slightly different than the one above by a few weeks or so.

Shortly after I became aware of the bull market in the precious metals stocks in the spring of 2002 everyone was taking about the six month time cycle for gold. As I was curious I built out my own chart for the HUI which also shows the six month time cycles. It quickly became apparent to me that there was something to the six month time cycles for the PM complex. When I began working on the six month cycle bottoms for the HUI I had an epiphany moment similar to the one I had on the US dollar when I first discovered the two huge fractal bottoms that long term members will remember. Keep in mind we are taking about the middle of 2003 when I discovered what I call, THE SEQUENTIAL 6 MONTH TIME CYCLES, for the lack of a better name.
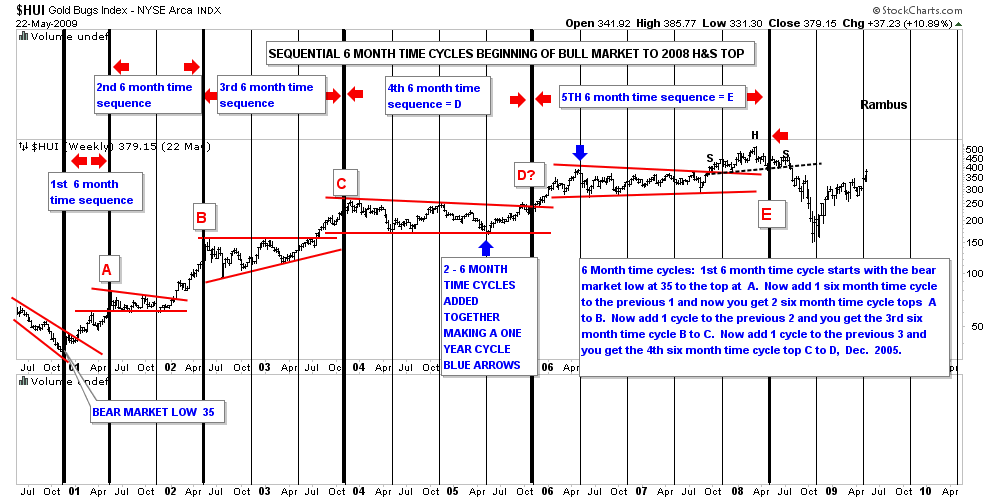
When I looked at the bull market that begun in 2000 for the HUI the six month time cycle stuck out like a sore thumb. The chart below is a static chart that goes from 2000 to the 2008 H&S top. The thin black vertical lines are the six month time cycles and the heavy thick vertical lines are the sequential six month time cycles tops. What I discovered back then was each six month cycle top was growing further apart by six months. Note the first impulse move up in the HUIs brand new bull market, marked with the red A. That rally lasted six months before the first consolidation pattern was built. Now notice there are two six month time cycles between the tops at A and B with one thin black vertical line showing a six month cycle low within the red triangle. Next you have the rally to the sequential six month cycle top at C which is made up of three six month time cycles before the next consolidation pattern started to build out.
Now were entering into the fourth sequential six month time cycle. Note the reversal points within the red triangle that shows each reversal point came during the smaller six month time cycle. This sequential six month time cycle was actually off by six months as shown by D? which should have been the next top. I clearly remember thinking at the time, what did this mean, as the HUI wasnt following the script as it had before. I still knew the smaller six month time cycles were dominate and the Chartology suggested that the HUI was breaking out of a two year triangle consolidation pattern so I held on. The blue arrows shows that impulse move that lasted one year and ended at the first reversal point in the red triangle within the 5th sequential six month cycle.The fifth sequential six month top ended during the formation of the 2008 H&S top. It didnt nail the top to a tee but again with Chartology on my side I could see the H&S top forming and mentioned it at a website I was posting on at the time. Im not going to mention anyones name Sir Fullgoldcrown, but at that time nobody and I mean nobody was looking for a serious correction back then. I believe I took more flack for calling that H&S top than any other top Ive ever called.
Editors Note:
http://rambus1.com/?p=12205
One last note on the chart below. Notice where the 2008 crash low stopped, right on a six month time cycle that launched the sixth sequential cycle top which I will show you after this chart.
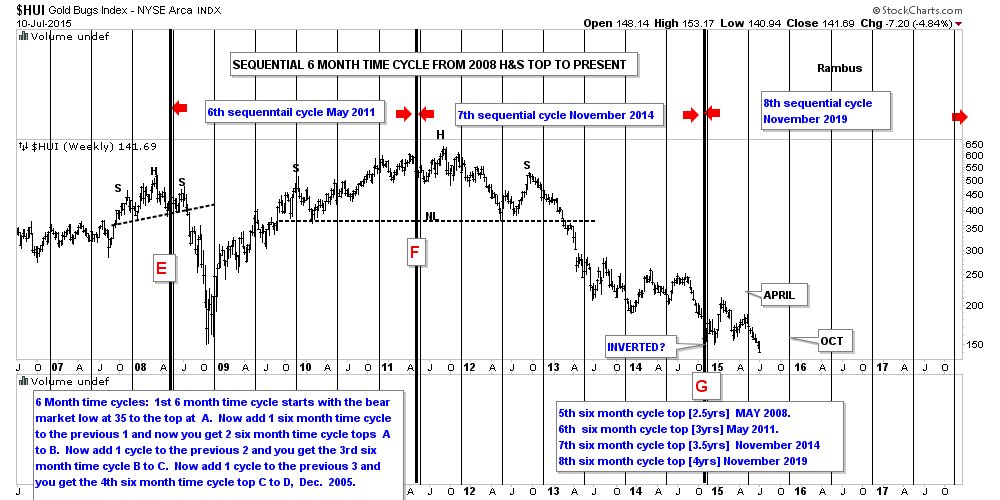
This next chart starts where the last chart above left off. The sixth sequential cycle top was now three years long with the sequential six month cycle top due in May of 2011 point F on the chart below. Again notice the smaller thin vertical lines which mark the smaller six month time cycles within the massive H&S top.
That brings us up to the seventh sequential six month time cycle top. This was the first major failure for the sequential cycle tops at G which also marks the smaller six month time cycle low that came last year in November. The smaller six month time cycle marked the beginning of our latest consolidation phase that I believed ended at the April high of this year. Earlier in the bull market the six month time cycles were usually in May and November but for the last several years October and April have marked the six month cycles.
One last very important note on the chart below. Notice where the next six month time cycle comes into play. Does October of 2015 ring a bell? If we see the HUI falling in to the October time frame I think there will be initially a strong bounce that may mark the end of the bear market and the beginning of a bottoming formation that will take some time to develop. How long is anyones guess but the initial bounce off a bottom is usually very strong. Think of a super ball. The first bounce will be the highest and strongest.
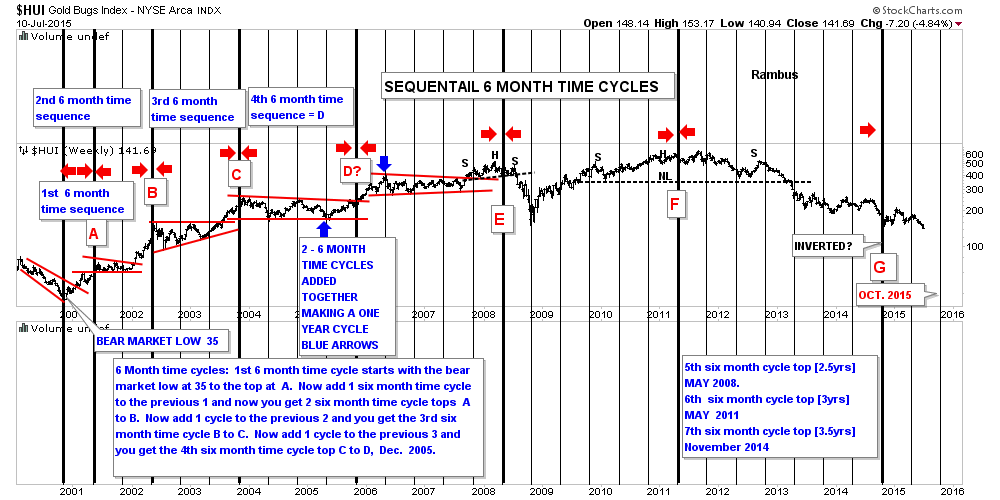
This last chart for the HUI shows the complete sequential six month time cycles going all the way back to the beginning of the bull market in 2000 to the present. Ive always said the precious complex creates some of the best chart patterns and symmetry of all different descriptions that you just dont find everywhere. That is one reason Ive never believed in the manipulation theories. If the precious metals complex was being manipulated then I believe you would have very ugly Chartology along with cycles and symmetry. Nature strives for symmetry and we are just a part of nature creating these chart patterns.
Now I would like to update you on some of the PM stocks Ive been showing you over the last month or so that are showing us what is actually happening under the surface. I have place some price objectives at the bottom of the charts so we can get a feel for when this next low, that Im expecting in October, to occur.
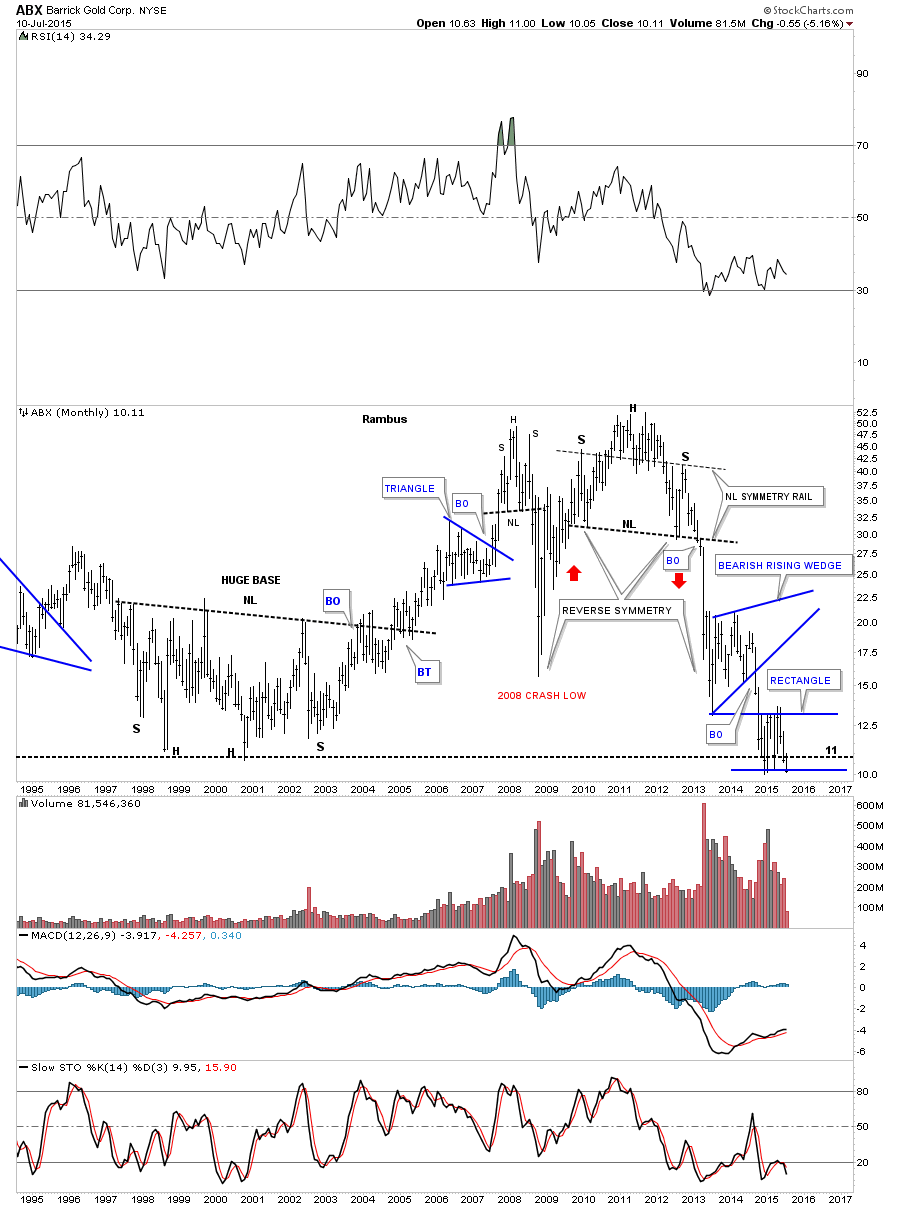
Lets start with ABX which is now testing the bottom rail its blue rectangle consolidation pattern.
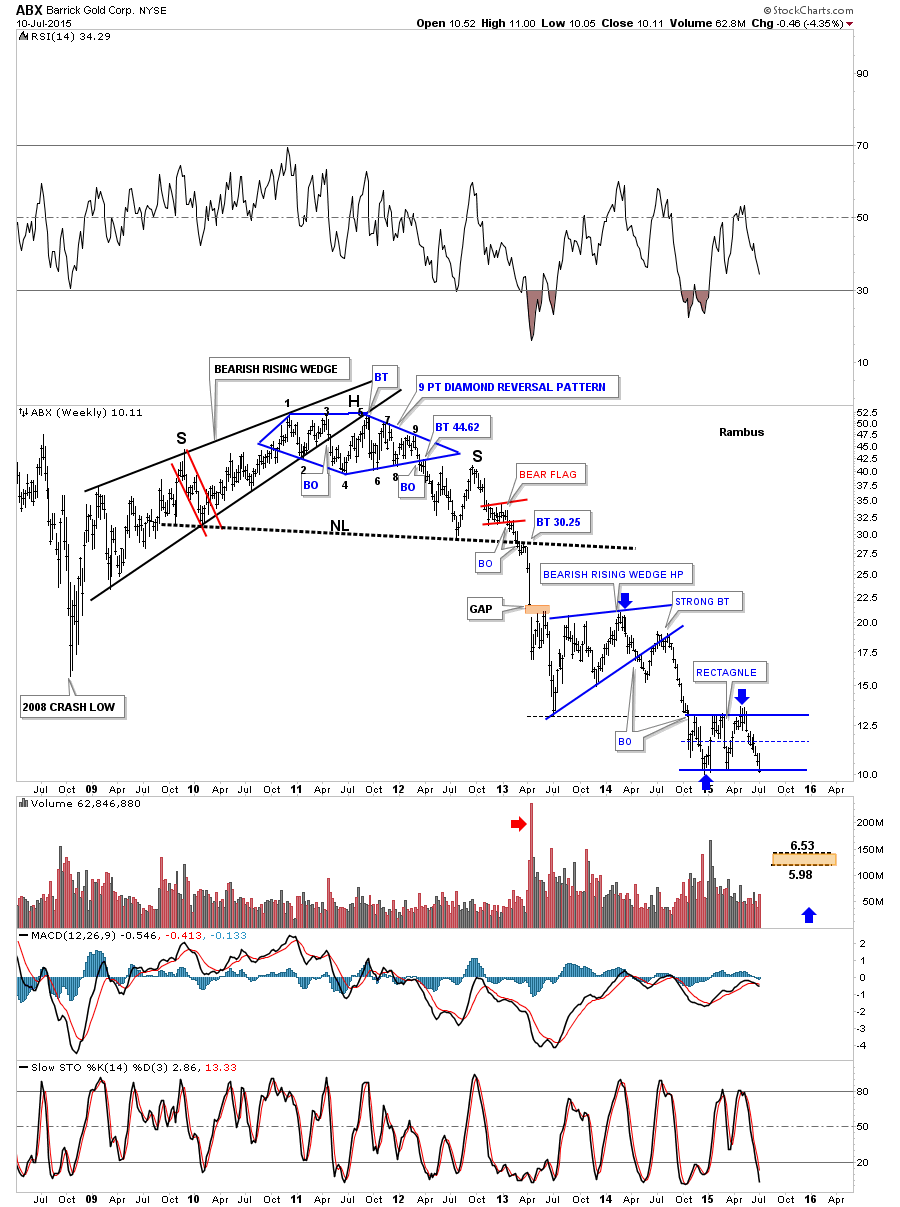
Anyone who has bought ABX over the last 20 years is underwater.
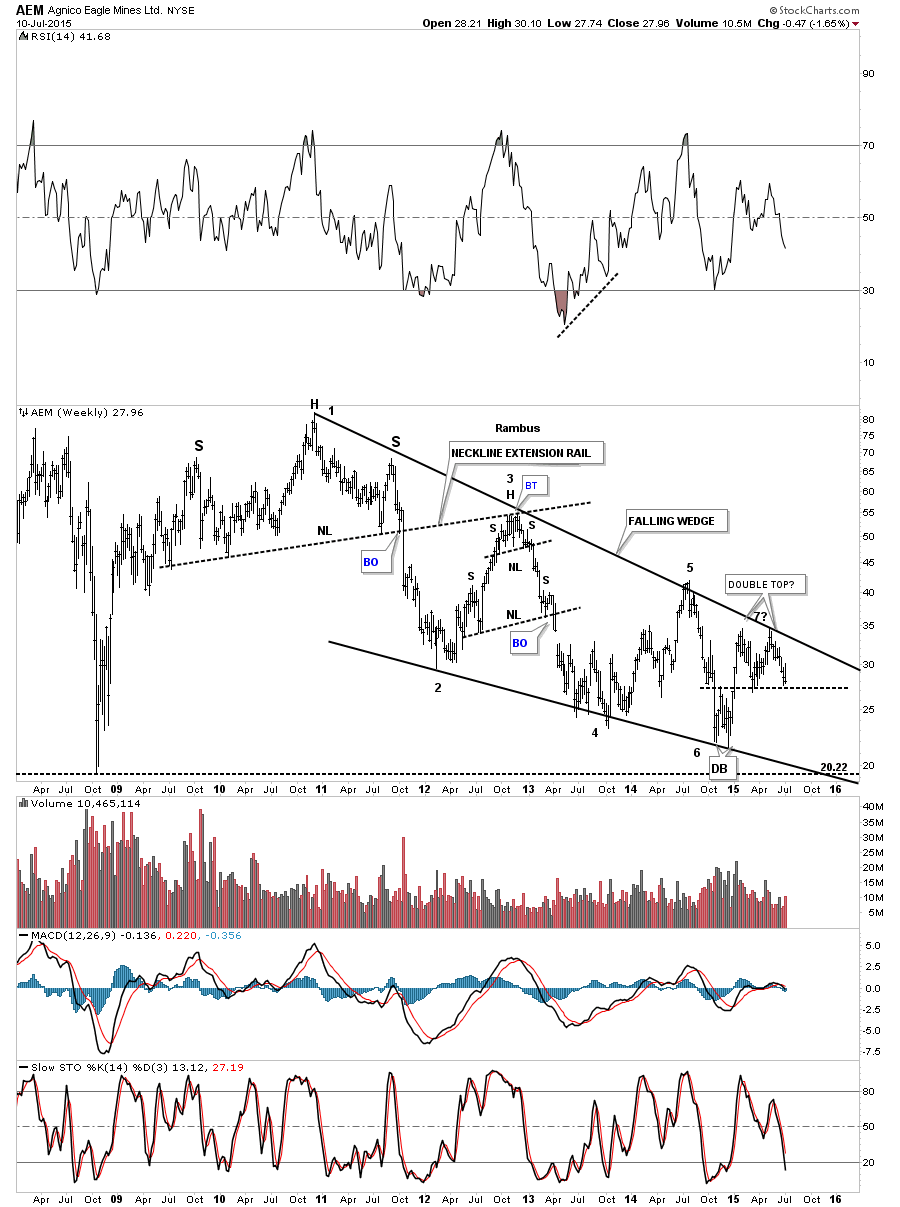
Is AEM building out a double top at reversal point #7?
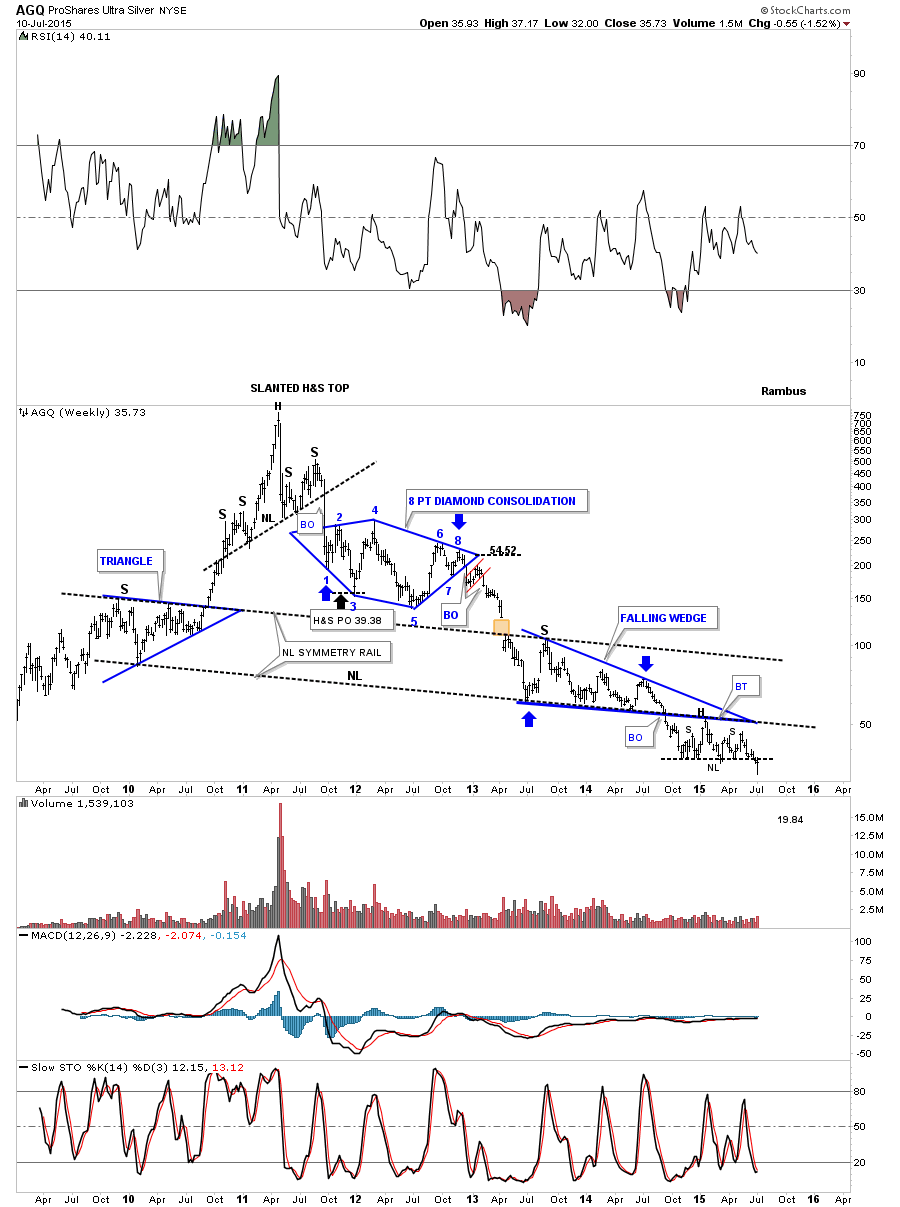
AGQ is a silver etf that is in the process of backtesting its neckline.
ASA is following through to the downside after breaking out from its red triangle consolidation pattern just two weeks ago.
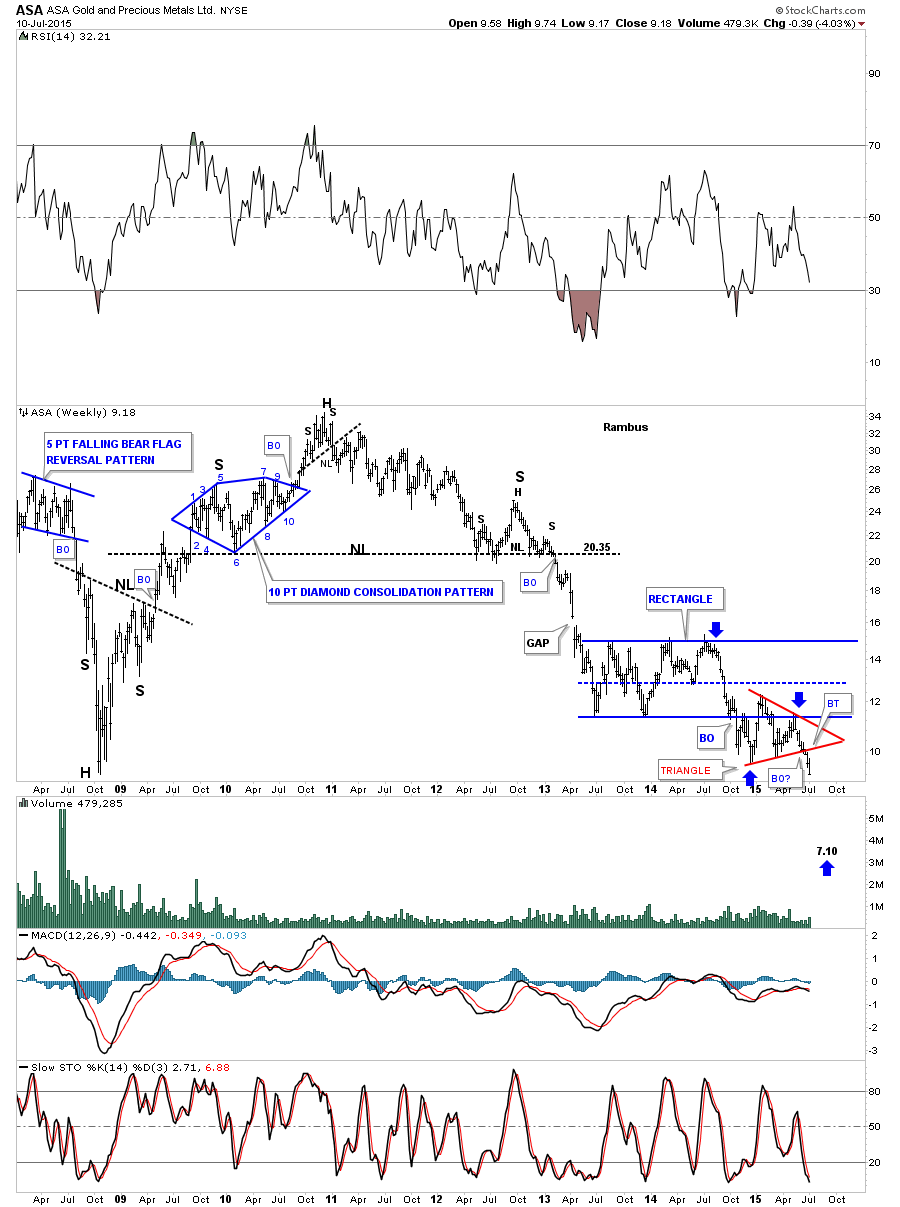
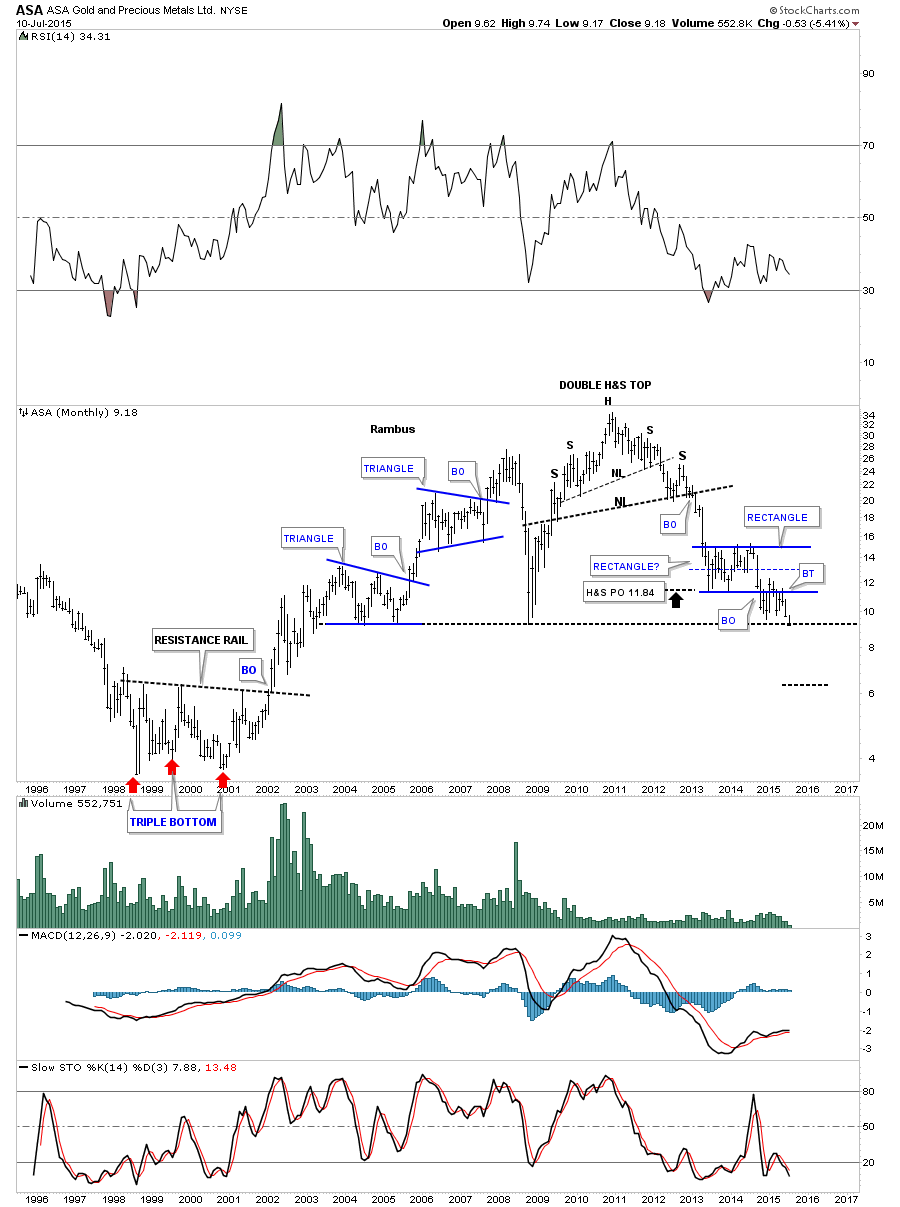
The monthly chart for ASA shows just how critical this area is right here. Note all the previous lows going all the way back to 2003.
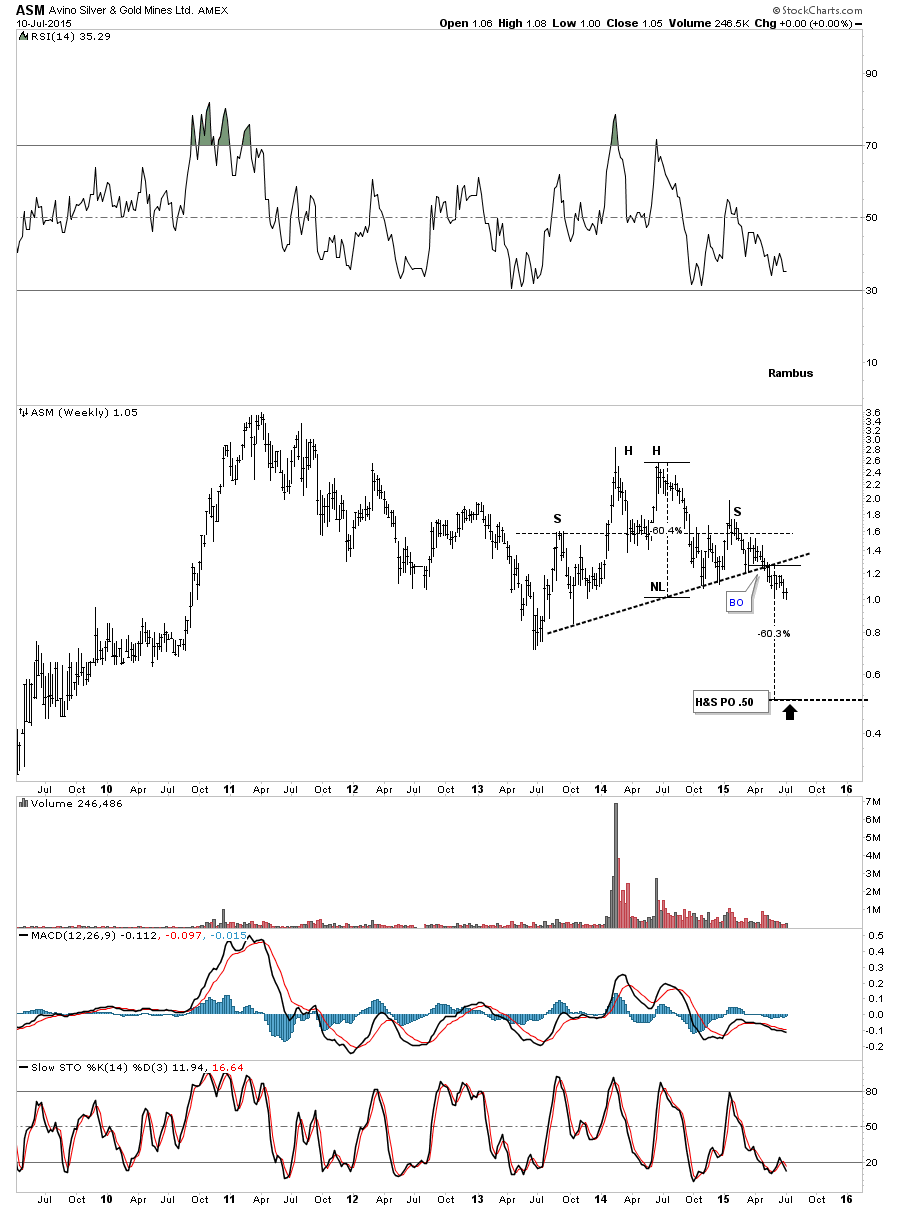
ASM is still working its way lower after breaking out from a H&S top.
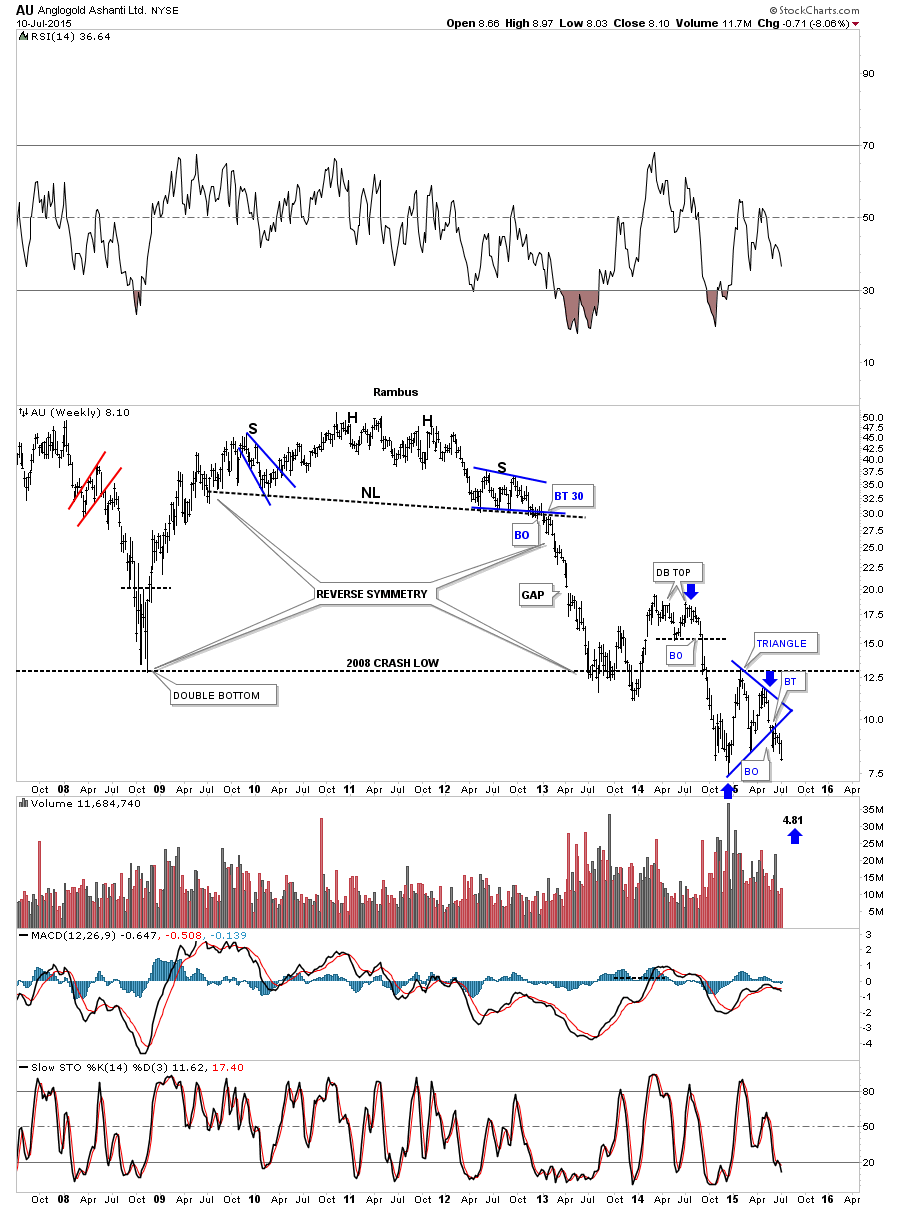
AU is moving lower after backtesting the bottom rail of its blue triangle consolidation pattern.
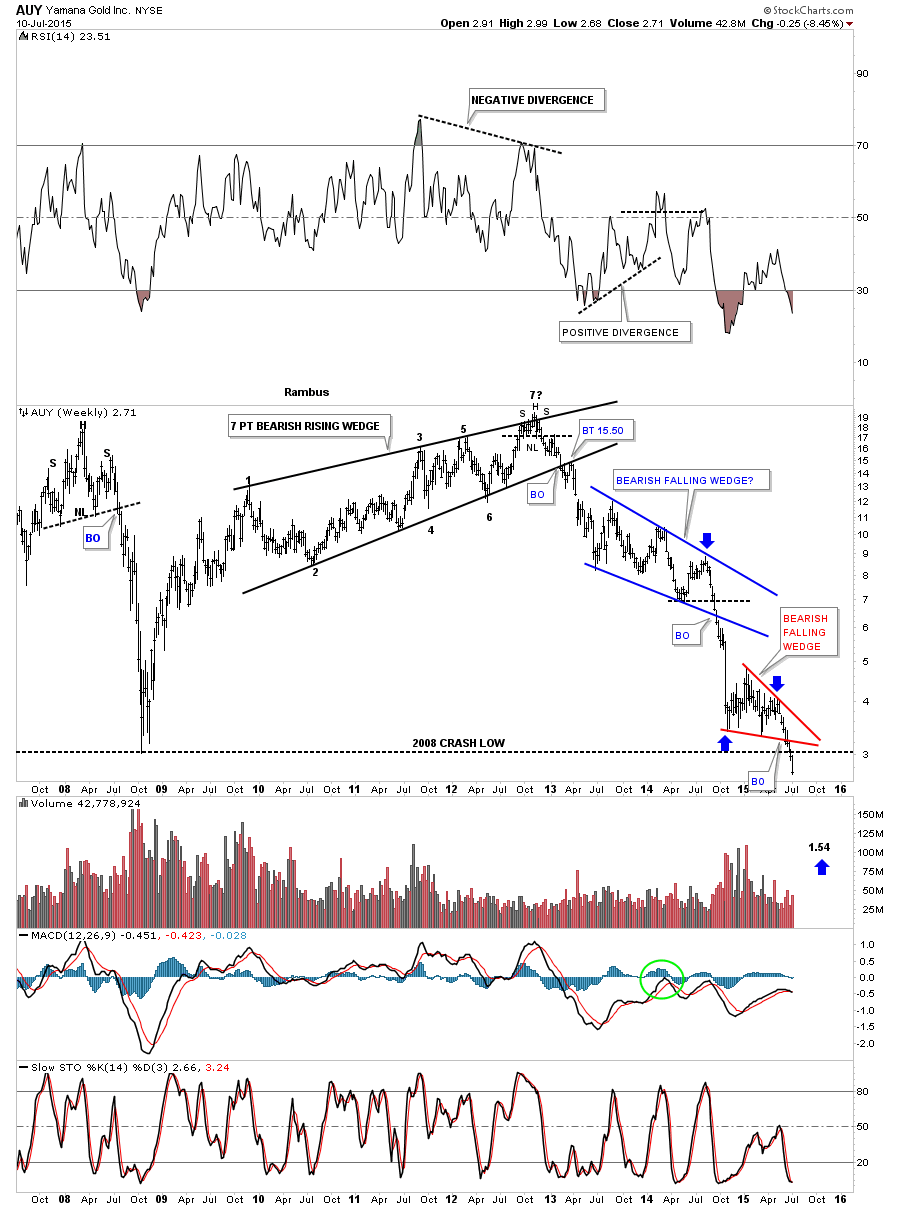
AUY is breaking below its 2008 crash low after breaking out from the red bearish falling wedge.
These are only the PM Stocks starting with and A But one can get the idea .The rest of the Multitude of PM Miners Charts that I follow will be posted in a separate post for Subscribers :
The reason Im spending so much time and energy showing you all these precious metals stocks is to give you confidence that the impulse move is for real. It doesnt take a rocket scientist to see all these consolidation patterns breaking down from the November low from last year. We are in an impulse move down in the precious metals stocks that has a very good chance to run until October / November of this year. Thats still another three to four months away and will be right at a year which is normal for the pm stocks. Go back and look at the HUI time cycles charts I posted earlier. You will see several of the big impulse moves up and out of the red consolidation patterns that took to close a year to complete. These types moves dont come around everyday.
When youre looking at your minute charts and start to get nervous on a small pattern that might be forming see how it relates to the big picture that I just showed you on all these stocks above. The big picture trumps the minute charts in the long run. This impulse move still has much further to run before it runs out of gas per all the consolidation patterns that are just now breaking out to the downside. October / November is a reasonable time for this impulse move to finish. I hope we all end up at the finish line together
All the best
Rambus
http://rambus1.com/
| Digg This Article
-- Published: Monday, 13 July 2015 | E-Mail | Print | Source: GoldSeek.com


