-- Published: Friday, 17 July 2015 | Print | Disqus
By Steve St. Angelo, SRSrocco Report
While the global financial system remained subdued in the first quarter of 2015, the U.S. Gold Market still suffered a large trade deficit. Matter-a-fact, the U.S. Gold Market deficit in 2015 may surpass its full-year shortfall in 2014 by a wide margin. Furthermore, with the heightened financial turmoil stemming from the Greek situation in Europe during the summer, I would imagine U.S. gold deficits may be even higher in the second and third quarter.
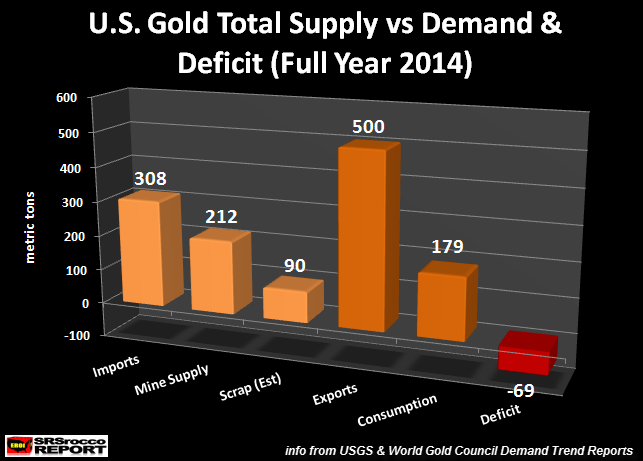
Before we look at the data for the first quarter of 2015, let’s take a peak at the U.S. gold supply and demand situation for the full-year 2014:

Last year, the U.S. imported a total of 308 metric tons (mt) of gold, had domestic mine supply of 212 mt and scrap of 90 mt (my estimates based on GFMS 2014 World Gold Survey). Thus, total U.S. gold supply was 610 mt. Now, on the demand side of the equation, the U.S. exported 500 mt of gold and consumed a total of 179 mt in jewelry and coin-bar investment. Hence, total U.S. gold demand in 2014 was 679 mt.
Apply simple math, the U.S. gold market suffered a 69 mt (2.2 million oz) deficit in 2014. However, I believe the deficit was probably larger. Why? The World Gold Council Demand Trend Report may be understating physical gold investment demand.
For example, The World Gold Council stated that U.S. physical gold investment in 2014 (bar & coin) was only 46.7 mt (1.5 million oz) while gold jewelry demand was 132.4 mt (4.2 million oz). I believe there was more than 46.7 mt of physical gold investment in 2014. Unfortunately, many private minted gold bars are not accounted for in the World Gold Council estimate.
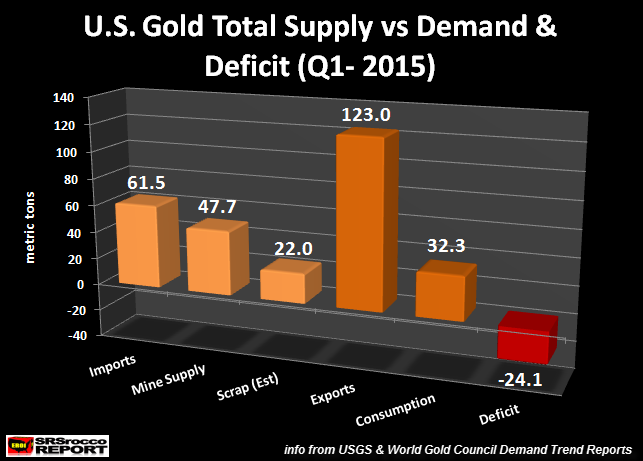
Regardless, the U.S. suffered a gold market trade deficit in 2014, and 2015 looks like it will be even larger. According to the recent data put out by the USGS Gold Mineral Industry Surveys and the World Gold Council Q1 2015 Demand Trend Report, the U.S. suffered a 24.1 mt deficit during the first quarter of the year:

U.S. gold imports during Q1 2015 were 61.5 mt, mine supply was 47.7 mt and estimated scrap came in at 22 mt for a total of 131.3 mt of total supply. On the other hand, U.S. gold exports reached 123 mt in the first three months of the year while consumption accounted for 32.3 mt. Thus, total U.S. gold demand was 155.3 mt leaving a deficit of 24.1 mt for Q1 2015.
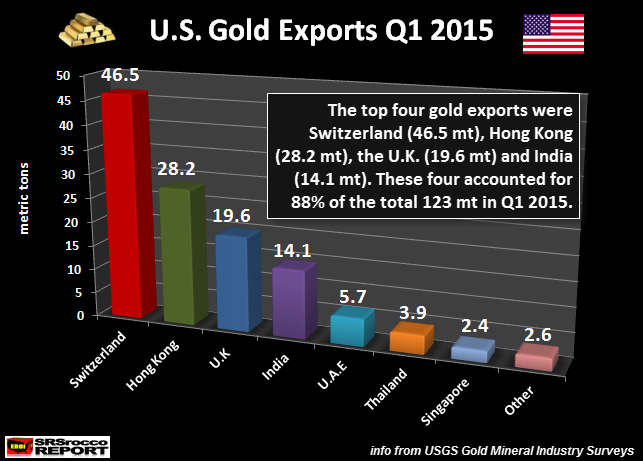
Where did the U.S. export all this gold? Switzerland received the most (46.5 mt), followed by Hong Kong (28.2 mt), the U.K. (19.6 mt), India (14.1 mt), the U.A.E. (5.7 mt), Thailand (3.9 mt), Singapore (2.4 mt) and other countries (2.6 mt) for a total of 123 mt during Q1 2015:

The top four (Switzerland, Hong Kong, U.K. & India) received 108.4 mt–88% of the total. It will be interesting to see the data for June and July as the financial situation in Europe due to a possible Greek default sparked investors to purchase a record amount of Gold Eagles. I would imagine U.S. gold exports will likely increase significantly during these two months as well. This should make the U.S. Gold Market deficit larger in Q2 and possibly Q3.
I will provide updates when the information and data is released.
Please check back for new articles and updates at the SRSrocco Report. You can also follow us at Twitter below:
